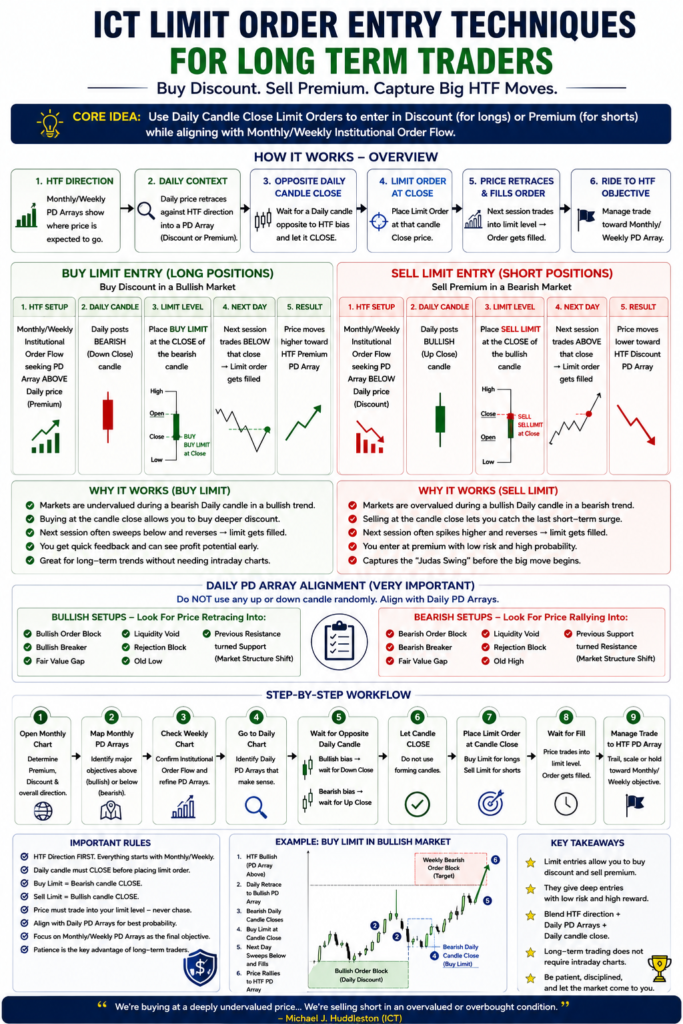
Limit Order Entry Techniques For Long Term Traders are used in ICT trading to enter higher time frame market moves during temporary periods of overvaluation or undervaluation.
This concept is taught by Michael J. Huddleston, founder of ICT (Inner Circle Trader), in the ICT Mentorship Core Content – Month 5.
The method combines higher time frame Institutional Order Flow with Daily candle closes.
The basic idea is:
Monthly/Weekly PD Array defines direction → Daily price moves temporarily against that direction → Place a Limit Order at the opposing Daily candle close
For bullish conditions:
Bearish Daily candle → Buy Limit at candle close
For bearish conditions:
Bullish Daily candle → Sell Limit at candle close
The trader is attempting to buy a deeper Discount in a bullish market or sell a deeper Premium in a bearish market.
What Are Limit Order Entry Techniques For Long Term Traders?
The ICT Limit Order Entry Technique is a Daily chart execution model for traders following Monthly and Weekly market objectives.
The higher time frame determines where price is expected to go.
The Daily chart determines where the trader attempts to enter.
The process is:
Identify Monthly/Weekly draw on price
↓
Determine bullish or bearish Institutional Order Flow
↓
Wait for an opposing Daily candle
↓
Allow the Daily candle to close
↓
Place a Limit Order at the candle closing price
The candle cannot be used while it is still forming.
The Daily close must first be confirmed.
Higher Time Frame PD Arrays Come First
The Daily candle alone is not a trade setup.
Before placing a Limit Order, the Monthly or Weekly chart should suggest that price is being drawn toward a specific PD Array.
For bullish conditions, the trader wants a Premium PD Array above Daily market price.
This may include:
- Bearish Order Block
- Bearish Breaker
- Fair Value Gap
- Liquidity Void
- Mitigation Block
- Rejection Block
- Old High
The logic is:
HTF Premium objective above
↓
Institutional Order Flow suggests higher prices
↓
Look for Daily long entries
For bearish conditions, the trader identifies a Discount PD Array below Daily market price.
The framework becomes:
HTF Discount objective below
↓
Institutional Order Flow suggests lower prices
↓
Look for Daily short entries
The Monthly and Weekly charts provide the narrative.
The Daily chart provides the entry mechanism.
Buy Limit Entry Technique for Long Positions
For a bullish Limit Order setup, the Monthly or Weekly chart should suggest price is seeking a PD Array above current Daily market price.
The Daily chart must then form a bearish or Down Close candle.
The setup becomes valid only after the Daily candle closes.
The trader places a Buy Limit at the closing price of the bearish Daily candle.
The process is:
Bullish HTF narrative
↓
Premium PD Array above price
↓
Daily bearish candle forms
↓
Wait for the candle to close
↓
Mark the bearish candle close
↓
Place Buy Limit at the close
The expectation is that the next Daily session may temporarily trade below the previous bearish candle close.
When this occurs, the Buy Limit is filled.
Why Buy at the Bearish Candle Close?
The trader is attempting to buy a temporarily undervalued market while the larger Institutional Order Flow remains bullish.
Michael J. Huddleston explains:
“We’re buying at a deeply undervalued price.”
Suppose the Monthly and Weekly charts indicate higher prices.
The Daily chart temporarily moves lower.
A bearish candle closes.
This represents short-term weakness inside the larger bullish condition.
The Limit Order attempts to take advantage of additional weakness during the following session.
The price progression may look like:
HTF bullish market
↓
Daily retracement
↓
Bearish candle closes
↓
Next session moves below the close
↓
Buy Limit filled
↓
Bullish Institutional Order Flow resumes
The trader is buying during Discount rather than waiting for price to expand higher.
Best Conditions for a Buy Limit Entry
The Buy Limit Technique is particularly useful when the market has already shown willingness to move higher.
For example:
- Bullish Market Structure Break has occurred.
- Price has displaced higher.
- A Bullish HTF PD Array has supported price.
- Monthly or Weekly Institutional Order Flow is bullish.
- A Premium PD Array remains unmet above price.
The market does not need to be at the absolute long-term low.
Michael J. Huddleston explains that traders do not always need the major turning point:
“You don’t necessarily need the big turning points at the top or the bottoms. You just need to meet in between.”
A trader can enter after the larger move has already started and still participate in a significant higher time frame expansion.
Buy Limit Entry Rules
The bullish Limit Order model can be summarized as:
Monthly/Weekly Bias = Bullish
HTF Draw on Price = PD Array above Daily market price
Daily Candle = Bearish or Down Close
Entry Order = Buy Limit
Entry Level = Bearish Daily candle close
Suppose a bearish Daily candle closes at:
1.2500
The trader may place:
Buy Limit = 1.2500
For the order to fill, price must retrace to or below the Limit Order level according to the broker’s execution conditions.
The trader then manages the position toward the higher time frame Premium objective.
Sell Limit Entry Technique for Short Positions
The Sell Limit Technique is the opposite of the bullish model.
The Monthly or Weekly chart should suggest Institutional Order Flow is seeking a PD Array below Daily market price.
The Daily chart should then form a bullish or Up Close candle.
The candle must completely close.
The trader places a Sell Limit at the bullish Daily candle’s closing price.
The process becomes:
Bearish HTF narrative
↓
Discount PD Array below price
↓
Daily bullish candle forms
↓
Wait for candle close
↓
Mark the bullish candle close
↓
Place Sell Limit at the close
The expectation is that price may move above the previous Daily close during the following session.
The trader is attempting to sell a short-term overvalued market.
Why Sell at the Bullish Candle Close?
The bullish Daily candle represents a temporary movement against the higher time frame bearish Institutional Order Flow.
Price is temporarily moving higher.
This can create a short-term Premium.
Michael J. Huddleston explains:
“We’re selling short in an overvalued or overbought condition.”
The process is:
HTF bearish market
↓
Daily bullish retracement
↓
Up Close candle forms
↓
Next session trades above the close
↓
Sell Limit filled
↓
Bearish price delivery may resume
The trader attempts to sell the final portion of the temporary rally before price continues toward the higher time frame Discount objective.
Sell Limit Entry Rules
The bearish model can be summarized as:
Monthly/Weekly Bias = Bearish
HTF Draw on Price = PD Array below Daily market price
Daily Candle = Bullish or Up Close
Entry Order = Sell Limit
Entry Level = Bullish Daily candle close
For example:
A bullish Daily candle closes at:
150.50
The trader places:
Sell Limit = 150.50
If price retraces higher into the Limit Order level, the short position may be filled.
The position is then managed toward the HTF Discount objective.
Do Not Trade Every Up Candle or Down Candle
One of the most important rules of the ICT Limit Order Entry Technique is that the candle cannot be used by itself.
A bearish candle is not automatically a Buy Limit setup.
A bullish candle is not automatically a Sell Limit setup.
Michael J. Huddleston explains:
“We’re not just indiscriminately going out and finding up candles and down candles.”
The Daily candle should preferably align with a relevant PD Array.
For a long setup, the Daily retracement may trade into:
- Bullish Order Block
- Bullish Breaker
- Fair Value Gap
- Liquidity Void
- Rejection Block
- Old Low
- Previous resistance acting as support
For a short setup, the Daily rally may trade into:
- Bearish Order Block
- Bearish Breaker
- Fair Value Gap
- Liquidity Void
- Rejection Block
- Old High
- Previous support acting as resistance
The complete model is:
HTF directional narrative + HTF PD Array objective + Daily PD Array + Opposing Daily candle + Limit Order
Buying Daily Discount in a Bullish HTF Market
Suppose the Weekly chart shows a Bullish Order Block supporting price.
A Weekly Bearish Order Block remains above current market price.
The Weekly Bearish Order Block is the Premium objective.
Price starts moving higher.
During the expansion, the Daily chart forms a bearish candle.
The setup becomes:
Weekly Bullish Order Block supports price
↓
Weekly Premium PD Array remains above
↓
Daily price retraces
↓
Bearish Daily candle closes
↓
Buy Limit placed at the candle close
↓
Price trades into the Limit Order
↓
Long position filled
↓
Price continues toward Weekly Premium
The Daily weakness creates the entry opportunity.
The Weekly chart provides the reason for holding the position.
Selling Daily Premium in a Bearish HTF Market
Suppose the Monthly and Weekly charts indicate lower prices.
A Weekly Bullish PD Array remains below current market price.
The Daily chart temporarily rallies into a Bearish Order Block.
A bullish candle closes.
The progression becomes:
HTF Discount objective below
↓
Daily price rallies
↓
Bearish Daily PD Array reached
↓
Bullish Daily candle closes
↓
Sell Limit at candle close
↓
Price retraces above the close
↓
Short position filled
↓
Price seeks the HTF Discount objective
The trader is selling temporary Daily strength inside a larger bearish market condition.
Limit Order Entry vs Stop Entry Technique
ICT teaches both Limit Order and Stop Entry Techniques for long-term traders.
The difference is the price used for execution.
Buy Stop Entry
Bearish Daily candle → Buy Stop at candle OPEN
The trader waits for price to trade higher through the opening price.
This uses strength to enter long.
Buy Limit Entry
Bearish Daily candle → Buy Limit at candle CLOSE
The trader attempts to enter during additional weakness.
This buys a deeper short-term Discount.
For short positions:
Sell Stop Entry
Bullish Daily candle → Sell Stop at candle OPEN
The trader waits for weakness before entering short.
Sell Limit Entry
Bullish Daily candle → Sell Limit at candle CLOSE
The trader attempts to sell additional short-term strength.
The simple difference is:
Stop Entry = Confirmation through directional movement
Limit Entry = Attempt to obtain a deeper Premium or Discount entry
Limit Orders Can Capture the Last Short-Term Price Surge
During bearish conditions, price may temporarily rally before the larger decline begins.
The Sell Limit Technique attempts to participate in this final short-term movement higher.
ICT relates this type of movement to the Judas Swing concept.
A market may:
Open
↓
Move higher
↓
Create a short-term high
↓
Reverse
↓
Begin significant bearish delivery
The Limit Order allows the trader to position during the short-term overvaluation.
The same concept is reversed for bullish trades.
Price may temporarily decline below the previous Daily close before beginning the larger move higher.
You Do Not Need Intraday Charts to Capture Large Moves
A major lesson behind Limit Order Entry Techniques For Long Term Traders is that significant price movement can be captured using Daily execution.
The trader does not necessarily need:
- 1-minute chart
- 5-minute chart
- 15-minute chart
- Intraday scalping
If a clear Monthly or Weekly objective exists, several Daily entry opportunities may develop during the larger move.
In the USD/JPY example discussed by ICT, multiple Daily Down Close candles created possible Buy Limit opportunities while price was moving toward a Weekly Premium PD Array.
The historical examples presented included potential movements of approximately:
1,800 pips
980 pips
785 pips
600 pips
500 pips
360 pips
These figures relate to the specific historical example used to explain the technique and should not be viewed as expected or guaranteed future returns.
The key lesson is that a trader does not always need to catch the exact low to participate in a meaningful higher time frame move.
Multiple Limit Entry Opportunities During a Long-Term Trend
A long-term bullish market can form several bearish Daily candles.
Each qualifying candle may create a potential Buy Limit setup.
The progression may look like:
HTF bullish objective remains unmet
↓
Daily Down Close
↓
Buy Limit opportunity
↓
Bullish expansion
↓
New Daily retracement
↓
New Down Close
↓
Another Buy Limit opportunity
The same idea applies during bearish trends.
HTF bearish objective remains unmet
↓
Daily Up Close
↓
Sell Limit opportunity
↓
Bearish expansion
↓
New Daily rally
↓
New Up Close
↓
Another Sell Limit opportunity
The higher time frame objective keeps the trader focused on the larger price delivery.
How to Use Limit Order Entry Techniques For Long Term Traders
A practical ICT workflow is:
Open the Monthly chart
↓
Determine Premium, Discount, and overall market direction
↓
Identify the expected Monthly PD Array objective
↓
Move to the Weekly chart
↓
Confirm Institutional Order Flow
↓
Identify the Weekly draw on price
↓
Move to the Daily chart
↓
Find a supporting Daily PD Array
↓
Wait for a candle opposite the HTF direction
↓
Allow the Daily candle to completely close
↓
Bullish HTF bias → Buy Limit at bearish candle close
Bearish HTF bias → Sell Limit at bullish candle close
↓
Wait for price to retrace into the Limit Order
↓
Manage the trade toward the Monthly or Weekly PD Array objective
Do not chase price when an entry is missed.
A long-term trend may provide another Daily setup.
Final Thoughts
Limit Order Entry Techniques For Long Term Traders provide ICT traders with a structured method for entering long-term market moves from the Daily chart.
The core idea is simple.
For bullish conditions:
Monthly/Weekly PD Array above → Daily bearish candle closes → Buy Limit at candle close
For bearish conditions:
Monthly/Weekly PD Array below → Daily bullish candle closes → Sell Limit at candle close
The technique attempts to buy a short-term Discount inside a bullish market and sell a short-term Premium inside a bearish market.
However, the Daily candle is never used by itself.
The complete setup requires alignment between:
Higher Time Frame Institutional Order Flow
↓
Monthly or Weekly PD Array objective
↓
Daily PD Array context
↓
Opposing Daily candle
↓
Limit Order at the candle close
Michael J. Huddleston closes the lesson with an important question:
“Do you still think you need intraday trading to make pips?”
For long-term traders, the answer is no.
When the higher time frame draw on price is clear, Daily Limit Order entries can provide multiple opportunities to participate in a larger Monthly or Weekly market move without constantly monitoring lower time frame charts.