The ICT Market Structure Shift (MSS) concept is used to identify an initial change in the direction of price delivery. In the ICT methodology taught by Michael J. Hustructure is studied together with liquidity, displacement, time, and higher-timeframe narrative.
A Market Structure Shift does not simply mean that price crossed a random high or low. A meaningful ICT MSS occurs when price aggressively trades through a relevant swing point, showing that the previous short-term directional order flow may be changing. ICT’s official market-structure material emphasizes advanced structure study and micro-market structure within a broader time-and-price context. e words:
Liquidity event → Displacement → Swing point breaks → Market Structure Shift
The MSS can be used as confirmation that price may begin delivering toward a new liquidity objective.
What Is ICT Market Structure Shift?
An ICT Market Structure Shift, commonly called MSS, is the initial change in market structure caused by price breaking a significant swing high or swing low with strong directional movement.
A bullish MSS occurs when bearish price delivery changes and price aggressively breaks above a relevant swing high.
A bearish MSS occurs when bullish price delivery changes and price aggressively breaks below a relevant swing low.
The concept is commonly described as an initial or short-term shift in price delivery rather than automatic confirmation of a complete long-term trend reversal. tinction is important.
A 1-minute bearish MSS does not automatically mean the daily trend is now bearish.
It may simply indicate:
- A short-term retracement
- Intraday reversal
- Liquidity repricing
- Delivery toward another PD Array
- Beginning of a larger reversal
The higher-timeframe context determines the importance of the shift.
Understanding Market Structure Before MSS
To identify an ICT Market Structure Shift, first understand basic price structure.
Bullish Market Structure
In bullish conditions, price generally creates:
Higher High → Higher Low → Higher High → Higher Low
Price continues breaking previous highs while maintaining important swing lows.
Bearish Market Structure
In bearish conditions, price generally creates:
Lower Low → Lower High → Lower Low → Lower High
Price continues breaking previous lows while maintaining important swing highs.
An MSS appears when this existing delivery begins to change.
For example:
Bearish delivery → Break above relevant swing high = Bullish MSS
Bullish delivery → Break below relevant swing low = Bearish MSS
The swing point selected matters. ICT structure analysis separates short-, intermediate-, and longer-term swing structures, so breaking a minor candle high should not automatically be treated the same as breaking a meaningful structural swing. oes a Market Structure Shift Form?
A Market Structure Shift forms when the previous directional delivery of price loses control and aggressive repricing occurs in the opposite direction.
Suppose price is moving lower.
Price forms lower highs and lower lows.
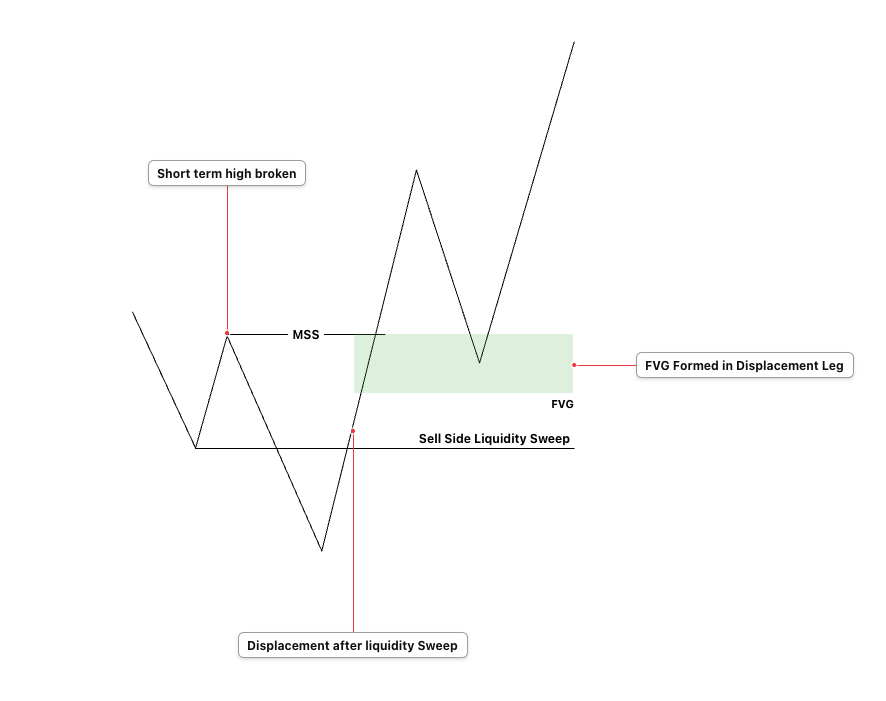
Then price trades below an old low and reaches an area where sell-side liquidity is available.
After taking the liquidity, aggressive buying enters the market.
Price rapidly moves higher and breaks a recent meaningful swing high.
This creates a bullish Market Structure Shift.
The basic narrative is:
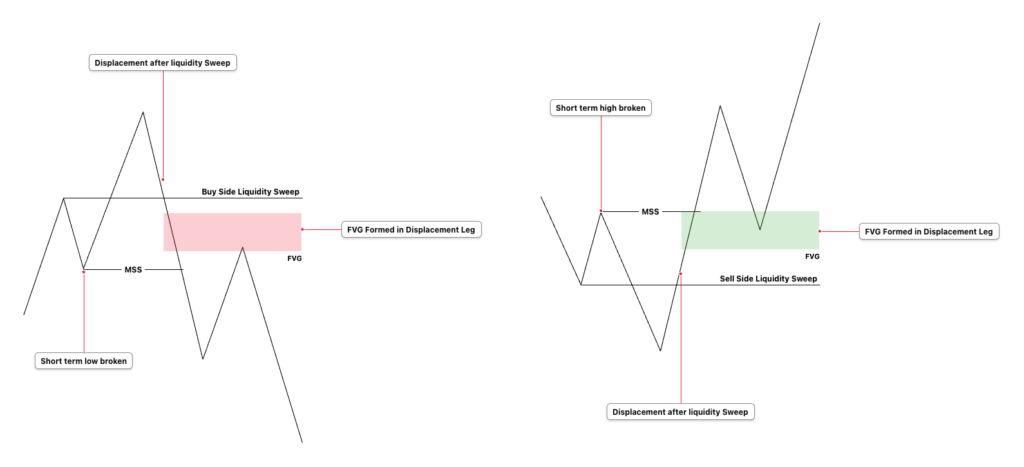
Sell-side liquidity taken → Strong bullish displacement → Swing high broken → Bullish MSS
The opposite process forms a bearish MSS.
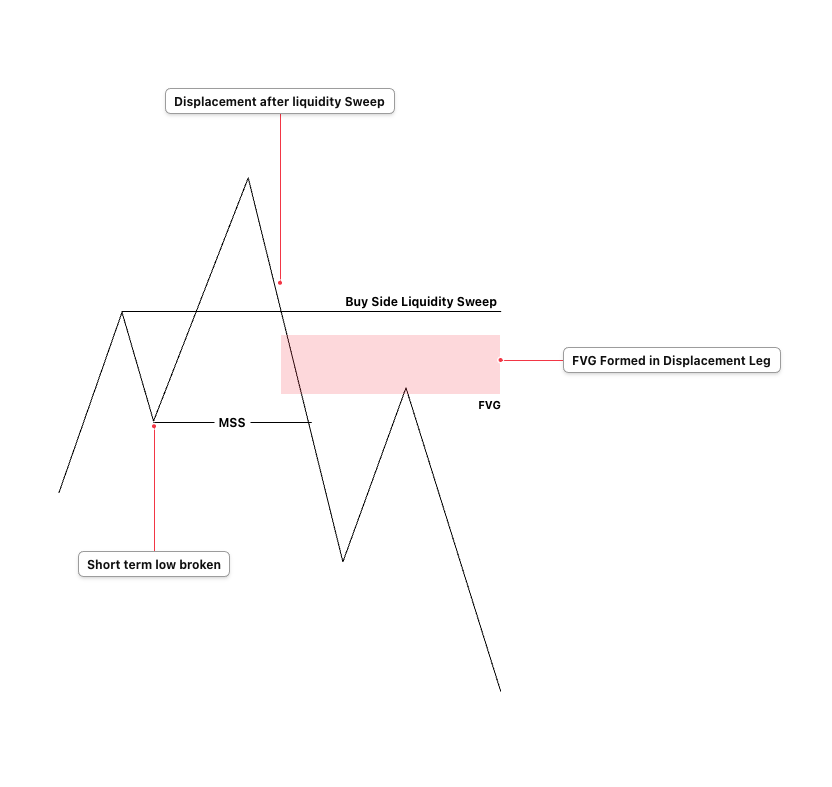
Buy-side liquidity taken → Strong bearish displacement → Swing low broken → Bearish MSS
Liquidity-sweep and MSS combinations are frequently used as a reversal framework because the liquidity event establishes context while the structure shift provides directional confirmation. Important Elements of a Valid ICT MSS
Not every break of structure should be marked as an MSS.
A stronger ICT Market Structure Shift normally contains three important elements.
1. A Meaningful Swing Point
Price should break a relevant swing high or swing low.
Do not mark every small candle high and low.
Ask:
- Is this swing clearly visible?
- Did this swing help create a new low or high?
- Is it part of the current directional price delivery?
- Will breaking it actually demonstrate a change in short-term structure?
The more meaningful the swing point, the more important the structural break.
2. Displacement
Displacement is one of the most important characteristics of an ICT MSS.
Price should move aggressively through the swing point.
The move generally appears as:
- Large candle bodies
- Strong directional movement
- Limited candle overlap
- Fast repricing
- Clear imbalance
The break should communicate urgency.
A weak movement slowly drifting through a swing level is different from an aggressive displacement move.
Descriptions of the ICT MSS concept consistently identify displacement through a swing point as a primary characteristic of the shift. ontext
The MSS should occur at a logical location.
For example:
- After buy-side liquidity is taken
- After sell-side liquidity is taken
- Inside a higher-timeframe Premium area
- Inside a higher-timeframe Discount area
- At an Order Block
- At a Fair Value Gap
- At a Breaker Block
- Near a higher-timeframe liquidity objective
- During an active ICT Killzone
- After a Judas Swing or session manipulation
Without context, traders may find Market Structure Shifts everywhere.
The MSS should confirm an existing market narrative.
It should not be used to invent a narrative.
Bullish ICT Market Structure Shift
A Bullish ICT Market Structure Shift indicates an initial change from bearish price delivery toward bullish delivery.
Suppose price is creating lower lows and lower highs.
Price then trades lower and takes sell-side liquidity.
After the liquidity sweep, price strongly moves higher.
The bullish displacement breaks a relevant swing high.
This is a Bullish MSS. A bullish MSS is commonly identified through displacement above a prior swing high. ence is:
Bearish delivery → Sell-side liquidity taken → Bullish displacement → Swing high broken → Bullish MSS
Example
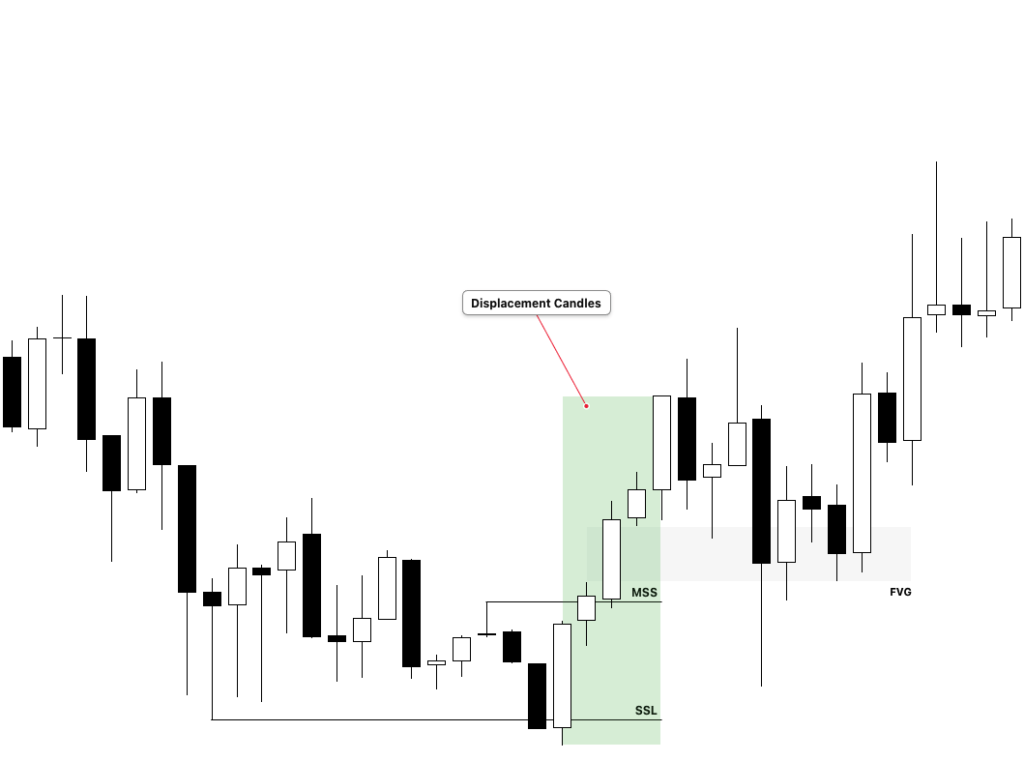
Price creates:
Low → Lower High → Lower Low
The lower low sweeps an old low.
Price then aggressively rallies through the previous lower high or relevant short-term swing high.
The break confirms a bullish shift in short-term price delivery.
After the MSS, a trader may wait for price to retrace into a bullish PD Array before looking for a long position.
Possible entry locations include:
- Bullish Fair Value Gap
- Bullish Order Block
- Bullish Breaker
- Discount area
- Optimal Trade Entry area
The objective may be buy-side liquidity above an old high.
Bearish ICT Market Structure Shift
A Bearish ICT Market Structure Shift indicates an initial change from bullish price delivery toward bearish delivery.
Suppose price is creating higher highs and higher lows.
Price trades higher and takes buy-side liquidity.
After taking liquidity, price aggressively moves lower.
The bearish displacement breaks a relevant swing low.
This creates a Bearish MSS. ence is:
Bullish delivery → Buy-side liquidity taken → Bearish displacement → Swing low broken → Bearish MSS
Example
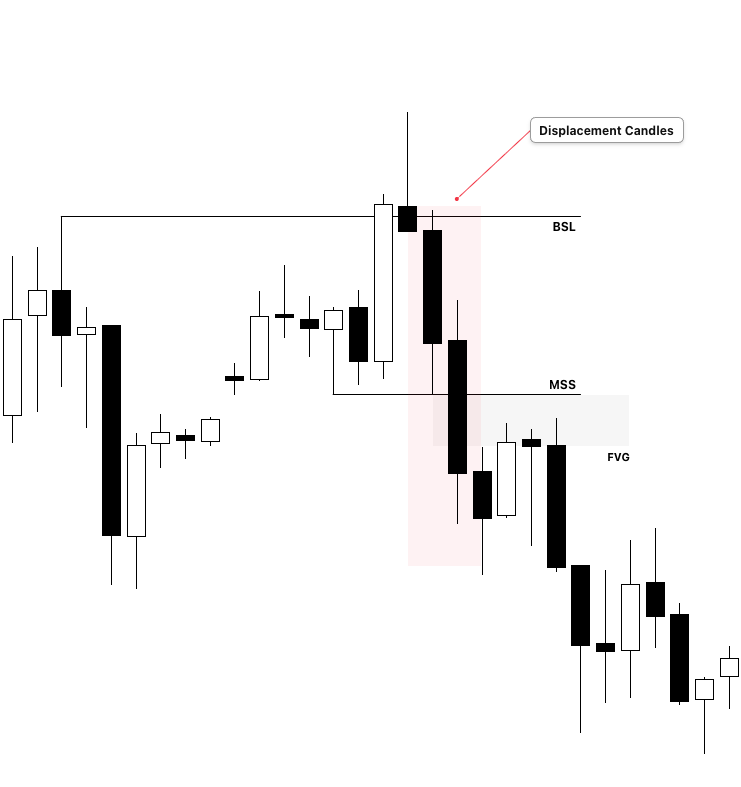
Price creates:
High → Higher Low → Higher High
The higher high sweeps an old high.
Price then rapidly sells lower and breaks the previous relevant swing low.
The movement signals a bearish Market Structure Shift.
A trader may wait for price to retrace into:
- Bearish Fair Value Gap
- Bearish Order Block
- Bearish Breaker
- Premium area
- OTE area
The downside objective may be sell-side liquidity below an old low.
Liquidity Sweep and Market Structure Shift
One of the strongest ways to use the ICT Market Structure Shift concept is after a liquidity sweep.
Why?
Because MSS alone only tells you that short-term delivery may have changed.
The liquidity sweep helps explain why price may reverse from that location.
Bullish Model
Sell-side liquidity → Sweep below low → Bullish MSS → Retracement → Long entry → Buy-side liquidity
Bearish Model
Buy-side liquidity → Sweep above high → Bearish MSS → Retracement → Short entry → Sell-side liquidity
This sequence combines liquidity context with structural confirmation. Similar liquidity-to-MSS-to-PD-Array frameworks are commonly used to separate contextual reversals from arbitrary structure breaks. Is Displacement in MSS?
Displacement represents aggressive repricing.
For example, imagine price is slowly moving higher.
The candles overlap.
Movement is weak.
Then a large bearish candle rapidly expands lower and breaks a swing low.
That aggressive movement is more meaningful than a weak wick below the swing.
A displacement move may also leave behind a Fair Value Gap, because price moved rapidly enough to create an imbalance.
Therefore, traders commonly look for:
Liquidity Sweep → Displacement → MSS → FVG
The FVG created during the displacement can later become a possible entry area.
However, traders should not treat the simple appearance of an FVG as automatic proof of a high-probability MSS. The broken swing and surrounding market narrative still matter. Displacement and FVG formation are often studied together, but the structural context remains essential. Price Need to Close Beyond the Swing Point?
A strong candle body closing through the structural level normally provides better confirmation than a simple wick through the level.
Why?
A wick may only represent a liquidity sweep.
For example:
Price trades above an old high.
A wick forms above the high.
Price immediately reverses lower.
This should not automatically be considered a bullish MSS.
It may simply be a buy-side liquidity raid.
For a stronger structure shift, traders generally want to see aggressive price delivery through the relevant swing point. Some MSS definitions specifically use a close beyond the prior swing, while broader explanations focus on displacement through the swing. e:
Wick through level = Possibly liquidity sweep
Strong displacement through level = Possible MSS
The quality of price delivery is important.
How to Trade the ICT Market Structure Shift
A simple way to use the MSS concept is to follow a structured process.
Step 1: Determine Higher-Timeframe Bias
Start with the higher timeframe.
Ask:
- Is price likely seeking buy-side or sell-side liquidity?
- Is price in Premium or Discount?
- What is the next draw on liquidity?
- Is price trading into a higher-timeframe PD Array?
The MSS should ideally support the higher-timeframe narrative.
Step 2: Identify Liquidity
Mark important liquidity.
Examples:
- Previous Day High
- Previous Day Low
- Asian Session High
- Asian Session Low
- London High
- London Low
- Equal Highs
- Equal Lows
- Old Swing High
- Old Swing Low
Wait for price to interact with the liquidity.
Step 3: Wait for the Liquidity Sweep
Do not immediately enter because price reached liquidity.
Observe the reaction.
For a bullish setup:
Wait for sell-side liquidity to be taken.
For a bearish setup:
Wait for buy-side liquidity to be taken.
Step 4: Identify Displacement
After the liquidity sweep, look for aggressive movement in the expected direction.
Bullish setup:
Strong bullish displacement
Bearish setup:
Strong bearish displacement
Step 5: Confirm the MSS
Mark the relevant short-term swing.
For bullish confirmation:
Price breaks above the swing high
For bearish confirmation:
Price breaks below the swing low
The break should demonstrate a meaningful change in price delivery.
Step 6: Mark the PD Array Created by Displacement
The displacement may create:
- Fair Value Gap
- Order Block
- Breaker Block
- Inversion Fair Value Gap
Mark the most logical PD Array.
Step 7: Wait for Retracement
Do not chase the displacement candle.
Allow price to retrace.
Price may return toward the imbalance or another PD Array created during the MSS.
Step 8: Execute Toward the Draw on Liquidity
After entry, use the market narrative to determine the target.
Bullish target:
Buy-side liquidity
Bearish target:
Sell-side liquidity
The complete model is:
Higher-timeframe bias → Liquidity → Sweep → Displacement → MSS → PD Array retracement → Entry → Opposing liquidity
Best Entry After an ICT MSS
The MSS itself does not always provide the entry.
It provides confirmation of changing price delivery.
The actual entry may come from the retracement after the displacement.
FVG Entry
Wait for price to retrace into the Fair Value Gap created by the MSS displacement.
Bullish MSS → Bullish FVG → Buy
Bearish MSS → Bearish FVG → Sell
Order Block Entry
Identify the Order Block associated with the displacement move.
Wait for price to retrace into the Order Block.
Use the MSS as directional confirmation.
Breaker Block Entry
If a previous Order Block fails and price shifts structure in the opposite direction, a Breaker Block may provide a retracement entry.
OTE Entry
Measure the displacement price leg.
When the market narrative supports it, wait for a retracement into the ICT Optimal Trade Entry area.
The MSS gives the directional shift.
The PD Array provides the entry location.
Where to Place Stop-Loss After MSS
The stop-loss should be placed where the trade narrative becomes invalid.
For a bullish MSS setup, the stop may be positioned below:
- The liquidity sweep low
- Relevant swing low
- Bullish PD Array invalidation point
For a bearish MSS setup, the stop may be placed above:
- The liquidity sweep high
- Relevant swing high
- Bearish PD Array invalidation point
Do not place the stop randomly based only on a fixed number of pips.
Ask:
At what price level is my MSS trade idea structurally invalid?
That level should guide risk placement.
Market Structure Shift vs Break of Structure
MSS and Break of Structure are often confused.
Market Structure Shift
MSS identifies the initial change in price delivery.
Example:
Price is bearish.
Price breaks above a relevant swing high with bullish displacement.
This may create a bullish MSS.
Break of Structure
A Break of Structure is generally used to describe a structural break supporting an established directional market move or a broader structural transition, depending on the trader’s mapping model.
A useful simplified understanding is:
MSS = Initial directional shift
BOS = Structural continuation or broader structure confirmation
Different ICT/SMC educators sometimes use BOS terminology differently, which is one reason the underlying swing hierarchy and price-delivery context should be studied instead of relying only on labels. ICT-focused educational material distinguishes MSS as an initial shift in structure. s Change in State of Delivery
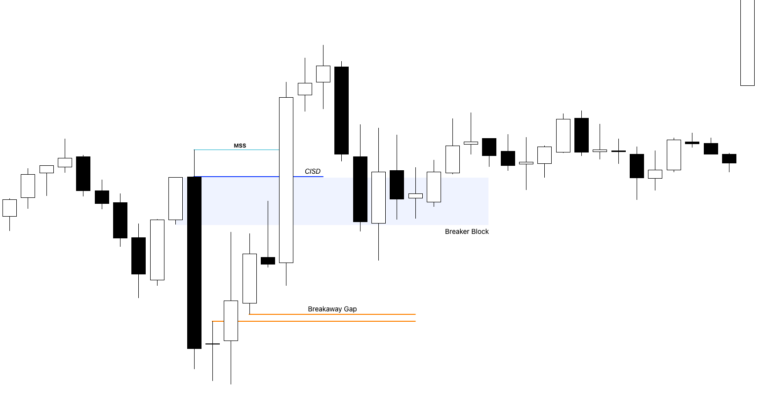
Market Structure Shift and Change in State of Delivery are not exactly the same concept.
MSS studies the break of a structural swing point.
CISD studies the change in the way price is being delivered through candle opening and closing behavior.
Therefore:
MSS = Structural confirmation
CISD = Change in price delivery
CISD may sometimes provide earlier information.
MSS may require price to travel farther before a relevant swing point is broken.
This is why some traders study CISD for early confirmation and MSS for structural confirmation. ICT-focused explanations distinguish MSS by its swing-structure focus and CISD by changes in directional price delivery. Probability ICT MSS Conditions
An MSS becomes more meaningful when multiple parts of the narrative agree.
Look for:
- Clear higher-timeframe bias
- Known draw on liquidity
- Buy-side or sell-side liquidity sweep
- Premium or Discount location
- Higher-timeframe PD Array
- Strong displacement
- Relevant swing point break
- Fair Value Gap created during displacement
- Active ICT Killzone
- Session manipulation
- SMT Divergence
- Logical opposing liquidity target
For example:
HTF bearish bias → Premium → Buy-side liquidity sweep → Bearish SMT → Bearish displacement → Bearish MSS → FVG retracement → Sell toward sell-side liquidity
This is much stronger than:
Random swing low breaks → Sell
When to Avoid Trading MSS
Avoid treating every MSS as a trade signal.
Random Middle-of-Range MSS
Price is in the middle of a range.
No liquidity has been taken.
No clear draw on liquidity exists.
An MSS in this location may have limited significance.
Weak Structure Break
Price slowly moves through the swing.
Candles heavily overlap.
There is no obvious displacement.
The break may not represent meaningful repricing.
MSS Against Higher-Timeframe Narrative
A small bullish MSS may occur while the higher timeframe remains strongly bearish.
The MSS may simply create a retracement.
Do not automatically assume a complete trend reversal.
MSS Before High-Impact News
Price can create temporary structural breaks before scheduled high-impact news.
News volatility may invalidate the short-term structure immediately.
Choppy Price Delivery
When price repeatedly breaks nearby highs and lows without sustained directional displacement, the market may be consolidating.
Multiple MSS signals can appear.
The solution is not to trade every shift.
The solution is to return to the higher-timeframe narrative and liquidity objective.
Common MSS Trading Mistakes
Marking Every High and Low
Every candle high is not a significant swing high.
Every candle low is not a significant swing low.
Study swing hierarchy.
Ignoring Displacement
A weak break is not the same as aggressive repricing.
Look at how price breaks the level.
Entering Directly on the Break
Traders often chase the displacement candle.
A better approach may be waiting for retracement into an FVG, Order Block, Breaker, or another valid PD Array.
Ignoring Liquidity
MSS becomes far more useful when traders understand what liquidity price interacted with before the shift.
Assuming MSS Means Complete Trend Reversal
An MSS can represent a short-term change.
Always check the timeframe.
Using MSS Without a Draw on Liquidity
Before entering, ask:
Where is price likely delivering next?
Without a target, the MSS is only a structural observation.
Simple ICT MSS Trading Model
A beginner can simplify the entire concept into one model.
Bullish MSS Model
Higher-timeframe bullish bias → Price trades into Discount → Sell-side liquidity taken → Bullish displacement → Swing high broken → Bullish MSS → Retracement into bullish FVG → Buy → Target buy-side liquidity
Bearish MSS Model
Higher-timeframe bearish bias → Price trades into Premium → Buy-side liquidity taken → Bearish displacement → Swing low broken → Bearish MSS → Retracement into bearish FVG → Sell → Target sell-side liquidity
Do not focus only on the structural break.
Study the complete story.
Final Thoughts
The ICT Market Structure Shift concept is a confirmation model used to identify an initial change in the directional delivery of price.
The core idea is simple:
Bullish MSS = Bullish displacement breaks a relevant swing high
Bearish MSS = Bearish displacement breaks a relevant swing low
However, the real value of MSS comes from context.
A random broken swing has little meaning by itself.
A structure shift that occurs after a liquidity sweep, inside a higher-timeframe PD Array, with strong displacement and a clear draw on liquidity provides a much stronger market narrative.
The practical ICT sequence is:
Bias → Liquidity → Sweep → Displacement → MSS → Retracement → Entry → Draw on Liquidity
Instead of using MSS as a simple buy or sell signal, use it as evidence that price delivery may have changed. Then combine that evidence with liquidity, time, PD Arrays, and higher-timeframe analysis before considering a trade.