ICT Consequent Encroachment, commonly abbreviated as CE, is the 50% midpoint of a price range, imbalance, gap, or ICT PD Array. The concept is used within the ICT (Inner Circle Trader) framework taught by Michael J. Huddleston to study how price interacts with the middle portion of a defined price delivery structure.
In ICT terminology, this midpoint may also be called the Mean Threshold. ICT’s official 2023 Mentorship playlist also includes material specifically titled around Mean Threshold Risk Management, showing the use of the concept within his price-action framework.
Consequent Encroachment is not simply a random 50% Fibonacci level. The trader must first identify a valid price structure or PD Array and then measure the midpoint of that specific range.
In simple form:
PD Array High + PD Array Low ÷ 2 = Consequent Encroachment
Price Range → Identify High and Low → Measure 50% → Mark CE
The CE becomes a sensitive price reference where traders watch for repricing, reaction, rejection, mitigation, or continued price delivery.
What Is ICT Consequent Encroachment?
ICT Consequent Encroachment is the 50% level of a defined price range or PD Array.
For example, suppose a Fair Value Gap exists between:
Upper Boundary = 20,100
Lower Boundary = 20,080
The difference is:
20,100 − 20,080 = 20 points
Half of the range is:
20 ÷ 2 = 10 points
Therefore:
20,080 + 10 = 20,090
The 20,090 price level is the Consequent Encroachment of the Fair Value Gap.
ICT traders commonly mark this midpoint because price may retrace into an inefficiency without completely filling the entire range. The 50% midpoint is therefore watched as an important internal reference inside the gap.
Why Is It Called Consequent Encroachment?
The idea describes price encroaching into a previously created price structure.
Suppose bullish displacement creates a Fair Value Gap.
Price expands upward and leaves an imbalance behind.
Later:
Price Retraces → Enters FVG → Trades Deeper Into FVG → Reaches 50%
Once price has reached the midpoint, it has consequently encroached into a meaningful portion of that imbalance.
Therefore, rather than expecting every Fair Value Gap to be completely filled, ICT traders may monitor the CE as a sensitive internal level.
A simple way to understand it is:
0% = Beginning of PD Array
50% = Consequent Encroachment
100% = Complete traversal of the PD Array
The same 50% measurement method can be applied to defined ICT price structures.
Consequent Encroachment vs Mean Threshold
Consequent Encroachment and Mean Threshold generally refer to the 50% midpoint of the measured price structure in ICT terminology.
The main idea remains:
High + Low → Measure the Range → Divide by Two → Mark 50%
For example:
Fair Value Gap → 50% = CE / Mean Threshold
Order Block → 50% = Mean Threshold
Opening Gap → 50% = CE
Price Wick → 50% = CE of the Wick
In practical chart analysis, traders sometimes use the term Consequent Encroachment more frequently with inefficiencies and gaps, while Mean Threshold is commonly discussed when measuring Order Blocks or other candle-based PD Arrays.
However, both concepts are centered around the midpoint or 50% threshold of the structure being measured.
Why Is the 50% Level Important in ICT Trading?
A price range can be separated into two halves:
Upper 50% → Premium portion
Lower 50% → Discount portion
The midpoint separates these two portions.
For a bullish PD Array, price may retrace into the structure, address its Consequent Encroachment, and then continue toward a higher draw on liquidity.
For a bearish PD Array, price may retrace upward into the structure, address CE, and continue toward lower liquidity.
Bullish Example:
Sell-Side Liquidity Taken → Bullish Displacement → Bullish FVG Forms → Price Retraces to CE → Bullish Reaction → Buy-Side Liquidity
Bearish Example:
Buy-Side Liquidity Taken → Bearish Displacement → Bearish FVG Forms → Price Retraces to CE → Bearish Reaction → Sell-Side Liquidity
The CE does not predict market direction independently. The trader must first understand bias, liquidity and the expected draw on liquidity. ICT-oriented educational material commonly places CE inside a broader trade flow involving directional bias, a PD Array and the next liquidity objective.
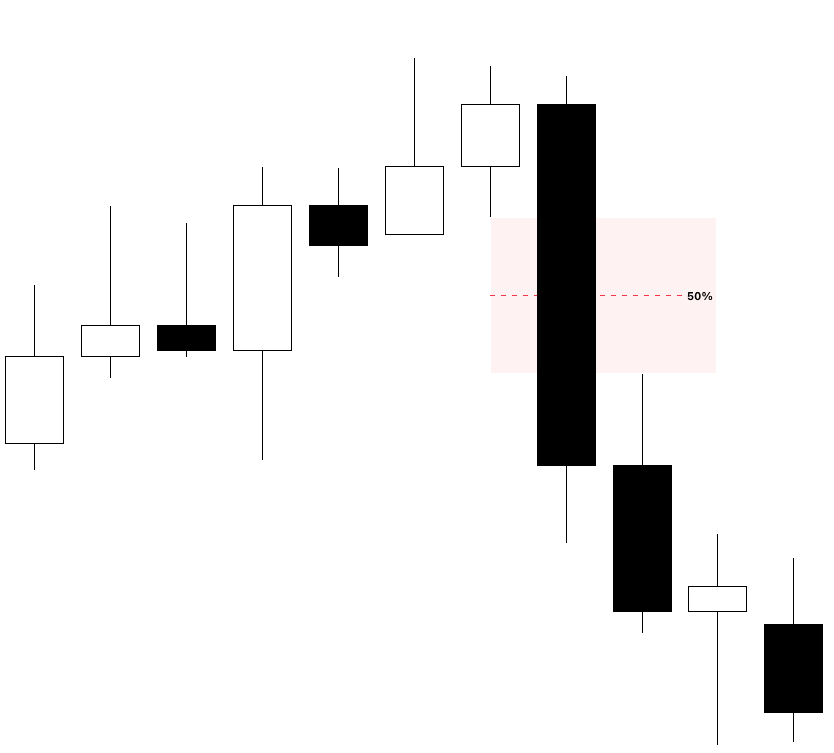
Consequent Encroachment of a Fair Value Gap
The Fair Value Gap is one of the most common structures where CE is used.
A bullish Fair Value Gap is created during bullish displacement when an unretraced area remains between the first and third candles of the three-candle sequence.
Once the FVG has been identified:
Mark FVG High → Mark FVG Low → Measure 50% → Mark CE
Suppose a bullish FVG exists between:
Low Boundary = 5,200
High Boundary = 5,204
The CE is:
5,200 + 2 = 5,202
Now assume price is trading above the FVG.
Price Retraces Lower → Enters FVG → Trades to 5,202 → Reacts Bullishly
The trader may interpret the reaction as evidence that the bullish imbalance is being respected.
A complete fill to 5,200 is not always required before a reaction occurs. This is one reason ICT traders monitor the midpoint of the FVG.
Bullish FVG CE
Bullish Displacement → Bullish FVG Created → Price Expands Higher → Retracement → CE Reached → Bullish Reaction
The trader expects the bullish FVG to support price only when it agrees with the broader market narrative.
Bearish FVG CE
Bearish Displacement → Bearish FVG Created → Price Expands Lower → Retracement → CE Reached → Bearish Reaction
In this situation, the CE may act as a sensitive price point within the bearish FVG.
Consequent Encroachment of an ICT Order Block
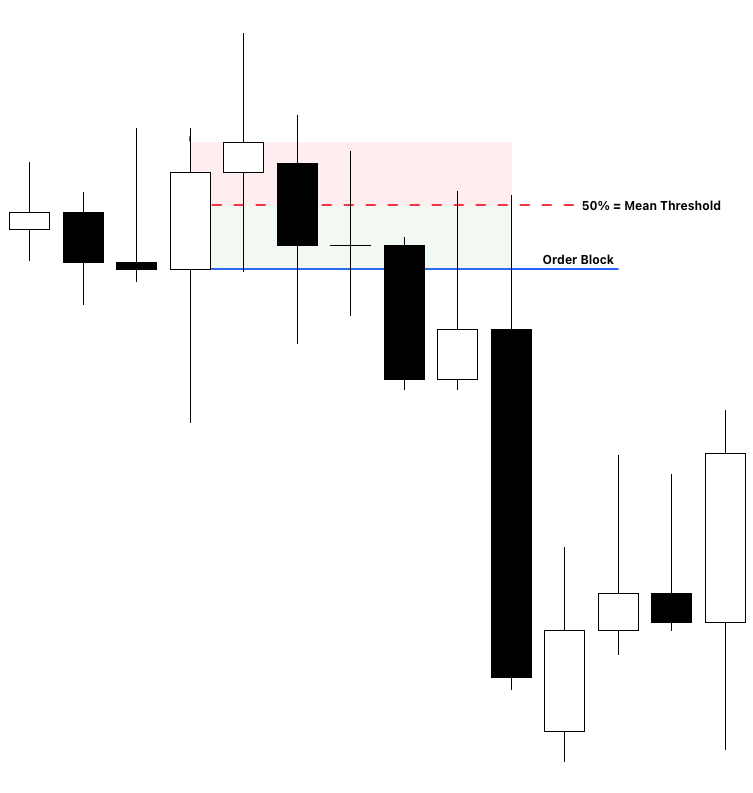
The midpoint concept can also be applied to an ICT Order Block.
Suppose a bullish Order Block has:
High = 19,800
Low = 19,760
The 50% Mean Threshold is:
19,780
The trader marks:
Order Block High → 19,800
Mean Threshold → 19,780
Order Block Low → 19,760
If price returns to the bullish Order Block, the trader watches how price behaves around the Mean Threshold.
Bullish Order Block → Price Retraces → Mean Threshold Tested → Strong Bullish Displacement
This may show that price did not need to trade through the complete Order Block before repricing higher.
The same logic can be reversed for a bearish Order Block.
Bearish Order Block → Price Retraces Higher → Mean Threshold Tested → Bearish Repricing
However, the Mean Threshold should never be used to label every candle midpoint as an Order Block entry. The underlying PD Array must first be valid within the ICT market narrative.
Consequent Encroachment of Wicks
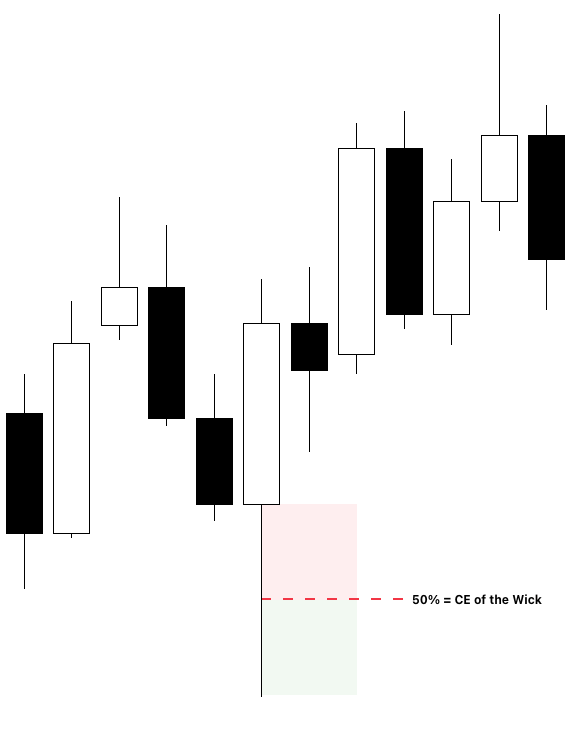
ICT Consequent Encroachment can also be measured on a specific candle wick.
First identify the high and low of the wick.
Then measure the 50% point.
For an upper wick:
Wick Low → Wick High → 50% = CE
For a lower wick:
Wick High → Wick Low → 50% = CE
This type of measurement becomes particularly important when studying Implied Fair Value Gaps.
An Implied FVG can be identified by measuring the Consequent Encroachment of specific overlapping wicks surrounding a displacement candle. The area between the relevant wick CE levels forms the implied inefficiency.
Therefore, CE is not limited only to visible Fair Value Gaps.
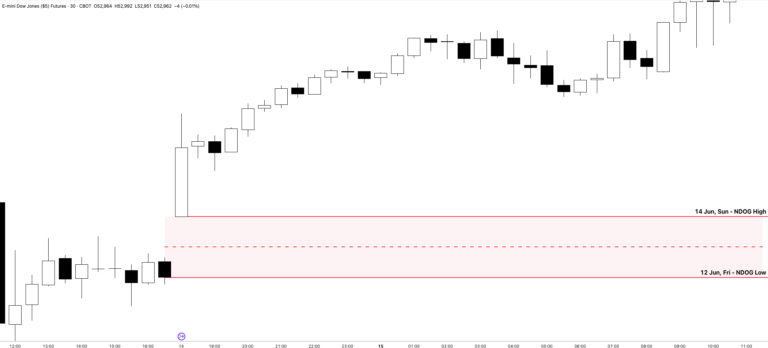
Consequent Encroachment of NDOG and NWOG
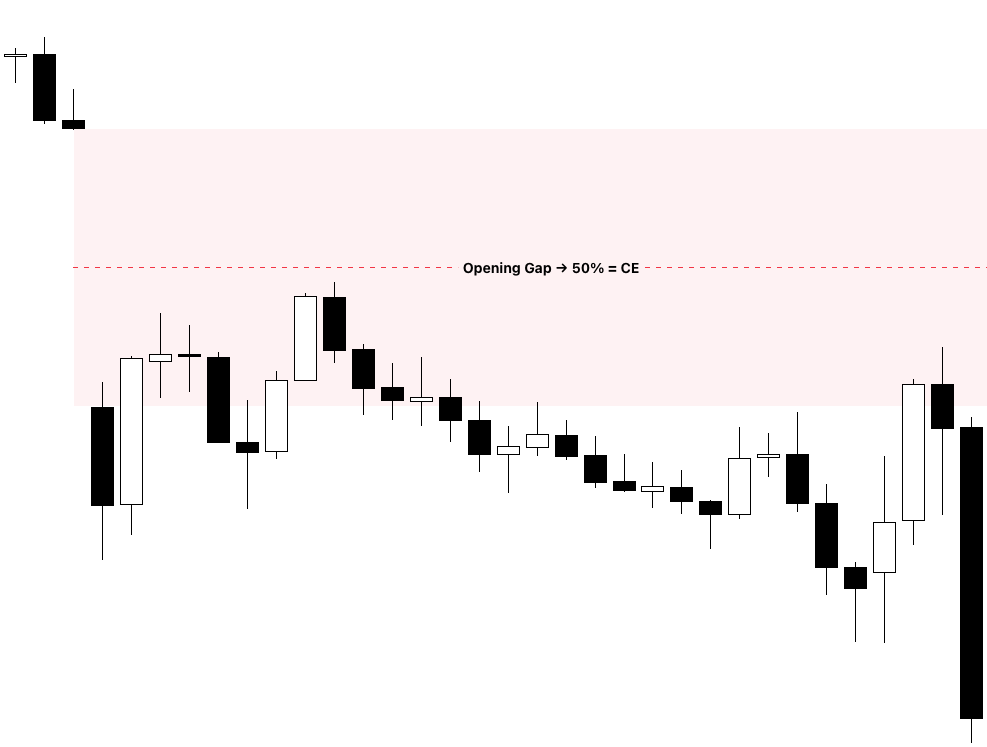
The 50% midpoint is also important when studying ICT opening gaps.
These include:
New Day Opening Gap – NDOG
New Week Opening Gap – NWOG
For an opening gap:
Previous Close → New Open → Measure the Gap → Mark 50%
The midpoint becomes the Consequent Encroachment of the opening gap.
For example:
Previous Close = 21,000
New Open = 21,020
Gap Size = 20 points
CE = 21,010
ICT traders can keep the opening gap and its midpoint marked as a price reference.
For NDOG specifically, ICT-oriented material defines the Consequent Encroachment as the 50% midpoint between the closing and opening prices that form the gap.
The basic idea is:
Opening Gap Created → Price Moves Away → Gap Remains as Reference → Price Returns → CE Becomes Sensitive
Depending on the market narrative, price may reject from the CE or continue through the entire gap.
How to Use ICT Consequent Encroachment in Trading
The biggest mistake is simply marking every 50% level and expecting price to reverse.
CE must be used with context.
A better process is:
Step 1: Determine Higher Timeframe Bias
First decide where price is likely drawing.
Ask:
Is price drawing toward Buy-Side Liquidity?
Is price drawing toward Sell-Side Liquidity?
Is there a Daily or 4H Fair Value Gap?
Is price trading in Premium or Discount?
Has external liquidity already been taken?
The Consequent Encroachment should preferably support the expected price delivery.
Step 2: Identify a Valid PD Array
Look for a meaningful:
Fair Value Gap
Order Block
Breaker Block
Opening Gap
Implied Fair Value Gap
Other defined ICT PD Array
Do not measure a random price range.
The CE gets its importance from the PD Array being measured.
Step 3: Mark the 50% Level
Use the Fibonacci Retracement tool.
You only need:
0
0.5
1
Measure the complete PD Array.
The 0.5 Fibonacci level is the Consequent Encroachment or Mean Threshold. The same basic 50% measurement method is commonly described for identifying CE.
Step 4: Wait for Price to Retrace
Do not chase displacement.
Allow price to return toward the PD Array.
Bullish Setup:
Price Expands Higher → Bullish FVG Forms → Price Retraces Lower
Bearish Setup:
Price Expands Lower → Bearish FVG Forms → Price Retraces Higher
Now monitor price as it approaches the CE.
Step 5: Study Price Reaction at CE
Price touching CE does not automatically create a trade.
Look for evidence such as:
Displacement
Market Structure Shift
Change in the State of Delivery
SMT Divergence
Lower Timeframe Fair Value Gap
Failure to continue through the PD Array
Liquidity sweep followed by rejection
One commonly taught CE trade flow is to align the higher-timeframe narrative first, then use a lower-timeframe structure shift and displacement before refining execution around a newly created imbalance and its midpoint.
Step 6: Enter With Your Trading Model
Suppose your model is bullish.
Sell-Side Liquidity Taken → Bullish MSS → Bullish Displacement → FVG Created → Price Retraces to FVG CE → Entry
For a bearish model:
Buy-Side Liquidity Taken → Bearish MSS → Bearish Displacement → FVG Created → Price Retraces to FVG CE → Entry
The CE is an entry refinement tool.
It should not replace the trading model.
Step 7: Target the Draw on Liquidity
Your target should come from the market narrative.
Possible objectives include:
Previous High
Previous Low
Equal Highs
Equal Lows
Session High
Session Low
Old Daily High
Old Daily Low
Opposing PD Array
External Liquidity
The broader ICT trade flow uses the expected draw on liquidity as the objective rather than treating CE itself as the profit target.
Bullish Consequent Encroachment Example
Suppose NQ is bullish on the Daily and 1H timeframe.
The expected draw is an old Daily High.
During the New York session:
Price Trades Lower → Sell-Side Liquidity Swept → Bullish MSS → Bullish Displacement
The displacement creates a bullish FVG between:
21,100 and 21,108
CE:
21,104
Price continues higher initially.
Instead of buying the expansion, the trader waits.
Price Retraces → Enters Bullish FVG → Trades to 21,104 → Rejects CE
A lower timeframe bullish displacement forms.
The trader enters long.
Stop Loss → Below the protected low or invalidation point
Target → Old Daily High
The CE helps the trader refine the entry inside the bullish PD Array.
Bearish Consequent Encroachment Example
Suppose ES has a bearish Daily bias.
The expected draw is sell-side liquidity below the previous day’s low.
During the New York session:
Buy-Side Liquidity Swept → Bearish MSS → Bearish Displacement
A bearish FVG forms between:
6,200 and 6,206
The CE is:
6,203
Price initially moves lower.
Later:
Price Retraces Higher → Enters Bearish FVG → Tests 6,203 → Rejects CE
Bearish displacement develops from the level.
The trader may use this reaction as part of a bearish entry model.
Target:
Previous Day Low → Sell-Side Liquidity
Again, CE is working together with:
Bias + Liquidity + Market Structure + PD Array
What Happens When Price Trades Through Consequent Encroachment?
A common misunderstanding is:
Price crossed CE = PD Array immediately invalid
This is not always the correct interpretation.
Price can trade slightly beyond the midpoint and still react from the deeper portion of the structure.
The trader should study:
Did price close through the PD Array?
Was there strong displacement through the level?
Did price completely rebalance the FVG?
Has the directional narrative changed?
Was an opposing PD Array respected?
Has the protected high or low been violated?
For example:
Bullish FVG → CE Trades Through → Price Reaches Deeper Discount Portion of FVG → Bullish Displacement
The bullish FVG may still remain relevant.
However:
Bullish FVG → Aggressive Bearish Displacement Through FVG → Structural Failure → Bearish Continuation
The original bullish PD Array may no longer offer the same trading expectation.
Context is more important than the CE line itself.
Consequent Encroachment Is Not a Standalone Trading Strategy
Consequent Encroachment should never be traded like traditional horizontal support and resistance.
Wrong Approach:
Price Reached CE → Buy
Price Reached CE → Sell
Better Approach:
Determine Bias → Identify Draw on Liquidity → Wait for Liquidity Event → Observe Displacement → Identify PD Array → Mark CE → Wait for Retracement → Confirm Reaction → Execute
This is the main difference between simply drawing a 50% Fibonacci level and actually using CE inside an ICT trading model.
Common Mistakes When Using Consequent Encroachment
1. Marking CE on Every Fair Value Gap
Not every FVG is equally important.
Prioritize FVGs created by meaningful displacement and those aligned with the market narrative.
2. Entering Blindly at 50%
A 50% level alone does not predict a reversal.
Look at liquidity, time and price delivery.
3. Ignoring Higher Timeframe Bias
A bullish CE entry against a strong bearish higher-timeframe draw can fail easily.
Always understand where price is likely seeking liquidity.
4. Confusing CE With OTE
Consequent Encroachment is the 50% midpoint of a specific PD Array or structure.
ICT Optimal Trade Entry uses a deeper Fibonacci retracement framework within a measured dealing range or price swing.
They are not the same concept.
5. Measuring the Wrong Range
The Fibonacci tool must measure the exact structure being studied.
For an FVG:
Measure FVG Boundary to FVG Boundary
For an Order Block:
Measure the defined Order Block range
For a Wick:
Measure the relevant Wick
For an Opening Gap:
Measure Previous Close to New Open
Wrong measurement creates a wrong CE.
6. Expecting Exact Pip or Tick Precision
Price may trade directly to the CE.
Price may stop slightly before it.
Price may trade through it before reacting.
Treat CE as part of price delivery analysis, not as a magical line where every market must reverse.
Final Thoughts
ICT Consequent Encroachment or Mean Threshold is the 50% midpoint of a defined ICT price structure or PD Array. It is commonly used to study the internal midpoint of Fair Value Gaps, Order Blocks, opening gaps, wicks and other price-delivery structures.
The concept is simple:
Identify PD Array → Measure High and Low → Mark 50% → Observe Price Reaction
But the proper application requires context.
A trader should first understand:
Higher Timeframe Bias
Draw on Liquidity
Liquidity Sweep
Displacement
Market Structure Shift
Relevant PD Array
After these elements align, the Consequent Encroachment can be used to refine the expected retracement and entry area.
The most important rule is:
Do not trade the 50% level simply because price touched it. Trade the market narrative, and use Consequent Encroachment as a precise reference inside that narrative.