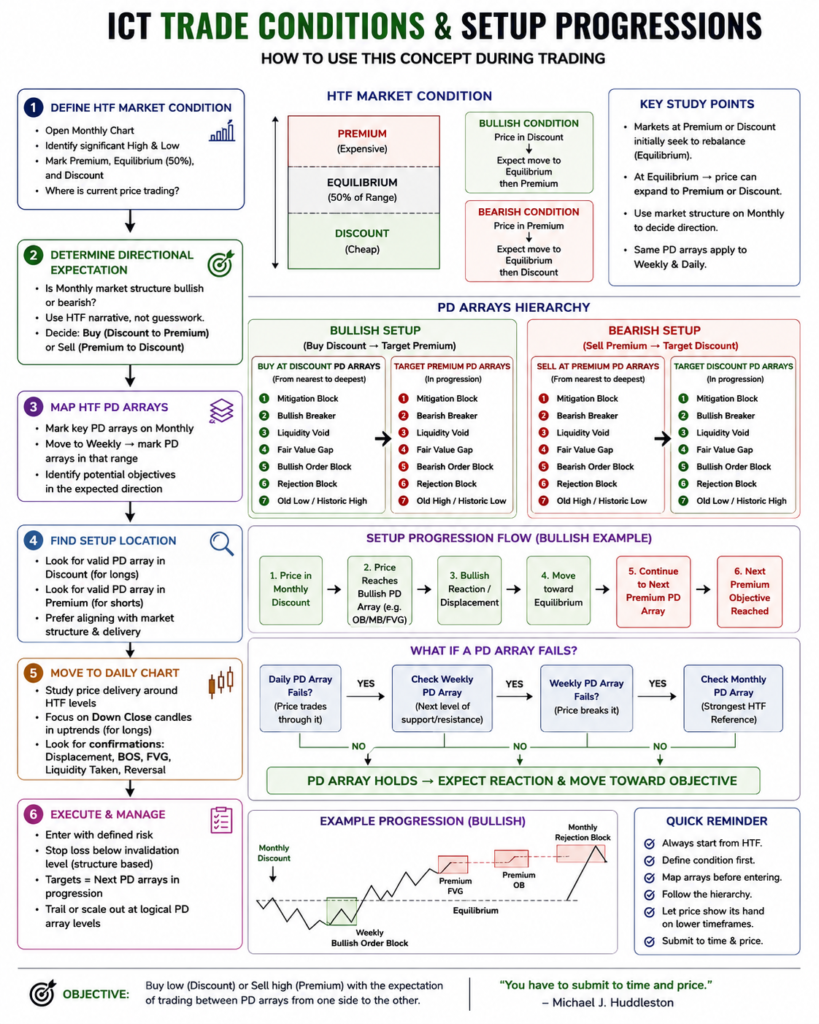
Trade Conditions & Setup Progressions explain how an ICT trader can build a trade idea from higher time frame market conditions and then follow price as it progresses from one PD Array to another.
This concept is taught by Michael J. Huddleston, founder of ICT (Inner Circle Trader), in the ICT Mentorship Core Content – Month 5.
The main idea is not simply identifying an Order Block or Fair Value Gap.
The trader must first understand:
Where is price in the higher time frame range?
Is price at Premium, Discount, or Equilibrium?
Which PD Array is supporting the setup?
What is the next logical PD Array price may trade toward?
In simple terms:
Define the condition → Find the setup location → Map the PD Array progression → Follow price toward the objective
This is the foundation of Trade Conditions & Setup Progressions in ICT trading.
What Are Trade Conditions & Setup Progressions?
Trade Conditions describe the higher time frame environment surrounding a possible trade.
For example:
Price is in deep Monthly Discount.
A Weekly Bullish Order Block is supporting price.
The Daily chart begins showing bullish price delivery.
There are unfilled Premium PD Arrays above the market.
These conditions can support a bullish trade narrative.
Setup Progression describes how the trade idea develops from the initial entry area toward higher price objectives.
For a bullish setup:
Discount PD Array
↓
Bullish reaction
↓
Price moves toward Equilibrium
↓
Premium PD Arrays become objectives
↓
Price progresses from one array to another
The opposite logic applies to bearish conditions.
Premium PD Array
↓
Bearish reaction
↓
Price moves toward Equilibrium
↓
Discount PD Arrays become objectives
Trade Conditions tell the trader why a setup may exist.
Setup Progressions help determine where price may go after the setup forms.
Price at Premium or Discount Initially Seeks Rebalancing
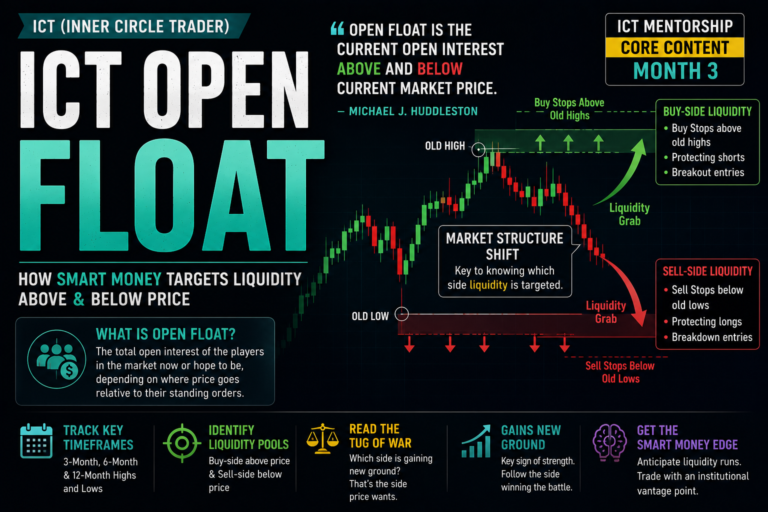
One important principle in this ICT concept is that a market trading at a significant Premium or Discount may initially seek Equilibrium.
Suppose price reaches a deep Discount.
The trader does not always need to predict an immediate move into the deepest Premium level.
The first reasonable objective may simply be the 50% level of the recent trading range.
The progression may be:
Deep Discount
↓
Bullish reaction
↓
Equilibrium
Michael J. Huddleston explains:
“When markets are at a premium or at a discount, they’re always going to initially look to rebalance.”
This means Equilibrium can become an important first objective.
A trader buying at deep Discount may find many opportunities simply targeting the rebalancing of the recent range.
The same applies to Premium.
Deep Premium
↓
Bearish reaction
↓
Equilibrium
This is one of the simplest ways to understand Setup Progression.
Conditions at Equilibrium Are Different
When price is at Equilibrium, the trader should not automatically buy or sell.
Price is around the middle of the range.
From this area, price may expand toward either Premium or Discount.
The trader must consult higher time frame market structure.
Ask:
Is Monthly market structure bullish?
Is Monthly market structure bearish?
Is price delivering toward an unmet Premium PD Array?
Is price seeking a Discount PD Array?
The process becomes:
Price at Equilibrium
↓
Study Monthly market structure
↓
Determine directional expectation
↓
Map the PD Arrays in that direction
You are not randomly buying because price is at 50%.
You are not randomly selling because price is at 50%.
The higher time frame narrative determines which side of the range becomes the likely objective.
Bullish Trade Conditions: Buy Discount and Target Premium
For a bullish position trade, ICT looks for a Bullish PD Array in Discount.
Potential Discount PD Arrays include:
- Mitigation Block
- Bullish Breaker
- Liquidity Void
- Fair Value Gap
- Bullish Order Block
- Rejection Block
- Old Low or historical reference point
The trader identifies a valid Discount PD Array and then maps Premium PD Arrays above price.
The general concept is:
Buy at a Bullish Discount PD Array
↓
Target a Premium PD Array
Potential Premium objectives include:
- Mitigation Block
- Bearish Breaker
- Liquidity Void
- Fair Value Gap
- Bearish Order Block
- Rejection Block
- Old High or historical price reference
The first Premium array may be the first objective.
If the market displays enough strength to trade through that level, the trader may then look toward the next Premium PD Array.
This creates the Setup Progression.
Bearish Trade Conditions: Sell Premium and Target Discount
The bearish framework is simply reversed.
The trader looks for a Bearish PD Array in Premium.
The setup becomes:
Bearish Premium PD Array
↓
Short position
↓
Price moves lower
↓
Discount PD Array becomes objective
The trader may cover the short position at:
- Bullish Mitigation Block
- Bullish Breaker
- Liquidity Void
- Fair Value Gap
- Bullish Order Block
- Rejection Block
- Old Low
The underlying logic is:
Sell at Premium
Buy back at Discount
Again, the trade should be framed using the higher time frame narrative.
Start With the Monthly Trading Range
In Trade Conditions & Setup Progressions, the Monthly chart provides the broad market framework.
The trader begins by identifying a relevant Monthly trading range.
For example:
Significant High
↓
Significant Low
The high represents the Premium side of the range.
The low represents the Discount side.
The midpoint becomes Equilibrium.
The trader then asks:
Where is current price relative to this range?
Suppose price moves into a deep Monthly Discount.
This immediately gives important context.
The trader should begin studying Bullish PD Arrays.
If the market shows willingness to move higher, Premium PD Arrays above price can become future objectives.
The Monthly chart creates the broad narrative.
Move From Monthly to Weekly PD Arrays
After defining the Monthly condition, move to the Weekly chart.
The Weekly chart can show Bullish or Bearish PD Arrays that are difficult to see clearly on the Monthly chart.
For a bullish setup, the trader may identify:
Monthly Discount
↓
Weekly Bullish Order Block
Price trading into a Weekly Bullish Order Block while the market is already in Monthly Discount creates more context for a potential bullish setup.
A Weekly chart may also reveal several possible upside objectives.
For example:
Weekly Rejection Block
↓
Weekly Fair Value Gap
↓
Weekly Bearish Order Block
These arrays form a possible progression for higher prices.
The trader can map them before the move develops.
The USD/JPY Example: Monthly Discount to Premium
ICT uses USD/JPY to demonstrate how Trade Conditions & Setup Progressions can form on higher time frame charts.
An important point is understanding the relationship between the Japanese Yen cash price and USD/JPY.
If Japanese Yen cash prices are expected to decline, USD/JPY may rise because the Japanese Yen is the second currency in the pair.
The relationship is:
JPY weakness
↓
USD/JPY strength
In the example, USD/JPY moved into a significant higher time frame Discount.
Monthly and Weekly PD Arrays provided support for the bullish narrative.
Price then delivered higher from the Discount area toward Premium objectives.
The important lesson is not memorizing a historical USD/JPY move.
The real lesson is learning how to map:
Trade condition
↓
Supporting HTF PD Array
↓
Expected price delivery
↓
Next Premium objective
Rejection Blocks Can Confirm Deep Discount Conditions
A Rejection Block may become important when price trades below candle bodies and rejects the lower price area.
For example, suppose several Monthly candles contain lower wicks.
Price trades below the bodies of those candles.
The lower price is rejected.
Price then expands higher.
This area may be defined as a Bullish Rejection Block.
The setup progression becomes:
Deep Monthly Discount
↓
Price trades through candle body area
↓
Lower price rejected
↓
Bullish delivery begins
A Rejection Block can therefore provide one piece of evidence supporting a higher time frame trade condition.
Weekly Bullish Order Blocks Can Support Position Trades
In a bullish higher time frame environment, focus on Down Close candles.
Michael J. Huddleston explains:
“Every time you look in an uptrend, you want to focus on the down candles.”
The reason is that Down Close candles can reveal areas where institutional buying occurred.
A Bullish Order Block is generally identified around the Down Close candle before significant bullish price delivery.
Suppose price previously rallied from a Weekly Bullish Order Block.
Later, price retraces into that same Weekly Order Block.
The market may be repricing into an institutional buying reference point.
The progression becomes:
Price returns to Weekly Bullish Order Block
↓
Institutional buying area revisited
↓
Bullish reaction
↓
Price expands toward Premium PD Arrays
The Weekly PD Array helps support the long-term trade narrative.
Map Premium Objectives Before Entering the Trade
One of the most practical parts of this concept is mapping the upside objectives before taking a bullish position.
Suppose price is trading in Discount.
Above price you identify:
Rejection Block
↓
Fair Value Gap
↓
Bearish Order Block
These can become progressive objectives.
The trade plan may look like:
Buy at Discount
↓
First objective: Rejection Block
↓
Second objective: Fair Value Gap
↓
Final objective: Bearish Order Block in deep Premium
The market may not reach every objective.
However, mapping the arrays gives the trader a structured understanding of the potential price path.
Instead of randomly choosing a Take Profit level, the trader uses HTF PD Arrays.
Every Trading Range Can Have Its Own Premium and Discount
Price does not need to move from the deepest long-term Discount directly to the deepest Monthly Premium before providing opportunities.
Smaller trading ranges can form inside the larger range.
For example:
Short-term High
↓
Short-term Low
This creates a smaller dealing range.
The upper half becomes local Premium.
The lower half becomes local Discount.
A trader may therefore trade several Setup Progressions within a larger higher time frame move.
The market may form:
Discount Range 1
↓
Premium Range 1
↓
New Discount
↓
Premium Range 2
↓
Deep HTF Premium objective
This allows traders who cannot hold an entire position trade to participate in smaller sections of the larger price delivery.
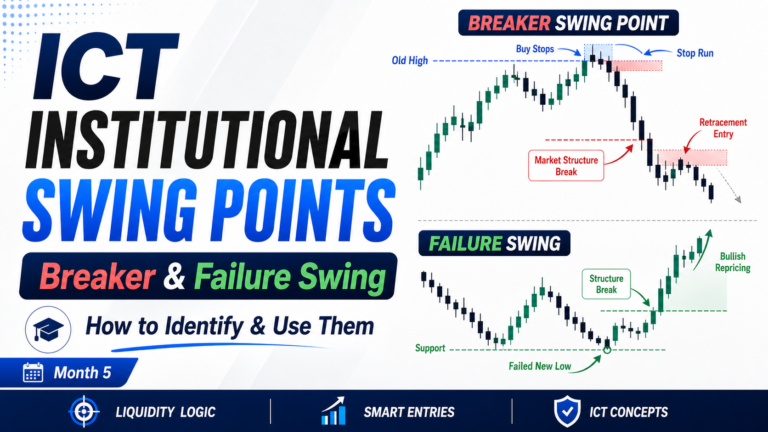
What Happens When a Daily PD Array Fails?
One of the most important parts of Trade Conditions & Setup Progressions is understanding PD Array failure across time frames.
Suppose the market is bullish.
You identify a Daily Bullish Order Block.
Price trades into the Daily Order Block.
Instead of rallying, price trades through it.
Many traders immediately assume:
The bullish idea is wrong.
ICT teaches a different approach.
The next question should be:
Is there a Weekly Bullish PD Array below price?
The progression becomes:
Daily Bullish PD Array fails
↓
Check Weekly chart
↓
Find the next Weekly Bullish PD Array
If the Weekly PD Array also fails:
Check the Monthly chart
The logic is:
Daily PD Array lost
↓
Weekly PD Array becomes relevant
↓
Weekly PD Array lost
↓
Monthly PD Array becomes relevant
Michael J. Huddleston explains:
“If you lose a level on a daily, don’t be concerned. Just go out to a weekly chart and you’ll see what they’re reaching for.”
This is a critical part of understanding Setup Progression.
Price may simply be repricing into a deeper and more significant higher time frame array.
Why Daily Support May Fail During a Monthly Retracement
A Daily Bullish Order Block does not always have enough influence to stop a major Monthly retracement.
The Monthly chart represents a much larger market structure.
If the market is seeking a significant Weekly or Monthly PD Array, a Daily level may be traded through.
The sequence may look like:
Daily Bullish Order Block
↓
Price trades through it
↓
Weekly Bullish Order Block
↓
Institutional buying enters
↓
Large bullish expansion
This is why traders should keep Monthly and Weekly PD Arrays mapped even when executing trades from the Daily chart.
The higher time frame provides the true context.
Large Price Displacements Often Point to Weekly Objectives
When a trader sees an unusually strong Daily price move, the Daily chart may not clearly explain why the movement occurred.
ICT suggests moving to the Weekly chart.
A large surge higher or lower may be connected to a Weekly PD Array.
For example:
Large bearish displacement
↓
Daily chart appears confusing
↓
Open Weekly chart
↓
Price is reaching a Weekly Bullish PD Array
The large movement may simply represent price repricing toward the larger institutional reference point.
Weekly PD Arrays can attract significant institutional participation because they represent longer-term price levels.
According to ICT, when price reaches these important Weekly arrays, larger funds and institutions may focus on the same reference points.
This can lead to significant price expansion.
Use Monthly and Weekly Levels on the Daily Chart
The purpose of higher time frame analysis is not simply drawing Monthly and Weekly horizontal lines.
The objective is to transpose the HTF PD Array context onto the Daily chart.
The process becomes:
Map Monthly PD Arrays
↓
Map Weekly PD Arrays
↓
Move to Daily chart
↓
Study Daily price delivery around HTF levels
Suppose a Weekly Bullish Order Block is marked.
As price approaches the Weekly level, watch the Daily chart.
Focus on:
- Down Close candles
- Daily Bullish Order Blocks
- Price rejection
- Displacement
- Market structure
- New institutional buying footprints
The Weekly PD Array tells you where to focus.
The Daily chart helps show how the setup is progressing.
How to Apply Trade Conditions & Setup Progressions
A simple ICT framework is:
Step 1: Open the Monthly chart
Identify the relevant trading range.
Mark Premium, Equilibrium, and Discount.
↓
Step 2: Define the trade condition
Is price in deep Premium?
Is price in deep Discount?
Is price at Equilibrium?
↓
Step 3: Determine directional expectation
Use Monthly market structure and higher time frame narrative.
↓
Step 4: Map Monthly PD Arrays
Identify potential support, resistance, and future objectives.
↓
Step 5: Move to the Weekly chart
Look for more refined Bullish or Bearish PD Arrays.
↓
Step 6: Define the setup location
For bullish setups, look for Discount PD Arrays.
For bearish setups, look for Premium PD Arrays.
↓
Step 7: Map the Setup Progression
Identify the next PD Array in the expected direction.
↓
Step 8: Move to the Daily chart
Study price delivery and institutional footprints.
↓
Step 9: If a Daily Array fails, check Weekly
Do not immediately abandon the HTF narrative.
↓
Step 10: If Weekly fails, check Monthly
Determine whether price is repricing into a deeper long-term PD Array.
↓
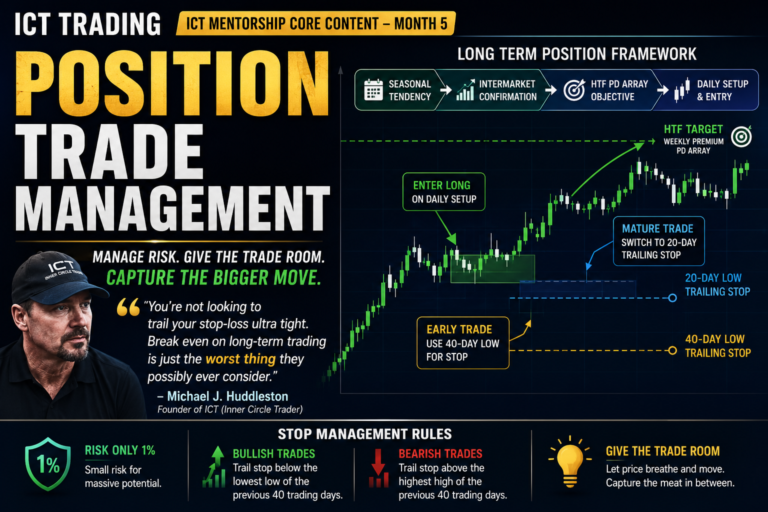
Step 11: Manage the position toward logical PD Array objectives
Continue evaluating price as it progresses through the higher time frame range.
A Simple Bullish Trade Progression Example
Suppose EUR/USD is in Monthly Discount.
You identify a Weekly Bullish Order Block.
The Monthly chart has an unmet Premium Fair Value Gap above price.
The process becomes:
Monthly Discount
↓
Weekly Bullish Order Block
↓
Daily bullish reaction
↓
Price moves toward Equilibrium
↓
Equilibrium rebalanced
↓
Price continues higher
↓
Premium Fair Value Gap becomes objective
If a Daily Bullish Order Block fails during the move, check whether price is simply retracing into the Weekly Bullish Order Block.
The higher time frame condition remains the primary framework.
Final Thoughts
Trade Conditions & Setup Progressions help ICT traders understand how a higher time frame trade develops from its initial condition toward a future price objective.
The process begins with market location.
Premium, Discount, or Equilibrium
The trader then defines the directional narrative using Monthly market structure.
For a bullish setup:
Buy at a Bullish Discount PD Array → Target Premium PD Arrays
For a bearish setup:
Sell at a Bearish Premium PD Array → Target Discount PD Arrays
The most important part is understanding the progression between time frames.
Daily PD Array fails → Check Weekly PD Array
Weekly PD Array fails → Check Monthly PD Array
Price may be repricing toward a more significant institutional reference point rather than completely invalidating the trade narrative.
By mapping Monthly and Weekly PD Arrays before studying the Daily chart, the trader gains context for entries, retracements, and future price objectives.
That is the core purpose of Trade Conditions & Setup Progressions in ICT trading.