Position Trade Management is the process of managing a long-term trade after the higher time frame market narrative, entry, risk, and price objective have been defined.
This concept is taught by Michael J. Huddleston, founder of ICT (Inner Circle Trader), in the ICT Mentorship Core Content – Month 5.
ICT Position Trade Management is not based on moving the stop to break even as quickly as possible.
The trader first identifies a potential quarterly market move, enters with controlled risk, and then gives price enough room to reach the expected Monthly or Weekly PD Array.
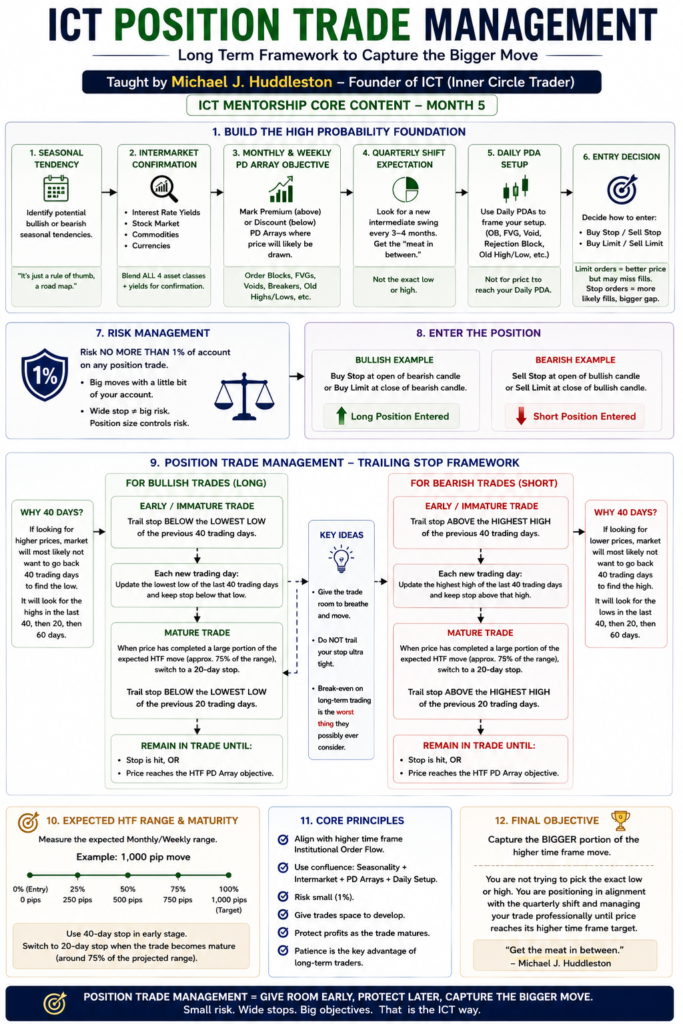
The basic framework is:
Seasonal Tendency
↓
Intermarket Confirmation
↓
Monthly and Weekly PD Array Objective
↓
Daily Setup
↓
Position Entry
↓
Maximum 1% Risk
↓
40 Trading Day Stop Management
↓
20 Trading Day Stop Management as the Move Matures
The primary objective is to participate in the large portion of a higher time frame move without being stopped out prematurely.
What Is Position Trade Management?
Position Trade Management refers to how an ICT trader controls an open long-term position while price progresses toward a higher time frame objective.
The trader must decide:
- Where the initial stop loss should be placed.
- How much account equity should be risked.
- When the stop loss should be trailed.
- How much room price needs for normal retracements.
- When to protect profits more aggressively.
Long-term trading is different from intraday trading.
A position trade may experience several Daily or Weekly retracements before the final objective is reached.
Because of this, ICT does not recommend managing a position trade with an extremely tight stop.
Michael J. Huddleston explains:
“You’re not looking to trail your stop-loss ultra tight.”
The market needs room to move.
Start With a Potential Seasonal Tendency
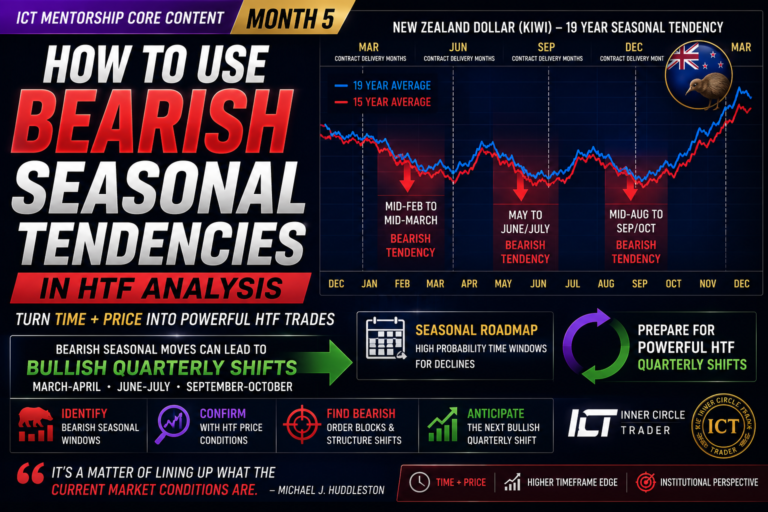
For a bullish Position Trade Management scenario, ICT first considers potential bullish seasonal tendencies.
For a bearish scenario, the trader studies bearish seasonal tendencies.
However, seasonality is not used as a guaranteed trade signal.
Michael J. Huddleston explains:
“It’s just a rule of thumb, a road map if you will, about what may unfold in price action.”
The trader is simply identifying a period when a larger directional move may be more likely.
For example:
Potential Bullish Seasonal Tendency
↓
Look for evidence supporting higher prices
or:
Potential Bearish Seasonal Tendency
↓
Look for evidence supporting lower prices
Seasonality starts the analysis.
Technical and intermarket confirmation must support the idea.
Confirm the Position Trade With Intermarket Analysis
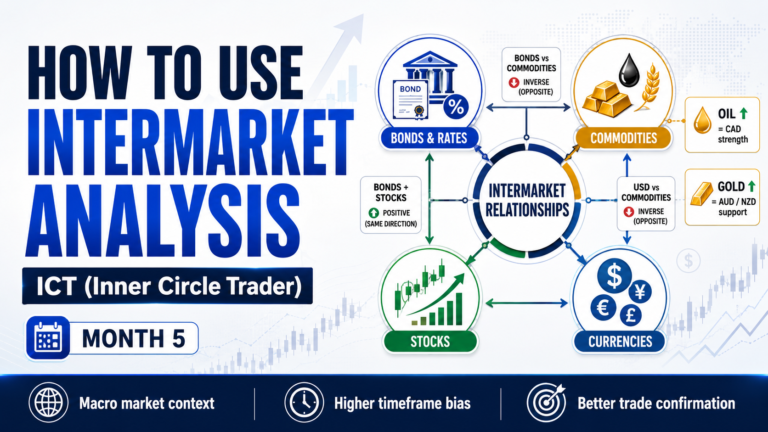
After identifying a potential seasonal move, ICT studies the related markets.
The trader may compare:
- Currency markets
- Interest rates
- Stock market
- Commodity markets
Interest rate yields are particularly important in the higher time frame framework.
The trader asks:
Are yields increasing or decreasing?
Are related interest rate markets confirming the expected currency direction?
Is there divergence in yields?
Are the major asset classes supporting the same general outlook?
ICT explains that all four major asset classes may not always provide a perfectly clear signal.
However, if several related markets confirm the same idea, the position trade narrative becomes stronger.
The process is:
Seasonal expectation
↓
Interest rate analysis
↓
Intermarket confirmation
↓
Higher probability HTF narrative
As Michael J. Huddleston explains:
“Technicals in alignment with the seasonal tendency are a very powerful couple.”
Seasonality alone should not drive the trade.
Map Monthly and Weekly PD Arrays
Once the directional narrative has support, the trader moves to the Monthly and Weekly charts.
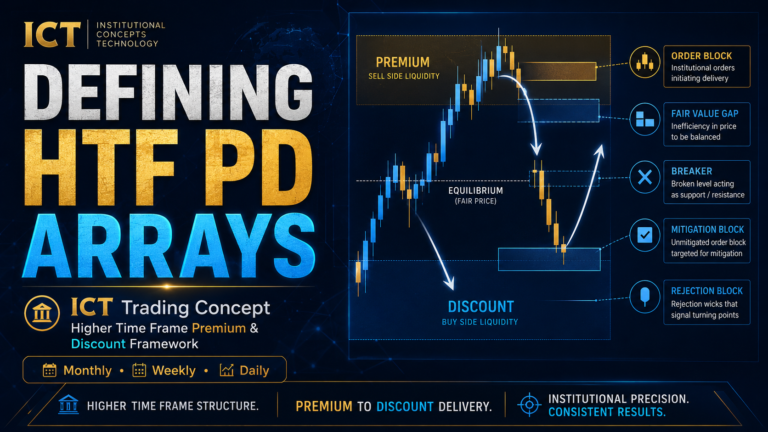
The objective is to identify the Premium Discount Arrays or PD Arrays that may draw price.
For a bullish scenario, the trader may identify Premium PD Arrays above price.
These can include:
- Mitigation Block
- Bearish Breaker
- Liquidity Void
- Fair Value Gap
- Bearish Order Block
- Rejection Block
- Old High
For a bearish scenario, the trader maps Discount PD Arrays below price.
These may include:
- Mitigation Block
- Bullish Breaker
- Liquidity Void
- Fair Value Gap
- Bullish Order Block
- Rejection Block
- Old Low
The Monthly and Weekly PD Arrays help define the expected trade range.
For example:
Current Discount PD Array
↓
Expected Weekly Premium PD Array
The distance between these two areas gives the trader a projected higher time frame price move.
This range becomes important when managing the stop loss later.
Focus on the Quarterly Shift
Position trades are designed around larger intermediate-term price swings.
ICT discusses the idea of a Quarterly Shift, where a new significant market swing may develop over approximately three to four months.
The objective is not to buy the exact bottom.
The objective is not to sell the exact top.
Michael J. Huddleston explains:
“We’re not trying to pick the absolute low and we’re not trying to pick the absolute high.”
Instead:
Identify the developing quarterly move
↓
Enter in alignment with Institutional Order Flow
↓
Capture the largest portion of the move
ICT describes this as getting the “meat in between.”
This is one reason Position Trade Management requires patience.
Use Daily PD Arrays to Frame the Setup
The Monthly and Weekly charts provide direction and the long-term objective.
The Daily chart is used to frame the actual position trade setup.
For bullish trades, look for Daily Bullish PD Arrays such as:
- Bullish Order Block
- Bullish Breaker
- Fair Value Gap
- Liquidity Void
- Rejection Block
- Old Low
For bearish trades, look for:
- Bearish Order Block
- Bearish Breaker
- Fair Value Gap
- Liquidity Void
- Rejection Block
- Old High
The process becomes:
Monthly and Weekly narrative
↓
Higher time frame PD Array objective
↓
Daily PD Array setup
↓
Position trade entry
The Daily chart helps the trader enter the larger Monthly or Weekly move.
Choose Between Stop Entry and Limit Entry
Once a valid Daily setup forms, the trader must decide how to enter.
ICT teaches two primary methods:
Stop Entry
or:
Limit Entry
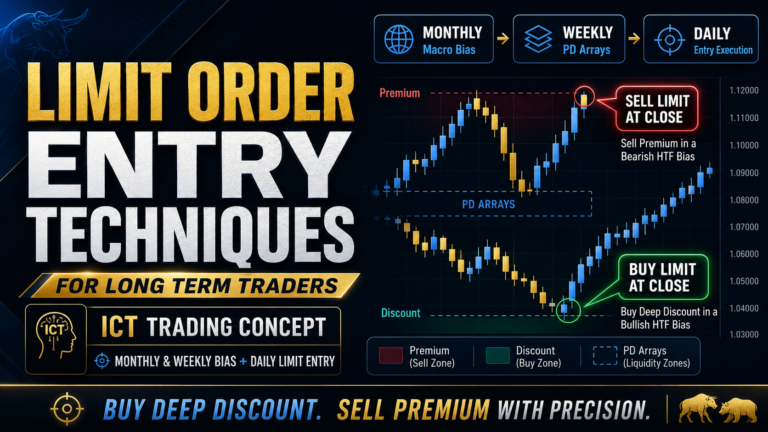
For bullish trades:
- Buy Stop at the opening of a bearish Daily candle.
- Buy Limit at the closing price of a bearish Daily candle.
For bearish trades:
- Sell Stop at the opening of a bullish Daily candle.
- Sell Limit at the closing price of a bullish Daily candle.
Limit Orders can provide a deeper entry price.
However, the trader may miss the trade if price never retraces into the requested level.
Stop Orders generally have a greater probability of being triggered because price is entered using directional movement.
The disadvantage is that the distance between entry and stop loss may be larger.
The choice depends on the trader’s execution preference.
Risk No More Than 1% Per Position Trade
ICT’s Position Trade Management model uses conservative risk.
Michael J. Huddleston states that the trader should be risking:
“No more than one percent.”
This is important because higher time frame stop losses can be wide.
A position trade may require:
100 pips
200 pips
250 pips
or more
between the entry and the logical protective stop.
This does not mean the trader should increase monetary risk.
Instead:
Wide Stop Loss
↓
Reduce Position Size
↓
Maintain Maximum 1% Risk
The trader is looking for a big market move with a small portion of account equity exposed.
The number of pips at risk does not define account risk.
Position size determines the actual monetary exposure.
Bullish Position Trade Stop Management
After entering a long position, ICT uses an IPDA-style trading-day lookback for the protective stop.
For bullish trades:
Place and trail the stop below the lowest low of the previous 40 trading days.
The process is:
Long position entered
↓
Look back 40 trading days
↓
Find the lowest low
↓
Protective stop remains below that low
Every new trading day, the trader updates the 40-day lookback.
The objective is to keep the stop significantly behind current market price.
Why?
Because a bullish higher time frame move is expected to seek liquidity above previous highs.
The market is less likely to return all the way back to the lowest low of the previous 40 trading days while the quarterly bullish move remains valid.
This gives the position room to develop.
Bearish Position Trade Stop Management
The bearish model is reversed.
After entering a short position:
Trail the stop above the highest high of the previous 40 trading days.
The process becomes:
Short position entered
↓
Look back 40 trading days
↓
Find the highest high
↓
Protective stop remains above that high
The trader repeats the process every Daily trading session.
This allows bearish price delivery to experience temporary rallies without automatically removing the trader from the position.
The objective is to avoid a premature stop-out before the larger Monthly or Weekly move takes place.
Why ICT Uses the 40 Trading Day Lookback
The 40 trading day stop framework connects directly with ICT IPDA Data Ranges.
Suppose the market is bullish.
The expectation is that price may seek:
20-day highs
↓
40-day highs
↓
60-day highs
During the bullish move, the trader keeps the stop below the lowest low of the previous 40 trading days.
The stop is located away from the liquidity price is expected to seek.
For bearish trades, the opposite applies.
Price may seek:
20-day lows
↓
40-day lows
↓
60-day lows
The stop remains above the highest high of the previous 40 trading days.
The trader is aligning the protective stop with the larger price delivery narrative.
Do Not Rush to Break Even
A major mistake in Position Trade Management is immediately moving the stop loss to break even.
This may work in some lower time frame trading models.
ICT strongly discourages this mindset for long-term trades.
Michael J. Huddleston explains:
“Break even on long-term trading is just the worst thing they possibly ever consider.”
The reason is simple.
Position trades naturally retrace.
Price may:
Expand in your favor
↓
Retrace deeply
↓
Consolidate
↓
Resume the higher time frame move
A break-even stop can remove the trader during the normal retracement.
The market may then continue toward the original Monthly or Weekly target without the trader.
The goal is not to remove all risk immediately.
The goal is to manage risk according to the higher time frame structure.
Give the Market Room to Breathe
Long-term price delivery is rarely a straight line.
A position trade can experience:
- Daily retracements
- Weekly pullbacks
- Consolidation
- Sharp temporary volatility
- Open profit drawdown
ICT’s 40-day stop framework gives price room to “breathe and move around.”
This is psychologically difficult for some traders.
A profitable position may temporarily give back a portion of open profit.
However, open profit is not realized profit until the position is closed.
The trader must determine whether the higher time frame objective remains valid.
If it does, a normal retracement does not automatically require an exit.
Measure the Expected HTF Range
Before managing the trailing stop, the trader must know the expected Monthly or Weekly move.
Suppose price is moving from a Discount PD Array to a Premium PD Array.
The projected range is:
Entry area = Discount
Final objective = Premium PD Array
Assume the projected move is:
1,000 pips
The trader can grade the move by percentage.
25% of range = 250 pips
50% of range = 500 pips
75% of range = 750 pips
100% = HTF objective
The maturity of the move determines when the trader should tighten the trailing stop.
Initial Stage: Use the 40-Day Stop
During the early stage of the position trade, the stop remains based on the previous 40 trading days.
For a bullish trade:
Stop below 40-day low
For a bearish trade:
Stop above 40-day high
The trader continues using the wider 40-day reference while the price move is still developing.
The reason is that the trade may require large retracements before continuing.
The trader should not manage an immature position like a mature trade that is already near its final objective.
When the Move Matures, Tighten the Stop
As price delivers a significant portion of the expected Monthly or Weekly range, the trader begins protecting profit more aggressively.
The core concept is:
Early trade = 40-day lookback
↓
Mature trade = 20-day lookback
In the examples explained by ICT, once a substantial portion of the projected move has developed, especially as the trade progresses toward approximately three-quarters of the expected range, the trader begins using the previous 20 trading days.
For bullish trades:
Trail below the lowest low of the previous 20 trading days
For bearish trades:
Trail above the highest high of the previous 20 trading days
The 20-day range brings the stop closer to price.
This allows the trader to protect a larger portion of the accumulated open profit.
Why Change From 40 Days to 20 Days?
Suppose a bearish position is expected to move 1,000 pips.
Price has already declined approximately 750 pips.
The trade has completed around three-quarters of the expected higher time frame move.
At this stage, the final target may still be reached.
However, the market may also reverse before completing the full projected move.
Continuing to use the 40-day high could allow a large portion of open profit to disappear.
The progression becomes:
Trade still developing
↓
Use 40-day stop
↓
Price completes major portion of HTF range
↓
Trade becomes mature
↓
Use 20-day stop
↓
Protect profits more aggressively
The stop management changes because the condition of the trade has changed.
Bullish Position Trade Management Framework
For a bullish position trade:
Identify bullish seasonal tendency
↓
Confirm with intermarket analysis and yields
↓
Map Monthly/Weekly Premium PD Array above
↓
Wait for quarterly bullish shift
↓
Use Daily Bullish PD Array for setup
↓
Choose Buy Stop or Buy Limit
↓
Risk maximum 1%
↓
Enter long
↓
Trail stop below lowest low of previous 40 trading days
↓
Allow price to seek HTF Premium objective
↓
As the projected move becomes mature, switch to 20-day low trailing stop
↓
Exit if trailing stop is reached or objective is completed
The primary purpose is to remain in the bullish position long enough to capture the larger expansion.
Bearish Position Trade Management Framework
For a bearish position trade:
Identify bearish seasonal tendency
↓
Confirm with intermarket analysis and yields
↓
Map Monthly/Weekly Discount PD Array below
↓
Wait for quarterly bearish shift
↓
Use Daily Bearish PD Array for setup
↓
Choose Sell Stop or Sell Limit
↓
Risk maximum 1%
↓
Enter short
↓
Trail stop above highest high of previous 40 trading days
↓
Allow price to seek HTF Discount objective
↓
As the projected move becomes mature, switch to 20-day high trailing stop
↓
Exit if trailing stop is reached or objective is completed
The bearish trade is managed using the same logic in reverse.
Example of Bullish Position Trade Management
Suppose USD/JPY trades into a Weekly Bullish Order Block.
Higher time frame analysis suggests price may move toward a Weekly Bearish Order Block above.
The trader identifies a bullish Daily setup and enters long.
After entry:
Step 1
Look back 40 trading days.
Find the lowest low.
Place the protective stop below that low.
Step 2
Each new trading day, update the 40-day lookback.
The stop remains below the lowest low inside the active 40-day range.
Step 3
Price progresses through a major portion of the projected Weekly range.
The trade is now mature.
Step 4
Begin using the previous 20 trading days.
Trail the stop below the lowest 20-day low.
Step 5
Continue holding until the Weekly Premium PD Array is reached or the trailing stop removes the position.
The wider stop protects the trade early.
The shorter lookback protects profit later.
Example of Bearish Position Trade Management
Suppose USD/JPY has broken bearish market structure.
Price rallies into a Weekly Bearish Order Block.
The Monthly and Weekly charts suggest lower prices.
The trader enters short.
The management process becomes:
Short entry
↓
Look back 40 trading days
↓
Stop above highest 40-day high
↓
Update the lookback every trading day
↓
Price continues lower
↓
Projected Monthly/Weekly move becomes mature
↓
Change to highest high of previous 20 trading days
↓
Trail stop closer to market price
↓
Protect accumulated profit
In ICT’s example, a wide structural stop could still produce a very large reward-to-risk ratio because the projected higher time frame move was significantly larger than the initial risk.
This is the advantage of position trading.
Wide Stops Do Not Mean Poor Risk Management
Some traders become uncomfortable when they see a 200- or 250-pip stop loss.
However, the stop distance alone does not determine risk.
Suppose:
Stop Distance = 250 pips
Account Risk = 1%
The trader simply calculates a position size that limits the loss to 1%.
Now suppose the expected higher time frame move offers 2,000 pips.
The potential reward-to-risk can still be extremely attractive.
The logic is:
Large structural stop
Small position size
Large HTF objective
=
Controlled account risk with significant price potential
Long-term trading requires a different mindset from scalping or day trading.
The Purpose of Position Trade Management
The goal of Position Trade Management is not to constantly adjust the trade.
The goal is to stay aligned with the higher time frame narrative.
The trader already completed the difficult work:
Seasonality
↓
Intermarket analysis
↓
Interest rate analysis
↓
Monthly and Weekly PD Array mapping
↓
Quarterly shift expectation
↓
Daily setup
After the position is entered, poor management should not destroy the original idea.
An excessively tight stop can remove the trader from a valid setup.
Moving to break even too quickly can cause the same problem.
Position Trade Management provides a framework for allowing the trade to develop while still controlling account risk.
Final Thoughts
Position Trade Management in ICT trading is built around patience, conservative risk, and higher time frame price objectives.
The trader begins with a potential seasonal tendency and then looks for confirmation through interest rates and intermarket analysis.
Monthly and Weekly PD Arrays define the likely future price objective.
Daily PD Arrays provide the setup.
After entry, the trader risks no more than approximately 1% and gives the market enough room to deliver the larger quarterly move.
For bullish trades:
Trail below the lowest low of the previous 40 trading days
For bearish trades:
Trail above the highest high of the previous 40 trading days
As the projected Monthly or Weekly move becomes mature, the trader can reduce the lookback to approximately 20 trading days and protect accumulated profits more aggressively.
The core idea is simple:
Give an immature trade room to develop.
Protect a mature trade as it approaches the HTF objective.
Position Trade Management is not about forcing the market to move immediately.
It is about managing risk, submitting to the higher time frame price delivery, and staying in the position long enough to capture the major portion of the move.