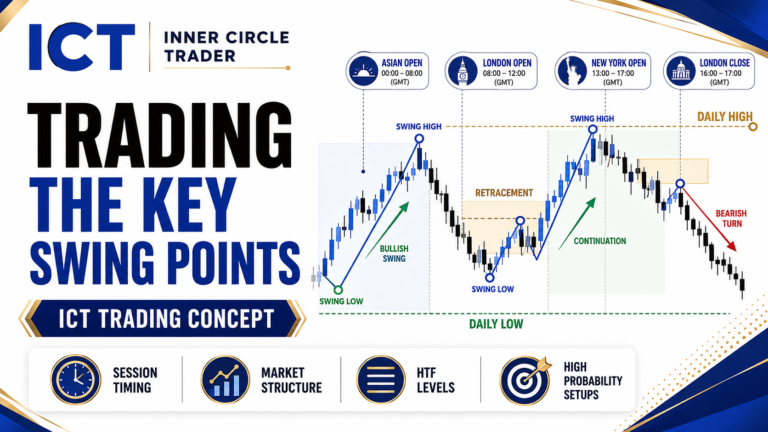
The Essentials To ICT Market Structure provide a structured way for traders to determine trade direction without becoming confused by multiple charts and conflicting price movements. In the ICT Forex – Market Maker Primer Course, Michael J. Huddleston, founder of the ICT (Inner Circle Trader) concepts, teaches traders to analyze market structure through a defined multi-timeframe framework.
The purpose is not to predict every movement in price.
The objective is to understand the market structure that applies to your trading style and timeframe.
As Michael J. Huddleston explains:
“Your primary objective is to know your time frame that you’re trading.”
A trader must first understand what type of trader they are before attempting to establish directional bias.
Why Market Structure Can Confuse New Traders
A new trader may open a chart and immediately face several timeframes:
- Monthly
- Weekly
- Daily
- 4-hour
- 1-hour
- 15-minute
- 5-minute
- 1-minute
One timeframe may appear bullish.
Another may appear bearish.
A lower timeframe may be rallying while the daily chart is declining.
This creates confusion because the trader has not defined which market structure matters to their trading model.
ICT solves this problem by using three primary timeframes.
The trader studies:
Highest timeframe → Trade premise and directional bias
Middle timeframe → Trade management and refined structure
Lowest timeframe → Entry timing
This creates a uniform way to break down price.
First Determine What Type of Trader You Are
Before analyzing market structure, decide what type of trade you are trying to capture.
ICT separates traders into several general categories:
- Position trader
- Swing trader
- Short-term trader
- Day trader
- Scalper
Each trading model requires a different timeframe structure.
A position trader should not build a trade idea from a 5-minute chart.
A day trader does not need to wait for a monthly candle to confirm every entry.
Your timeframe framework must match the expected duration of the trade.
ICT Market Structure Timeframe Framework
The three-timeframe approach is one of the most important parts of the Essentials To ICT Market Structure.
Position Trading
For position trades:
Monthly → Highest timeframe
Weekly → Middle timeframe
Daily → Lowest timeframe
The monthly chart creates the primary trade premise.
The weekly chart provides additional structural detail and helps manage the position.
The daily chart can be used for timing.
Position trades may last several months or longer.
Swing Trading
For swing trades:
Daily → Highest timeframe
4-hour → Middle timeframe
1-hour → Lowest timeframe
The daily chart determines the directional premise.
The 4-hour chart is used to refine and manage the trade.
The 1-hour chart is used for entry timing.
Michael J. Huddleston explains:
“You will be timing on the one hour, you will be managing on the four hour and the premise or the trade idea would be built upon the highest timeframe.”
This separation of functions is important.
The lower timeframe should not control the larger trade idea.
Short-Term Trading
For short-term trades:
4-hour → Highest timeframe
1-hour → Middle timeframe
15-minute → Lowest timeframe
The 4-hour chart provides directional bias.
The 1-hour chart helps refine and manage the position.
The 15-minute chart is used for entries and may also reveal early indications that the move is losing momentum.
Short-term trades may last from approximately one day to several days.
Day Trading
For day trades:
1-hour → Highest timeframe
15-minute → Middle timeframe
5-minute → Lowest timeframe
The hourly chart creates the intraday directional premise.
The 15-minute chart provides trade management and more detailed structure.
The 5-minute chart can be used for execution.
The framework can be simplified as:
Higher timeframe tells you what to look for
↓
Middle timeframe tells you how price is developing
↓
Lower timeframe tells you when to act
Focus on the Highest of Your Three Timeframes
The highest timeframe in your trading model is the foundation of the analysis.
ICT teaches that this timeframe should frame the trade premise.
Suppose you are a swing trader.
Your highest timeframe is the daily chart.
If the daily market structure is bullish, your primary objective is to search for buying opportunities.
The 4-hour and 1-hour charts are then analyzed within that bullish framework.
This does not mean price cannot decline on the lower timeframes.
It means the trader is focusing on setups that align with the market structure relevant to their trade duration.
Huddleston states:
“The highest probability trades are made in the higher time frame direction.”
Higher timeframe direction provides context.
Lower timeframe price action provides execution.
Key Support and Resistance Are Essential
ICT Market Structure cannot be studied by simply identifying higher highs and lower lows.
The location of price matters.
Huddleston repeatedly emphasizes the importance of key support and resistance levels.
A market may technically appear bullish while price is approaching major higher timeframe resistance.
That resistance can significantly change the trade expectation.
Similarly, a bearish market approaching major support may begin preparing for a reversal.
Therefore, traders should ask:
Where is price trading relative to higher timeframe support and resistance?
A simple framework is:
Bullish structure + Higher timeframe support → Look for buying opportunities
Bearish structure + Higher timeframe resistance → Look for selling opportunities
Price near major opposing level → Exercise caution
Market structure must always be studied within location.
Use Market Profiles to Understand the Current Environment
Market profiling also supports ICT Market Structure analysis.
The trader should determine whether price is:
- Trending
- Reversing
- Consolidating
Each environment creates different expectations.
Trending Market
Price is generally maintaining directional structure.
Bullish trend:
Support holds → Resistance breaks
Bearish trend:
Resistance holds → Support breaks
Reversal Environment
Price is trading into an important higher timeframe level and market structure begins changing.
For example:
Price rallies into resistance → Short-term low breaks → Bearish Market Structure Shift
Consolidation
Price remains inside a defined range.
The trader should be cautious about expecting continuous trend expansion while the market remains in a larger consolidation.
Understanding the profile helps frame market structure correctly.
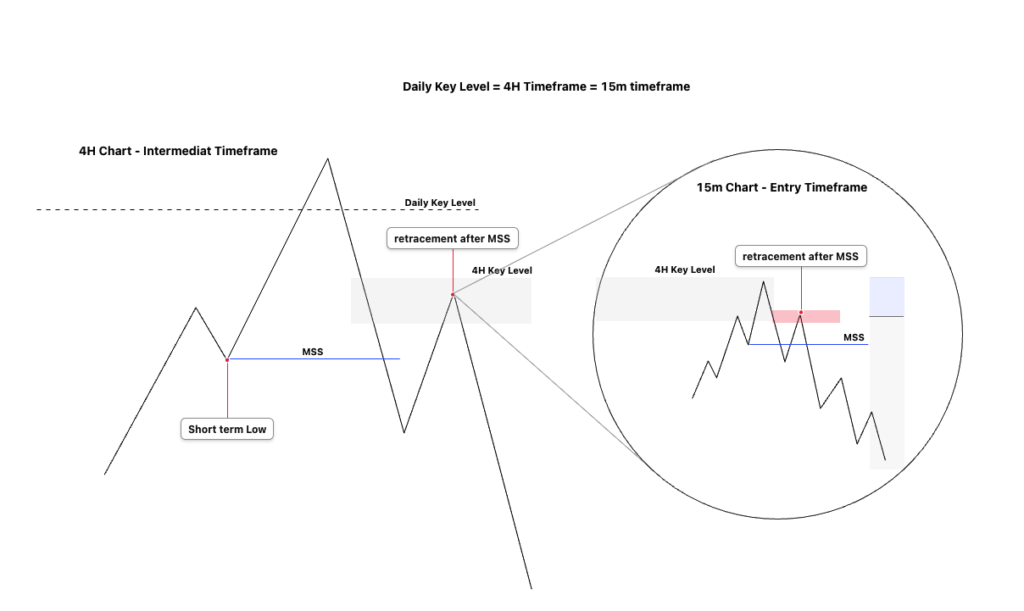
How Bearish ICT Market Structure Develops
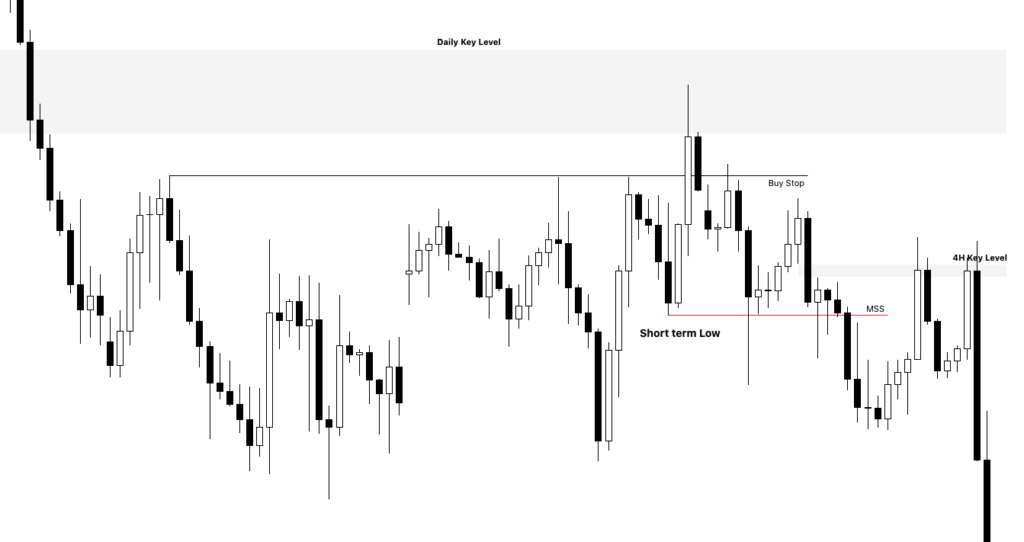
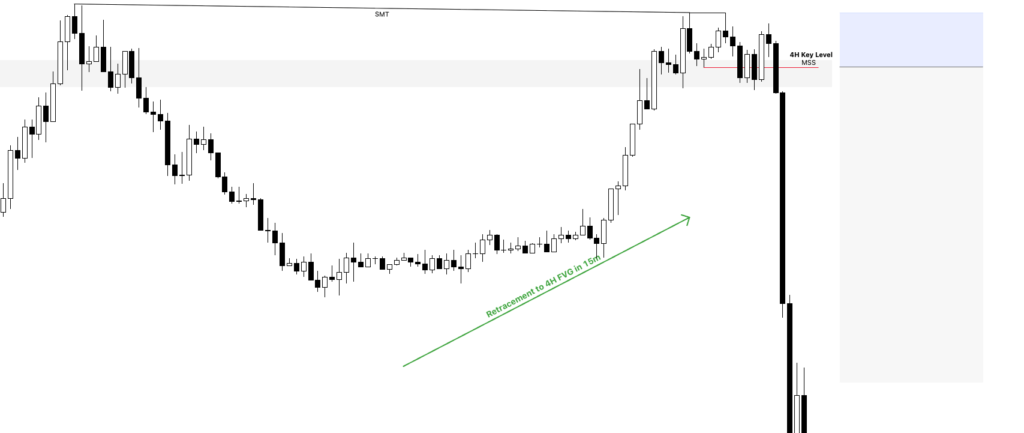
Assume price is rallying toward a major higher timeframe resistance level.
Price does not usually move in a perfectly straight line.
The market may form:
Consolidation → Rally
↓
Consolidation → Rally
↓
Higher timeframe resistance
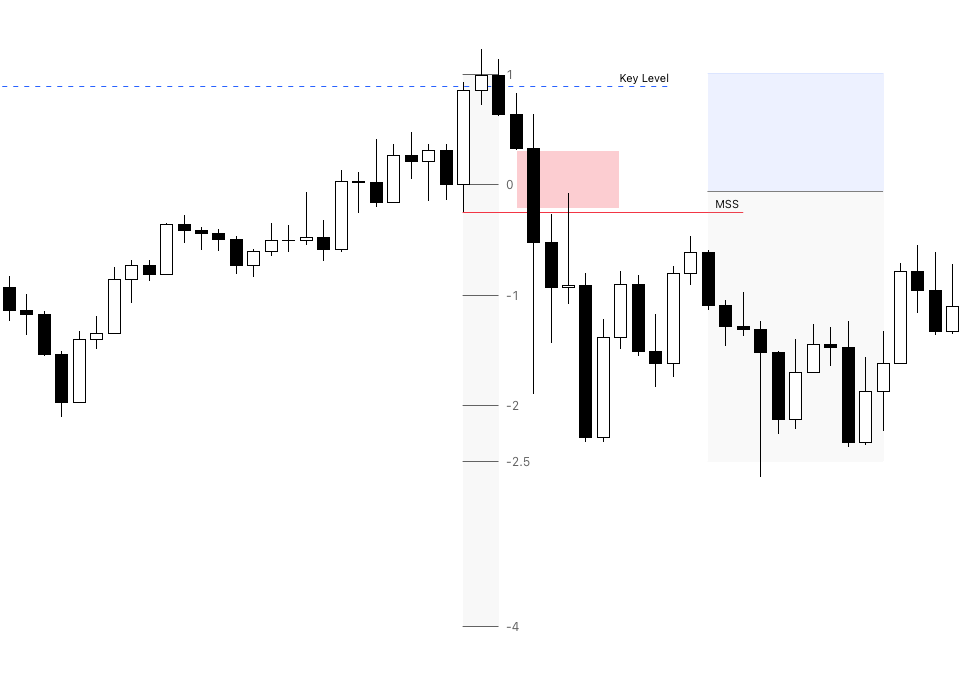
At resistance, the trader begins watching the short-term swing lows.
Suppose price breaks an important short-term low.
This may indicate a change in market structure.
The sequence becomes:
Price reaches resistance
↓
Short-term swing low is broken
↓
Bearish Market Structure Shift
↓
Price retraces
↓
Look for selling opportunities
The break in structure acts as a catalyst.
Before the structural break, the trader is only anticipating a possible reversal.
After the break, there is price action supporting the bearish expectation.
Top-Down Market Structure Confirmation
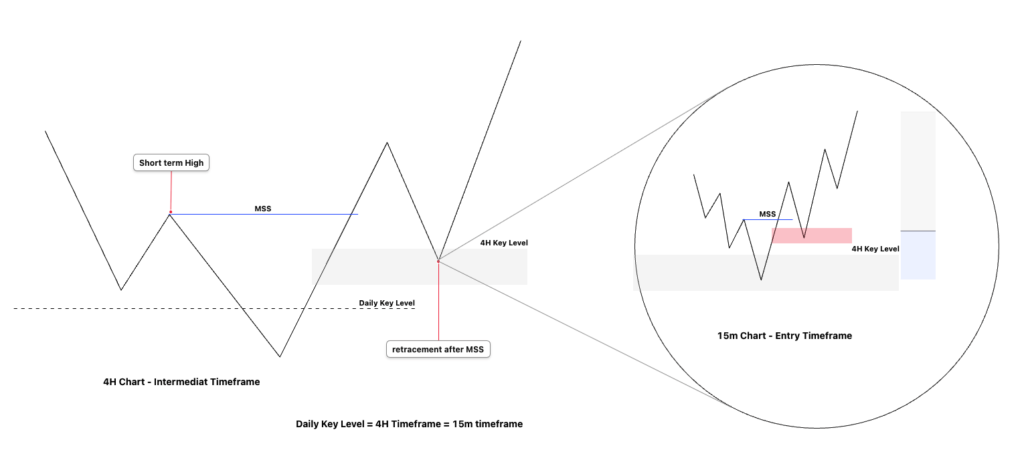
Once higher timeframe structure becomes bearish, traders can move into the middle and lower timeframes.
For example, a position trader may see:
Monthly resistance
↓
Monthly structure breaks bearish
↓
Weekly retracement into resistance
↓
Daily bearish entry formation
These elements create nested confluences.
The higher timeframe establishes the narrative.
The middle timeframe refines the location.
The lower timeframe provides the entry.
The trader is no longer entering because one candle looks bearish.
The entry is aligned with a larger structural framework.
How Bullish ICT Market Structure Develops
Bullish market structure works in the opposite direction.
Suppose price has reached an important higher timeframe support level.
Price may initially continue declining.
The trader watches the short-term highs.
When an important high is broken, market structure may begin shifting bullish.
The process becomes:
Price reaches higher timeframe support
↓
Short-term high is broken
↓
Bullish Market Structure Shift
↓
Price retraces
↓
Support holds
↓
Look for buying opportunities
Inside bullish market structure, ICT wants to see:
Support being respected
and
Resistance being broken
Huddleston summarizes the concept clearly:
“You want to see support being held, resistance being broken.”
This is the basic framework behind bullish structure.
Bearish Market Structure: Break Lows and Find Resistance
In bearish conditions, the opposite behavior is expected.
The trader wants to observe:
Lows being broken
and
Retracements finding resistance
A bearish structural sequence may look like:
Break low
↓
Retrace
↓
Find resistance
↓
Break another low
↓
Retrace
↓
Find resistance
As long as this general structure continues, the market remains bearish within the timeframe being studied.
The trader searches for short opportunities during retracements rather than chasing price after large declines.
Market Structure Is Framed by the Highest Timeframe
One of the most important lessons in Essentials To ICT Market Structure is that structure must always be discussed relative to a timeframe.
A market cannot simply be described as bullish or bearish without context.
For example:
Monthly → Bullish
Daily → Bearish retracement
1-hour → Bullish intraday move
5-minute → Bearish decline
All of these can exist at the same time.
The correct question is:
Which structure is relevant to my trading model?
A swing trader may remain bullish based on daily structure while a day trader successfully sells an intraday decline.
Both traders can be correct.
Their trading horizons are different.
Every Day Can Have Movement in Both Directions
Traders frequently ask:
“What is today’s bias?”
Huddleston provides an important perspective:
“Every day the bias is both directions.”
Price can move higher and lower during the same trading session.
Traders can make money buying and selling on the same day.
The purpose of directional bias is not to claim that price can only move in one direction.
Your bias represents the direction you have chosen to focus on based on your timeframe and market structure model.
Suppose your higher timeframe premise is bullish.
A lower timeframe sell setup may develop.
Another trader may successfully sell it.
But that is not necessarily your trade.
Your plan is to wait for price to reach your bullish action level and present the setup that fits your model.
Find Your Action Level
Once directional bias is established, the trader needs a specific price location.
ICT combines market structure with:
- Key support
- Key resistance
- Time of day
- Kill Zones
- Entry models
Suppose your market structure is bullish.
You identify an important support level.
The next step is to wait.
Price trades down toward support.
It reaches the level during an ICT Kill Zone.
Now the trader begins searching for an entry.
The process is:
Higher timeframe bullish structure
↓
Identify key support
↓
Wait for price to reach support
↓
Wait for appropriate time of day
↓
Apply entry model
↓
Execute the trade
The support level becomes the trader’s action point.
You do not need to trade every movement before price reaches that level.
Use Time and Price Together
ICT Market Structure becomes more useful when combined with time.
A trader may already have:
- Bullish directional bias
- Higher timeframe support
- Expected price level
However, the trader still waits for price to arrive during an appropriate trading window.
Huddleston refers to combining time and price theory.
The logic is:
Correct market structure
Correct price location
Correct time window
Valid entry model
=
Potential trade opportunity
The trader waits for these elements to align.
Lower Timeframe Entries Should Fit the Higher Timeframe Bias
Assume the higher timeframe suggests bullish market structure.
The lower timeframe may still produce bearish patterns.
A very short-term trader may profit from those bearish moves.
But a trader following the higher timeframe bullish premise should remain focused on buying opportunities.
Huddleston explains:
“You’re just simply looking for a bias for your style of trading.”
This prevents traders from constantly switching direction because of every lower timeframe candle.
The trader selects a framework and waits for price action to align with it.
Intermediate-Term Highs and Lows
ICT also classifies swing points to understand how market structure is nested.
An Intermediate-Term High is generally a high with lower highs on both sides.
Visually:
Lower High ← Intermediate-Term High → Lower High
An Intermediate-Term Low is generally a low with higher lows on both sides.
Visually:
Higher Low ← Intermediate-Term Low → Higher Low
These swing points help traders identify important price legs.
By marking intermediate-term highs and lows, traders begin understanding whether the market is inside a short-term, intermediate-term, or larger price swing.
Long-Term Swing Points and Nested Structure
Swing points can nest inside larger formations.
Suppose an Intermediate-Term High also has lower Intermediate-Term Highs on both sides.
That central high can become a longer-term structural high.
This nesting process helps traders understand the hierarchy of market structure.
The market is fractal.
Smaller price swings exist inside larger price swings.
A lower timeframe Market Structure Shift may begin a short-term move while still operating inside a much larger bearish or bullish framework.
Therefore, traders should always return to their selected three-timeframe model.
Use Broken Swings for Price Projections
ICT also uses broken price swings to anticipate future movement.
Suppose bearish market structure is established.
A price swing forms:
Low → High
Price later breaks below the low.
The distance between the low and high can be measured and projected lower.
This creates a potential measured swing objective.
For example:
Previous swing range = 50 pips
Swing low breaks
Retracement forms
Project approximately 50 pips lower from the relevant structural point
This is not a guarantee that price must reach the exact objective.
It provides a framework for anticipating the next price leg.
Measured Price Legs in Market Structure
Price legs can also be compared.
Suppose price declines from a high to a low.
Price retraces.
The next bearish leg may produce a movement similar in size to the first decline.
The structure becomes:
First bearish leg
↓
Retracement
↓
Second bearish leg
Traders can use the first price leg as a potential reference for the second.
The same concept applies to bullish market structure.
First bullish leg
↓
Retracement
↓
Second bullish leg
These projections can help traders establish realistic profit objectives.
Be Comfortable With the Gray Area
One of the most important parts of the ICT Market Structure lesson is accepting uncertainty.
Between the entry and the expected target is what Huddleston describes as a gray area.
You do not know exactly how price will move.
Price may:
- Consolidate
- Retrace deeply
- Move immediately
- Fail to reach the target
- Reverse and stop you out
The trader must be comfortable with this uncertainty.
Huddleston explains:
“You must enter the gray and be comfortable with the less than perfect visibility.”
Trading is not black and white.
Market structure provides a probability framework.
It does not provide certainty.
Directional Bias Does Not Guarantee Profitability
Choosing a bullish bias does not guarantee that your buy trade will win.
Choosing a bearish bias does not guarantee that price must decline.
Huddleston makes this very clear.
Two traders may have opposite biases.
One trader buys.
Another trader sells.
Depending on their timeframes and targets, both may make money.
They may also both lose.
The objective is not to prove that your market opinion is objectively correct.
The objective is to trade a defined market structure with controlled risk and realistic profit targets.
Do Not Expect 100% Accuracy
New traders frequently try to create a directional bias model that works every day.
They combine more indicators, concepts, and tools because they believe additional analysis will create certainty.
ICT teaches that this expectation is unrealistic.
Huddleston states:
“I’m still trading on the probabilities, not the perfect scenario.”
No analysis removes uncertainty.
The goal is to wait until the majority of your important concepts align.
For example:
Higher timeframe support
Bullish market profile
Bullish structure shift
Appropriate Kill Zone
Valid entry model
This creates a potential high-probability trading scenario.
Not a guaranteed trade.
A Simple ICT Market Structure Process
A trader can use the following process:
Step 1: Identify your trading style
Position → Swing → Short-term → Day trading
↓
Step 2: Select your three timeframes
Highest → Middle → Lowest
↓
Step 3: Study the highest timeframe
Identify key support and resistance
↓
Step 4: Determine market profile
Trending → Reversing → Consolidating
↓
Step 5: Read market structure
Bullish → Support holds and resistance breaks
Bearish → Resistance holds and lows break
↓
Step 6: Identify a Market Structure Shift
Break of an important structural high or low
↓
Step 7: Refine on the middle timeframe
Find more precise support, resistance, and trade management levels
↓
Step 8: Wait for your action level
Do not chase price
↓
Step 9: Use the lowest timeframe for timing
Apply your ICT entry model
↓
Step 10: Target using higher and middle timeframe structure
Manage risk and accept uncertainty
Final Thoughts on Essentials To ICT Market Structure
The Essentials To ICT Market Structure are not about identifying every higher high and lower low on a chart.
The real objective is to create a structured method for determining trade direction based on your trading timeframe.
In the ICT (Inner Circle Trader) approach taught by Michael J. Huddleston, traders use three timeframes.
The highest timeframe creates the trade premise.
The middle timeframe refines structure and helps manage the trade.
The lowest timeframe is used for entry timing.
Study key support and resistance. Determine the current market profile. Watch whether price is holding support and breaking resistance or finding resistance and breaking lows.
Most importantly, accept that market structure deals in probabilities.
As Huddleston teaches, the trader must become comfortable living in the gray.
Find your timeframe, trade within the market structure relevant to that timeframe, keep risk controlled, and wait until the price action aligns with the framework you understand.