The ICT ATM Method is a standalone price action setup taught by Michael J. Huddleston, the founder of the ICT (Inner Circle Trader) methodology. This concept is covered in the ICT Forex – Market Maker Primer Course and is designed to help traders identify key support and resistance levels created by stop runs and breaks in market structure.
The ATM Method is primarily studied on the 60-minute chart. It looks for a liquidity raid, a structural break, and a retracement back to a key rejection level.
As Michael J. Huddleston explains:
“It’s a standalone price action pattern. The pattern capitalizes on stop runs.”
The model can be used in both bullish and bearish market conditions and includes a complete framework for entry, stop-loss placement, and profit targets.
What Is the ICT ATM Method?
The ICT ATM Method is a price action pattern built around three main ideas:
- A stop run above or below a short-term swing
- A break in market structure
- A retracement back to a key support or resistance level
Instead of marking every possible support and resistance level, the ATM Method focuses on levels that have been validated by liquidity and structural price action.
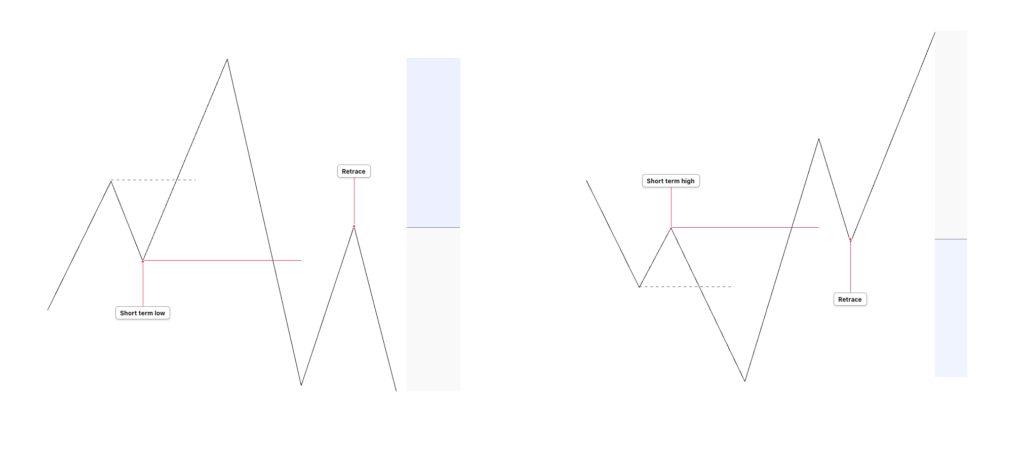
The basic bearish model is:
Short-Term High Raided → Swing Low Broken → Price Retraces to Broken Swing Low → Sell
The bullish model is:
Short-Term Low Raided → Swing High Broken → Price Retraces to Broken Swing High → Buy
This provides a systematic method for determining which support or resistance level is likely to be important.
Why the 60-Minute Chart Is Used
Huddleston teaches traders to initially identify the ATM Method on the 60-minute timeframe.
The hourly chart is useful because it provides a relatively clean view of market structure while still allowing the trader to refine the setup on a lower timeframe.
According to Huddleston:
“The reason why I like to look for it on the hourly chart is because it gives me flexibility to draw down to a lower timeframe to refine risk to a smaller amount while still keeping the maximum reward still in sight.”
The 60-minute chart helps traders clearly identify:
- Short-term swing highs
- Short-term swing lows
- Liquidity raids
- Structural breaks
- Important rejection levels
Once the setup is identified, the trader can move to a 15-minute or 5-minute chart to improve the risk-to-reward profile.
The Bearish ICT ATM Method
The bearish ATM setup begins with a key high forming on the 60-minute chart.
Price first creates a short-term high.
It then trades above that high.
This move above the old high runs liquidity or stops resting above the swing.
The sequence begins:
Short-Term High → Price Trades Above High → Buy-Side Liquidity Taken
However, the pattern is not yet complete.
Price must then decline and break an important short-term swing low.
Huddleston explains:
“It does not become a valid pattern until we get below this swing low.”
Therefore, the bearish ATM structure is:
Short-Term High Raided → Rejection → Swing Low Broken
Once the swing low is broken, the trader waits for price to retrace back to the level of the broken swing low.
That previous support level can now act as resistance.
The complete sequence is:
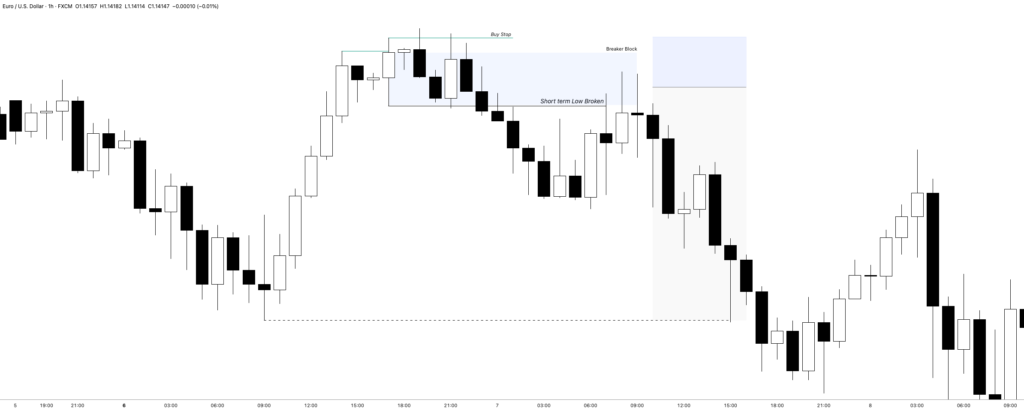
Liquidity Raid Above High → Market Structure Break Lower → Retracement to Broken Swing Low → Bearish Entry
Why the Bearish ATM Level Becomes Resistance
The key ATM level is important because of what occurred around it.
Before the key high formed, the level acted as a short-term support point.
Price then ran above a previous high and rejected.
After that, price broke below the swing low.
This indicates a significant change in short-term market structure.
The old support level can now act as resistance.
The sequence is:
Old Support → Structural Break → Price Trades Below Level → Retracement → New Resistance
The ATM Method therefore applies traditional support and resistance ideas, but with additional liquidity and market structure context.
Huddleston states:
“In essence this is a break in market structure here, and all we’re doing is waiting for a retest of that same old support level now becomes resistance.”
This is what makes the level more meaningful than a randomly selected support or resistance zone.
The Two-Stage Move in a Bearish ATM Setup
The bearish ATM Method can become stronger when the key high forms after a two-stage move higher.
For example:
Short-Term High Raided → Price Continues Higher → Another Short-Term High Raided → Rejection
The market has now taken liquidity above two separate short-term highs.
From a technical standpoint, price may be considered relatively overbought without using a traditional oscillator.
The structure becomes:
First High Taken → Second High Taken → Rejection → Swing Low Broken
Huddleston explains that this type of price movement can indicate an overbought condition without the need for indicators.
The second stop run adds context to the bearish setup.
Bearish ATM Entry
Once the structural swing low has been broken, the trader waits for price to retrace.
The entry is framed around the swing low that formed immediately before the key high.
Price Retraces to Broken Swing Low → Sell Scenario
The trader should not attempt to sell simply because a short-term high has been taken.
The structural break must occur first.
Therefore:
Liquidity Raid Alone = No ATM Entry
Liquidity Raid + Swing Low Break + Retracement = Bearish ATM Setup
This validation process helps avoid prematurely fading strong bullish movements.
Bearish ATM Profit Target
After identifying the bearish entry level, the trader needs a logical downside objective.
The ATM Method targets sell-side liquidity below a short-term swing low.
Look for an obvious low below the entry.
Stops are likely resting underneath that price point.
The target framework is:
Entry at ATM Resistance → Sell-Side Liquidity Below Old Low
The trader aims for price to trade toward or slightly below the old swing low.
This allows the market’s liquidity structure to define the profit target.
Bearish ATM Stop-Loss Placement
For a bearish ATM setup, the stop-loss is generally placed above the key high or rejection high.
Huddleston teaches placing the stop approximately one or two pips above the key high in Forex examples.
The structure is:
Key High
Stop-Loss Above Key High
ATM Short Entry
Sell-Side Liquidity Target
A small movement above the entry level does not necessarily invalidate the setup.
The key invalidation point is the rejection high that defines the bearish ATM pattern.
The Bullish ICT ATM Method
The bullish ATM Method is the inverse of the bearish model.
Price first creates a short-term low.
It then trades below that low.
This runs sell-side liquidity.
The initial sequence is:
Short-Term Low → Price Trades Below Low → Sell-Side Liquidity Taken
Next, price must rally and break an important short-term swing high.
The bullish ATM pattern does not become valid until price trades above this swing high.
The structure becomes:
Short-Term Low Raided → Bullish Rejection → Swing High Broken
Once this structural break occurs, traders wait for price to retrace back to the broken swing high.
The complete bullish model is:
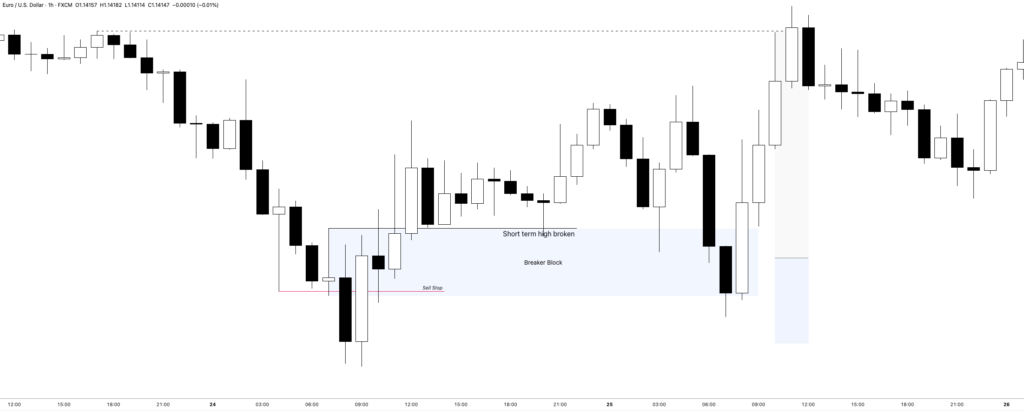
Liquidity Raid Below Low → Market Structure Break Higher → Retracement to Broken Swing High → Buy
Why the Bullish ATM Level Becomes Support
Before the key low forms, the selected price level acts as short-term resistance.
After price runs sell-side liquidity and rallies through the swing high, market structure changes.
The previous resistance level can now become support.
The sequence is:
Old Resistance → Bullish Structural Break → Price Trades Above Level → Retracement → New Support
When price returns to this level, ICT traders can look for a bullish ATM entry.
This allows the trader to identify support using price action rather than randomly selecting horizontal levels.
The Two-Stage Move in a Bullish ATM Setup
The bullish ATM model is often stronger when price completes a two-stage move lower.
For example:
First Short-Term Low Raided → Price Trades Lower → Second Short-Term Low Raided → Bullish Reversal
This can indicate that the market is technically oversold.
The price structure is:
First Low Taken → Second Low Taken → Rejection → Swing High Broken
The second liquidity raid provides additional evidence that lower prices may be exhausted.
The trader then focuses on the structural break and subsequent retracement.
Bullish ATM Entry
Once price breaks above the important swing high, the trader waits for a retracement.
The broken swing high becomes the ATM support level.
Price Retraces to Broken Swing High → Long Scenario
The trader is effectively buying the retest of a structurally important resistance level that has become support.
Again, the setup requires all three components:
Sell-Side Liquidity Raid
Bullish Market Structure Break
Retracement to Key Level
Without the swing high break, the bullish ATM pattern is incomplete.
Bullish ATM Profit Target
The profit objective for a bullish ATM setup is usually buy-side liquidity above a short-term high.
The trader identifies an old swing high above the entry.
Buy stops are expected to rest above the level.
The framework becomes:
ATM Support Entry → Buy-Side Liquidity Above Old High
Price does not have to stop exactly at the old high.
The objective is the liquidity resting above the swing point.
Bullish ATM Stop-Loss Placement
The bullish stop-loss is placed below the key low or rejection low.
The setup structure is:
Buy-Side Liquidity Target
ATM Long Entry
Stop-Loss Below Key Low
The key low represents the point where price previously rejected lower prices.
A meaningful move below this level can invalidate the bullish ATM narrative.
Refining the ATM Method on the 15-Minute Chart
A major advantage of The ICT ATM Method is the ability to identify the setup on the hourly chart and then refine the entry on a lower timeframe.
Suppose the 60-minute setup requires a large stop-loss.
The trader can move to the 15-minute chart and study the retracement more closely.
Huddleston demonstrates using the ICT Optimal Trade Entry concept to improve the entry.
The process is:
Identify ATM Setup on 60-Minute Chart → Move to 15-Minute Chart → Study Retracement → Apply Optimal Trade Entry → Reduce Stop-Loss
The higher timeframe target remains unchanged.
Only the entry precision and risk are refined.
Refining the ATM Method on the 5-Minute Chart
The trader can sometimes move even lower to the 5-minute timeframe.
The same 60-minute ATM narrative is maintained.
However, the trader searches for a more precise lower timeframe entry.
For example:
60-Minute ATM Setup Identified
15-Minute Structure Confirmed
5-Minute Optimal Trade Entry Forms
Precise Entry
Smaller Stop-Loss
Original Hourly Liquidity Target Maintained
Huddleston shows how a wide hourly stop can potentially be reduced significantly by using a lower timeframe entry.
This can improve the reward-to-risk ratio without changing the original target.
Maintaining the Same Higher Timeframe Target
One of the most important lessons in the ICT ATM Method is that lowering the entry timeframe does not necessarily mean reducing the profit objective.
Suppose the hourly ATM setup targets buy-side liquidity 200 pips away.
The original hourly stop may be 100 pips.
A lower timeframe entry may reduce the risk to 20 or 30 pips.
The liquidity target can remain the same.
The framework becomes:
Hourly Target Remains Fixed → Lower Timeframe Entry Refines Risk
Huddleston explains:
“We can use the optimal trade entry, zero in and reduce the risk, but still keep the possible potential reward still the same as we would have used from an hourly setup.”
This is how the ATM Method can create favorable reward-to-risk opportunities.
The Role of Stop Runs in the ATM Method
Stop runs are the foundation of the ATM pattern.
In bearish conditions, price trades above a short-term high.
Buy stops are taken.
Price then rejects and breaks lower.
In bullish conditions, price trades below a short-term low.
Sell stops are taken.
Price then rejects and breaks higher.
Bearish ATM:
Buy-Side Liquidity Raid → Bearish Structural Break
Bullish ATM:
Sell-Side Liquidity Raid → Bullish Structural Break
The stop run creates the potential turning point.
The market structure break confirms the change in price behavior.
The retracement provides the entry opportunity.
ICT ATM Method vs Traditional Support and Resistance
Traditional technical analysis teaches traders to buy support and sell resistance.
The problem is determining which support or resistance levels actually matter.
The ATM Method adds specific conditions.
A valid key level is associated with:
- A liquidity raid
- A rejection
- A structural break
- A subsequent retest
Therefore, the ATM Method is more selective.
Traditional Approach:
Price Is at Resistance → Sell
ATM Approach:
High Raided → Price Rejects → Swing Low Breaks → Broken Level Retested → Sell
For bullish setups:
Traditional Approach:
Price Is at Support → Buy
ATM Approach:
Low Raided → Price Rejects → Swing High Breaks → Broken Level Retested → Buy
The additional context helps traders identify more meaningful price levels.
Simple Bearish ATM Checklist
A bearish ICT ATM setup can be analyzed using this checklist:
- Open the 60-minute chart.
- Identify a short-term high.
- Wait for price to trade above the high.
- Preferably identify a two-stage move higher.
- Watch for rejection from higher prices.
- Identify the important swing low.
- Wait for price to break below the swing low.
- Mark the broken swing low level.
- Wait for price to retrace to the level.
- Look for a short entry.
- Place risk above the key high.
- Target sell-side liquidity below an old low.
The structure is:
Stop Run → Structural Break → Retest → Short → Sell-Side Liquidity
Simple Bullish ATM Checklist
For a bullish setup:
- Open the 60-minute chart.
- Identify a short-term low.
- Wait for price to trade below the low.
- Preferably identify a two-stage move lower.
- Watch for rejection from lower prices.
- Identify the important swing high.
- Wait for price to break above the swing high.
- Mark the broken swing high level.
- Wait for price to retrace to the level.
- Look for a long entry.
- Place risk below the key low.
- Target buy-side liquidity above an old high.
The structure is:
Stop Run → Structural Break → Retest → Long → Buy-Side Liquidity
Common Mistakes When Using the ICT ATM Method
Entering Immediately After a Stop Run
A liquidity raid alone does not complete the ATM setup.
Wait for the market structure break.
Ignoring the 60-Minute Structure
The ATM Method is initially identified on the hourly chart.
Lower timeframes should be used for refinement, not for creating an unrelated narrative.
Marking Random Support and Resistance
The ATM level should be connected to a stop run and structural break.
Moving the Target After Refining the Entry
The lower timeframe can reduce risk while the original higher timeframe liquidity objective remains available.
Using Indicators to Define Overbought or Oversold
The ATM Method studies repeated stop runs and price swings to evaluate these conditions directly from price action.
Final Thoughts
The ICT ATM Method is a complete price action setup that combines liquidity, market structure, support and resistance, and lower timeframe risk refinement.
The core bearish model is:
Buy-Side Liquidity Raid → Swing Low Break → Retest of Broken Swing Low → Sell → Target Sell-Side Liquidity
The bullish model is:
Sell-Side Liquidity Raid → Swing High Break → Retest of Broken Swing High → Buy → Target Buy-Side Liquidity
The pattern is initially identified on the 60-minute chart. Traders can then move to the 15-minute or 5-minute timeframe and use ICT entry concepts such as Optimal Trade Entry to reduce risk.
The real strength of the ATM Method is its definition of key support and resistance. A level becomes important because price has taken liquidity, rejected, broken market structure, and returned to the structurally significant price point.
By focusing on these conditions, ICT traders can avoid randomly trading support and resistance and instead wait for a complete liquidity-driven price action model.