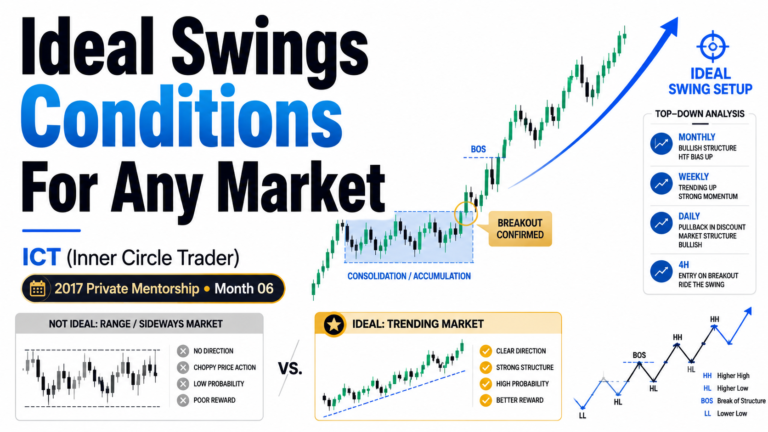
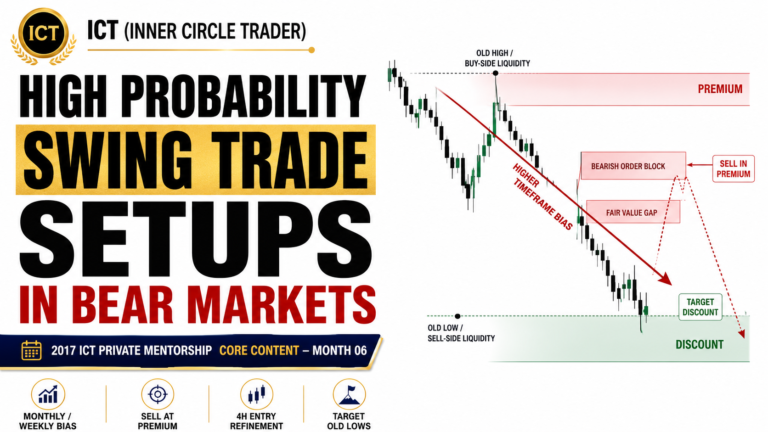
The Classic Swing Trading Approach is taught by Michael J. Huddleston, founder of the ICT (Inner Circle Trader) methodology, in the 2017 ICT Private Mentorship Core Content Month 06. This approach teaches traders how to combine higher-timeframe direction, Premium and Discount PD Arrays, displacement, retracement and four-hour execution to capture larger directional price moves.
The model is not based on predicting every market turn. It begins by determining where price is likely to reach, identifying which side of the market recently produced strong displacement, and then waiting for price to retrace into a favorable area.
Michael J. Huddleston explains:
“When defining market conditions, we think in terms of where the price can reach.”
That idea forms the foundation of the Classic Swing Trading Approach.
What Is the Classic Swing Trading Approach?
The Classic Swing Trading Approach is a top-down trading model used to identify intermediate-term buying and selling opportunities.
The trader studies:
- The monthly chart
- The weekly chart
- The daily chart
- The four-hour chart
The monthly, weekly and daily charts establish the market direction and major price objectives. The four-hour chart is used as the primary execution timeframe.
The highest-probability conditions appear when all four timeframes support the same directional idea.
For bullish conditions:
- The monthly chart is in a buy program
- The weekly chart is in a buy program
- The daily chart supports higher prices
- The four-hour chart retraces into a Discount PD Array
For bearish conditions:
- The monthly chart is in a sell program
- The weekly chart is in a sell program
- The daily chart supports lower prices
- The four-hour chart retraces into a Premium PD Array
This alignment allows the trader to execute in the same direction as the larger market flow.
Understanding the PD Array Spectrum
The Classic Swing Trading Approach uses a structured hierarchy of Premium and Discount PD Arrays.
In simple terms:
- PD Arrays above current price form the Premium Spectrum
- PD Arrays below current price form the Discount Spectrum
When a Discount PD Array supports price and causes strong bullish displacement, the probability increases that price will seek a Premium PD Array above the market.
When a Premium PD Array resists price and causes strong bearish displacement, the probability increases that price will seek a Discount PD Array below the market.
Michael J. Huddleston states:
“If discount arrays have provided support for price, probabilities increase that the premium arrays will be sought above the market price.”
The opposite applies when Premium PD Arrays create resistance.
Main PD Arrays Used in Swing Trading
The trader should map the relevant PD Arrays above and below current market price.
These may include:
- Mitigation Blocks
- Breaker Blocks
- Liquidity Voids
- Fair Value Gaps
- Order Blocks
- Rejection Blocks
- Old highs
- Old lows
- Historical highs
- Historical lows
Not every chart will contain every type of PD Array. The trader should identify only the active arrays present in the current price range.
For bullish setups, the focus is placed on active Discount PD Arrays below price.
For bearish setups, the focus is placed on active Premium PD Arrays above price.
How to Determine Market Direction
The first step is identifying where price recently moved away from with speed and displacement.
The trader should ask:
- Did price move aggressively away from support?
- Did price move aggressively away from resistance?
- Were the candles large and directional?
- Did price leave behind a Fair Value Gap or Liquidity Void?
- Was the move strong enough to suggest institutional participation?
Strong displacement indicates that larger participants may be repricing the market.
If price moves aggressively away from a Discount PD Array, it suggests a bullish buy program.
If price moves aggressively away from a Premium PD Array, it suggests a bearish sell program.
The side of the market that created the most recent meaningful displacement helps determine the likely directional bias.
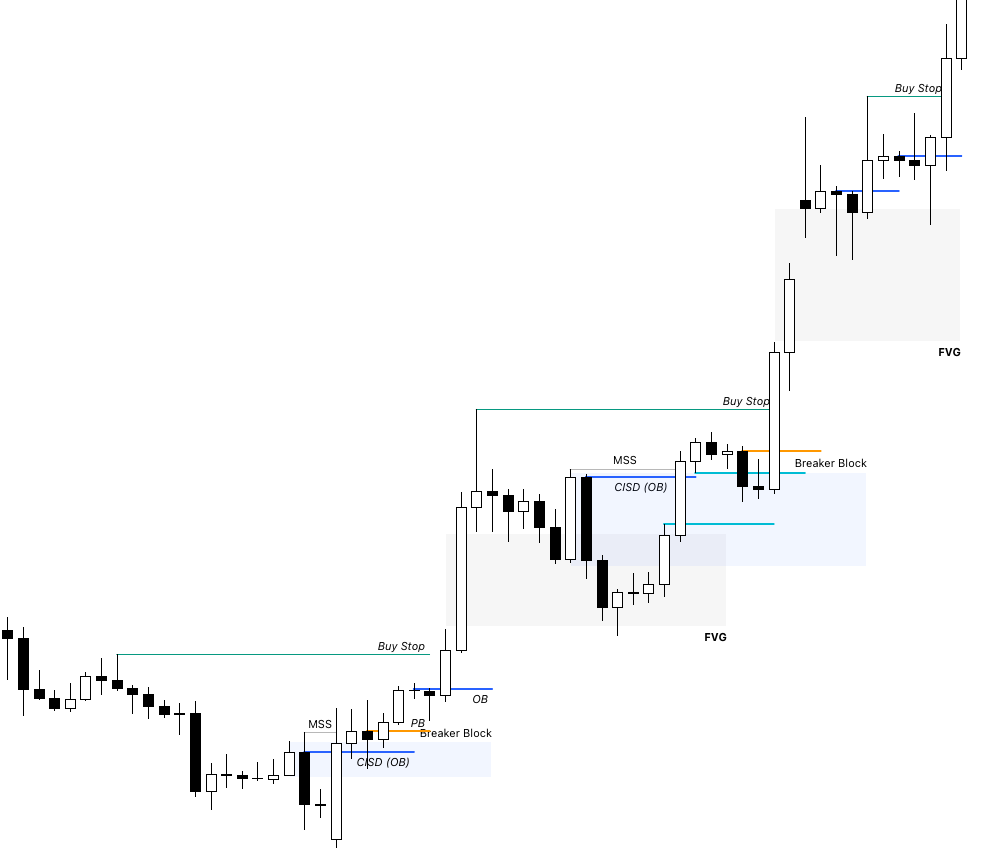
What Is a Buy Program?
A buy program develops when price finds support at Discount PD Arrays and begins seeking Premium PD Arrays above the market.
A bullish sequence may begin when price reacts from:
- A bullish Order Block
- A bullish Breaker
- A bullish Mitigation Block
- A Fair Value Gap below price
- A Liquidity Void
- Sell-side liquidity below an old low
- A bullish Rejection Block
The trader wants the monthly, weekly and daily charts to support higher prices.
The four-hour chart should then retrace into a Discount PD Array and provide a buying opportunity.
The ideal bullish sequence is:
Higher-timeframe bullish condition
Market rallies with displacement
Price forms an impulse swing
Price retraces into discount
Four-hour Discount PD Array supports price
Price expands toward Premium PD Arrays
The trader is not chasing the initial rally. The trader waits for the retracement.
Huddleston explains:
“We had to take our hands and sit on them until we wait for the retracement to come to fruition.”
Patience is therefore a central part of the model.
What Is a Sell Program?
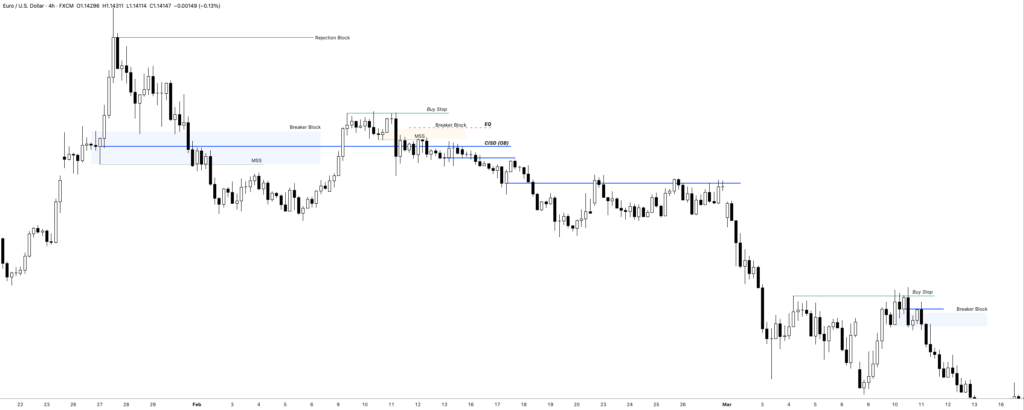
A sell program develops when price finds resistance at Premium PD Arrays and begins seeking Discount PD Arrays below the market.
A bearish sequence may begin when price reacts from:
- A bearish Order Block
- A bearish Breaker
- A bearish Mitigation Block
- A Fair Value Gap above price
- A Liquidity Void
- Buy-side liquidity above an old high
- A bearish Rejection Block
The trader wants the monthly, weekly and daily charts to support lower prices.
The four-hour chart should then retrace into a Premium PD Array and provide a selling opportunity.
The ideal bearish sequence is:
Higher-timeframe bearish condition
Market declines with displacement
Price forms an impulse swing
Price retraces into premium
Four-hour Premium PD Array resists price
Price expands toward Discount PD Arrays
Again, the trader avoids chasing the initial decline and waits for price to retrace into a favorable selling area.
Condition, Stage and Execution
The Classic Swing Trading Approach can be divided into three parts.
Condition
The condition is the higher-timeframe directional framework.
For a bullish trade, the trader must have evidence that price is predisposed to move higher.
For a bearish trade, the trader must have evidence that price is predisposed to move lower.
This evidence may include:
- Higher-timeframe market structure
- Interest-rate differentials
- Seasonal tendencies
- Commitment of Traders data
- Intermarket analysis
- SMT Divergence
- Institutional Market Structure
- Recent displacement from a PD Array
The trader does not need every factor to agree. A few strong supporting factors may be enough to form a directional outlook.
Stage
The stage develops after price creates an impulse move and begins retracing.
During the retracement, the trader maps the relevant Premium or Discount PD Arrays inside the impulse range.
This is the preparation phase.
The trader identifies where institutional order flow may re-enter the market and where a valid swing setup may form.
Execution
Execution occurs when price reaches the selected PD Array and confirms the expected reaction.
For swing trading, the four-hour chart is commonly used to enter.
The trader then aims to capture the next expansion swing toward higher-timeframe liquidity or an opposing PD Array.
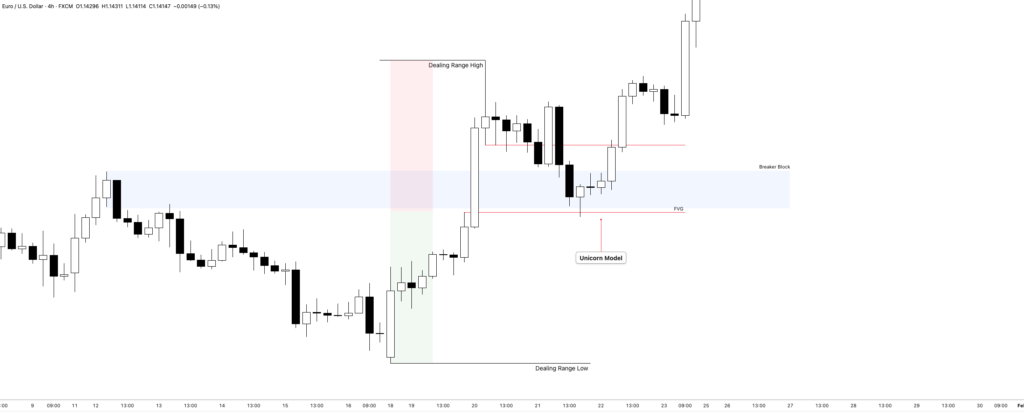
Defining the Impulse Range
After displacement occurs, the trader defines the impulse range.
In a bullish market:
- The low is the point of origin
- The high is the intermediate-term high before the retracement
- The range between them is studied for Discount PD Arrays
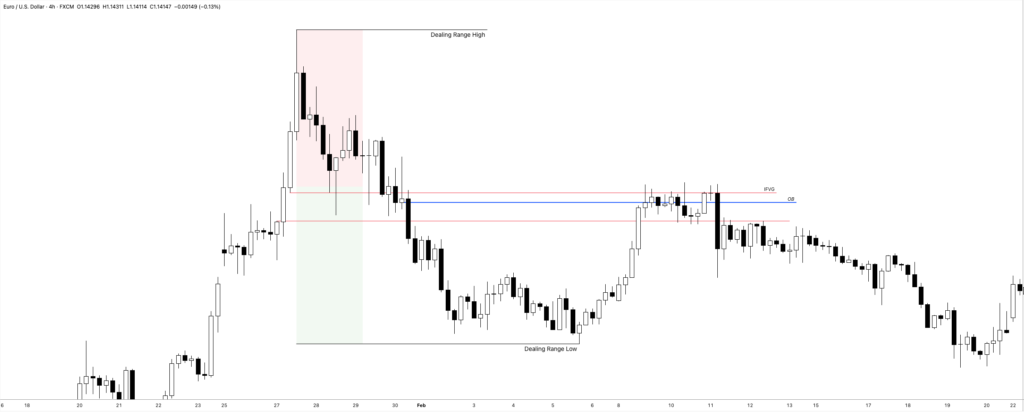
In a bearish market:
- The high is the point of origin
- The low is the intermediate-term low before the retracement
- The range between them is studied for Premium PD Arrays
The trader searches this range for active PD Arrays.
For a bullish setup, possible Discount PD Arrays include:
- Bullish Order Blocks
- Bullish Breakers
- Bullish Mitigation Blocks
- Fair Value Gaps
- Liquidity Voids
- Old lows
- Rejection Blocks
- Historical highs acting as support
For a bearish setup, possible Premium PD Arrays include:
- Bearish Order Blocks
- Bearish Breakers
- Bearish Mitigation Blocks
- Fair Value Gaps
- Liquidity Voids
- Old highs
- Rejection Blocks
- Historical lows acting as resistance
This process helps the trader identify exact price levels before the retracement reaches them.
The Top-Down Swing Trading Procedure
The Classic Swing Trading Approach follows a structured top-down process.
Step 1: Study the 9-to-18-Month Market Profile
Begin with the monthly and weekly charts.
Determine whether the market is:
- Trending
- Consolidating
- Leaving a consolidation
- Reversing
The ideal market is already trending or has recently left consolidation with strong displacement.
A market trapped inside a narrow range is less suitable for a classic swing setup.
Step 2: Map the Monthly PD Arrays
Identify the active Premium and Discount PD Arrays on the monthly chart.
If monthly Discount PD Arrays are supporting price, determine the monthly Premium PD Arrays that may become targets.
If monthly Premium PD Arrays are resisting price, determine the monthly Discount PD Arrays that may become targets.
Transfer these important levels to the weekly chart.
Step 3: Map the Weekly PD Arrays
Study the weekly chart using the same process.
Identify active weekly PD Arrays and determine whether price is reacting bullishly from discount or bearishly from premium.
Transfer the relevant weekly levels to the daily chart.
Step 4: Map the Daily PD Arrays
Identify the active daily Premium and Discount PD Arrays.
Determine which daily levels agree with the monthly and weekly directional bias.
Transfer these daily levels to the four-hour chart.
Step 5: Execute on the Four-Hour Chart
Use the four-hour chart to identify the active entry arrays.
In bullish conditions, look to buy four-hour Discount PD Arrays.
In bearish conditions, look to sell four-hour Premium PD Arrays.
The entry may form at:
- An Order Block
- A Breaker
- A Mitigation Block
- A Fair Value Gap
- A Liquidity Void
- An old high or low
- A Rejection Block
- A liquidity run
The strongest setups occur when several higher-timeframe levels overlap near the same price area.
Bullish Classic Swing Trade Example
A bullish Classic Swing Trading Approach may develop as follows:
- The monthly chart shows bullish market structure.
- Price recently moved away from a monthly Discount PD Array.
- The weekly chart is also supporting higher prices.
- The daily chart creates bullish displacement.
- Price forms an impulse swing and an intermediate-term high.
- The market begins retracing.
- The trader maps Discount PD Arrays inside the impulse range.
- Price reaches a four-hour bullish Order Block or Fair Value Gap.
- The four-hour chart confirms support.
- The trader enters long.
- Profits are taken at four-hour, daily, weekly and monthly Premium PD Arrays.
The goal is to enter during the retracement and participate in the next expansion swing.
Bearish Classic Swing Trade Example
A bearish Classic Swing Trading Approach may develop as follows:
- The monthly chart shows bearish market structure.
- Price recently moved away from a monthly Premium PD Array.
- The weekly chart is also supporting lower prices.
- The daily chart creates bearish displacement.
- Price forms an impulse decline and an intermediate-term low.
- The market begins retracing.
- The trader maps Premium PD Arrays inside the impulse range.
- Price reaches a four-hour bearish Order Block or Fair Value Gap.
- The four-hour chart confirms resistance.
- The trader enters short.
- Profits are taken at four-hour, daily, weekly and monthly Discount PD Arrays.
The trader is selling the retracement rather than chasing price after the initial decline.
Trade Targets and Scaling Out
The Classic Swing Trading Approach uses opposing PD Arrays as profit objectives.
For bullish trades, the trader scales out at Premium PD Arrays.
For bearish trades, the trader scales out at Discount PD Arrays.
Targets may come from:
- Four-hour PD Arrays
- Daily PD Arrays
- Weekly PD Arrays
- Monthly PD Arrays
- Old highs or lows
- Liquidity pools
- Fair Value Gaps
- Higher-timeframe Order Blocks
The trader should not hold the entire position for the furthest monthly objective.
Instead, profits can be taken progressively as price reaches nearer four-hour, daily and weekly targets.
As price approaches a major monthly or weekly objective, only a small portion of the original position should remain open.
This protects profit if the market retraces or reverses before reaching the final target.
Reward-to-Risk Expectations
The model favors setups with sufficient space between the entry and the opposing PD Array.
The minimum objective is generally around three times the initial risk.
A stronger setup may offer five times the risk or more.
Before entering, the trader should ask:
- How far is the closest opposing PD Array?
- Is there enough room for at least a 3:1 reward-to-risk ratio?
- Are nearby obstacles likely to limit the move?
- Can profits be scaled out at multiple levels?
- Is the higher-timeframe objective realistic?
A technically valid entry may still be avoided when the potential reward is too limited.
Setup Failure Protocol
A failed setup does not automatically invalidate the higher-timeframe bias.
Suppose a trader buys a four-hour Discount PD Array and the trade is stopped out.
The trader should:
- Accept the loss
- Avoid emotional revenge trading
- Identify the next lower-priced Discount PD Array
- Reassess whether the monthly, weekly and daily bias remains bullish
- Use reduced position size on the next attempt
For a bullish setup, the next opportunity may form at a lower four-hour, daily, weekly or monthly Discount PD Array.
For a bearish setup, the next opportunity may form at a higher four-hour, daily, weekly or monthly Premium PD Array.
Huddleston advises traders not to panic after a failed setup and not to attempt to recover the entire loss immediately.
The next trade should normally use approximately 50 percent of the position size used on the previous failed trade.
The objective is disciplined recovery, not forcing the market to repay the loss.
Confirming Institutional Sponsorship
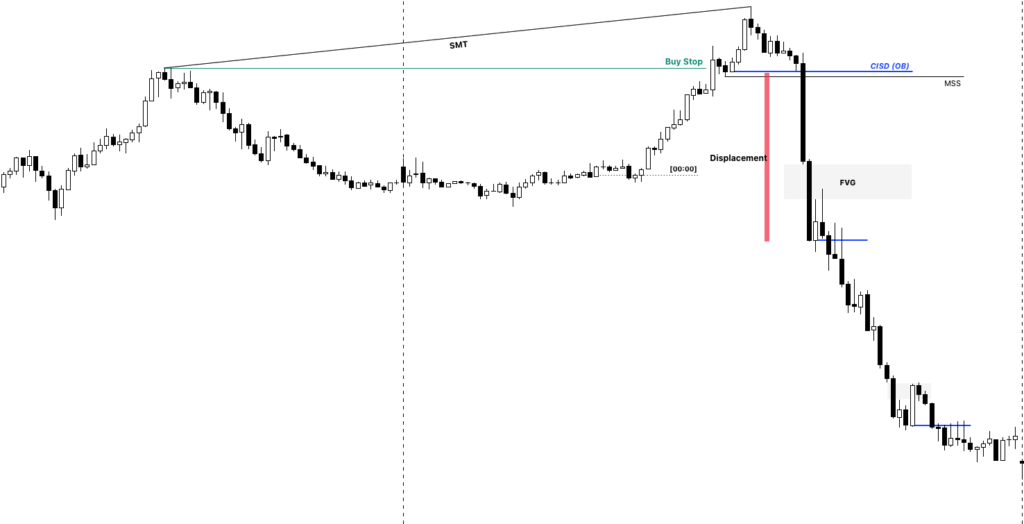
Once a trade begins moving in the expected direction, the trader should monitor how price reacts to opposing PD Arrays.
In a bullish trade:
- Bearish Order Blocks should fail
- Bearish Breakers should give way
- Old highs should be broken
- New Discount PD Arrays should support price
- Retracements should remain controlled
- Price should expand toward higher Premium PD Arrays
In a bearish trade:
- Bullish Order Blocks should fail
- Bullish Breakers should give way
- Old lows should be broken
- New Premium PD Arrays should resist price
- Rallies should remain controlled
- Price should expand toward lower Discount PD Arrays
When opposing arrays repeatedly fail, it suggests that institutional order flow continues to support the trade.
Price Is Fractal
The same impulse, retracement and expansion sequence appears on every timeframe.
A weekly impulse swing may contain:
- A daily impulse
- A daily retracement
- A daily expansion
A daily impulse swing may contain:
- A four-hour impulse
- A four-hour retracement
- A four-hour expansion
This fractal structure allows traders to study the larger move and then refine the entry on a lower timeframe.
The monthly chart provides the broad directional framework.
The weekly chart reveals the larger swing structure.
The daily chart defines the developing setup.
The four-hour chart provides execution.
Classic Swing Trading Approach Checklist
Before taking a trade, confirm the following conditions.
Higher-Timeframe Conditions
- Is the 9-to-18-month profile trending?
- Has price recently left consolidation?
- Is there clear displacement?
- Are monthly and weekly charts aligned?
- Is the daily chart supporting the same direction?
- Is there a clear draw on liquidity?
PD Array Analysis
- Which PD Array caused the recent displacement?
- Is price moving from discount toward premium?
- Is price moving from premium toward discount?
- Have monthly levels been transferred to the weekly chart?
- Have weekly levels been transferred to the daily chart?
- Have daily levels been transferred to the four-hour chart?
Entry Conditions
- Has an impulse swing formed?
- Is price currently retracing?
- Is the entry located inside premium or discount?
- Is there an active four-hour PD Array?
- Does the entry agree with the higher-timeframe direction?
- Is the invalidation point clearly defined?
Trade Management
- Is at least a 3:1 reward-to-risk ratio available?
- Are the four-hour, daily, weekly and monthly targets marked?
- Can profits be scaled out progressively?
- Will only a small portion remain near the final target?
- Is the position size appropriate?
Failure Management
- Is there another PD Array available if the first setup fails?
- Does the higher-timeframe bias remain valid?
- Will the next attempt use reduced risk?
- Can the loss be accepted without revenge trading?
- Is price still confirming institutional sponsorship?
Final Thoughts
The Classic Swing Trading Approach is a structured method for participating in large directional market moves.
The model begins with higher-timeframe analysis, not a lower-timeframe entry signal. The trader determines whether price is moving from Premium toward Discount or from Discount toward Premium. Monthly, weekly and daily PD Arrays are then mapped and transferred to the four-hour chart.
The trader waits for an impulse move, allows price to retrace, and then enters from a favorable PD Array in the direction of the larger market flow.
The central sequence is simple:
Higher-timeframe condition
Displacement
Impulse swing
Retracement
Premium or Discount entry
Expansion toward the opposing PD Array
The strength of the ICT Classic Swing Trading Approach comes from patience and alignment. Instead of reacting to every market movement, the trader waits until price reaches a predefined level where the higher-timeframe direction, institutional order flow and four-hour execution model support the same idea.