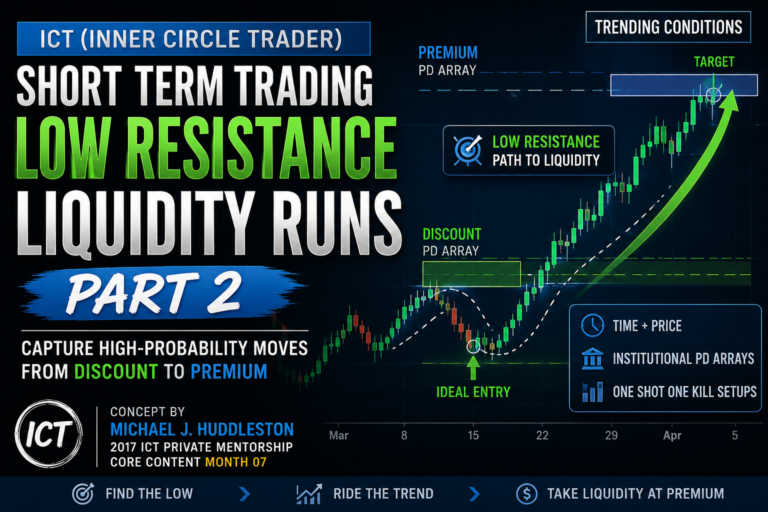
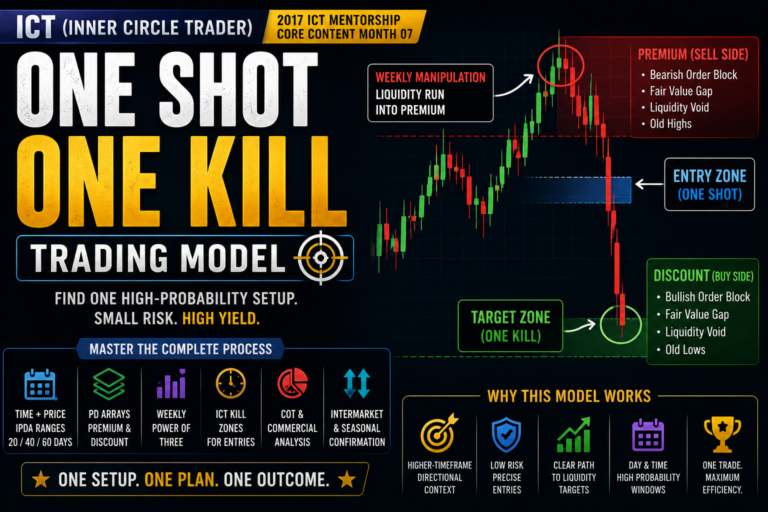
Short Term Trading Using Monthly & Weekly Ranges is a top-down trading approach taught by Michael J. Huddleston, founder of the ICT (Inner Circle Trader) concepts. This framework is covered in the 2017 ICT Private Mentorship Core Content – Month 07 as part of the short-term trading and One Shot One Kill model.
The purpose of this approach is to determine where price is likely to move during the current or upcoming week. Instead of reacting to every lower-timeframe price movement, the trader uses the monthly chart to establish direction, the weekly chart to define the expected range, and the lower timeframes to locate an entry.
As Michael J. Huddleston explains:
“The weekly range is going to be the backbone to your success in short-term trading.”
What Is Short-Term Trading?
Short-term trading focuses on positions that may remain open for a few days or approximately one trading week.
It is different from day trading because the position does not necessarily close before the end of the trading session. It is also different from swing or position trading because the trader is usually targeting a specific portion of the weekly range rather than a much larger multiweek move.
The objective is to identify:
- The likely direction of the monthly range
- The probable direction of the current weekly range
- The higher-timeframe PD Array price is moving from
- The opposing PD Array price may be drawn toward
- A lower-timeframe setup that offers controlled risk
A short-term trade can form in a trending market or a range-bound market. However, the setup should be clear and supported by higher-timeframe context.
Michael J. Huddleston advises traders not to force unclear opportunities:
“If it’s not obvious, it’s simply just not clear enough on your charts.”
The Monthly Chart Establishes the Main Context
The monthly chart provides the broad directional framework.
The trader begins by marking:
- The monthly candle high
- The monthly candle low
- Monthly premium and discount
- Important monthly PD Arrays
- The most likely draw on liquidity
- The probable direction of the monthly range
A monthly candle normally contains approximately four weekly candles. Therefore, the weekly candles are responsible for building the larger monthly range.
The trader must determine whether price is moving away from a monthly premium PD Array or a monthly discount PD Array.
When price is reacting from a monthly premium PD Array, the market may be positioned to trade lower.
When price is reacting from a monthly discount PD Array, the market may be positioned to trade higher.
The monthly chart does not necessarily provide the entry. Its main purpose is to establish the larger directional narrative.
The Weekly Chart Defines the Trading Range
After establishing the monthly context, the trader moves to the weekly chart.
The weekly chart is used to identify:
- The weekly high and low
- Weekly premium and discount
- The current weekly dealing range
- Opposing weekly PD Arrays
- The likely weekly draw on liquidity
- The area where the short-term trade may terminate
A weekly candle normally contains five daily candles. These daily candles create the internal movement of the weekly range.
When the monthly chart suggests higher prices, the trader searches for a weekly premium PD Array as a potential target.
When the monthly chart suggests lower prices, the trader searches for a weekly discount PD Array as a potential target.
The distance between the monthly point of origin and the opposing weekly PD Array becomes the broader range in which short-term setups may form.
Moving From Monthly PD Arrays to Weekly PD Arrays
The core principle is that price frequently moves from one higher-timeframe PD Array toward an opposing PD Array on a lower timeframe.
Bearish Framework
In a bearish market, the trader looks for:
- Price reacting from a monthly premium PD Array
- A bearish monthly narrative
- An opposing weekly discount PD Array below price
- Weekly, daily or four-hour premium PD Arrays for possible short entries
- A one-hour bearish setup for execution
The weekly discount PD Array becomes the larger objective.
Possible weekly discount targets include:
- Bullish order blocks
- Bullish breaker blocks
- Bullish mitigation blocks
- Fair value gaps
- Liquidity voids
- Rejection blocks
- Old lows
- Previous support levels
The trader does not need every type of PD Array to be present. The goal is to identify the most logical active target below price.
Bullish Framework
In a bullish market, the process is reversed.
The trader looks for:
- Price reacting from a monthly discount PD Array
- A bullish monthly narrative
- An opposing weekly premium PD Array above price
- Weekly, daily or four-hour discount PD Arrays for possible long entries
- A one-hour bullish setup for execution
The weekly premium PD Array becomes the larger objective.
Possible weekly premium targets include:
- Bearish order blocks
- Bearish breaker blocks
- Bearish mitigation blocks
- Fair value gaps
- Rejection blocks
- Old highs
- Previous resistance levels
- Buy-side liquidity
This creates a clear structure: trade away from the monthly PD Array and toward the opposing weekly PD Array.
The Higher-Timeframe Sequence
ICT short-term trading uses a top-down sequence.
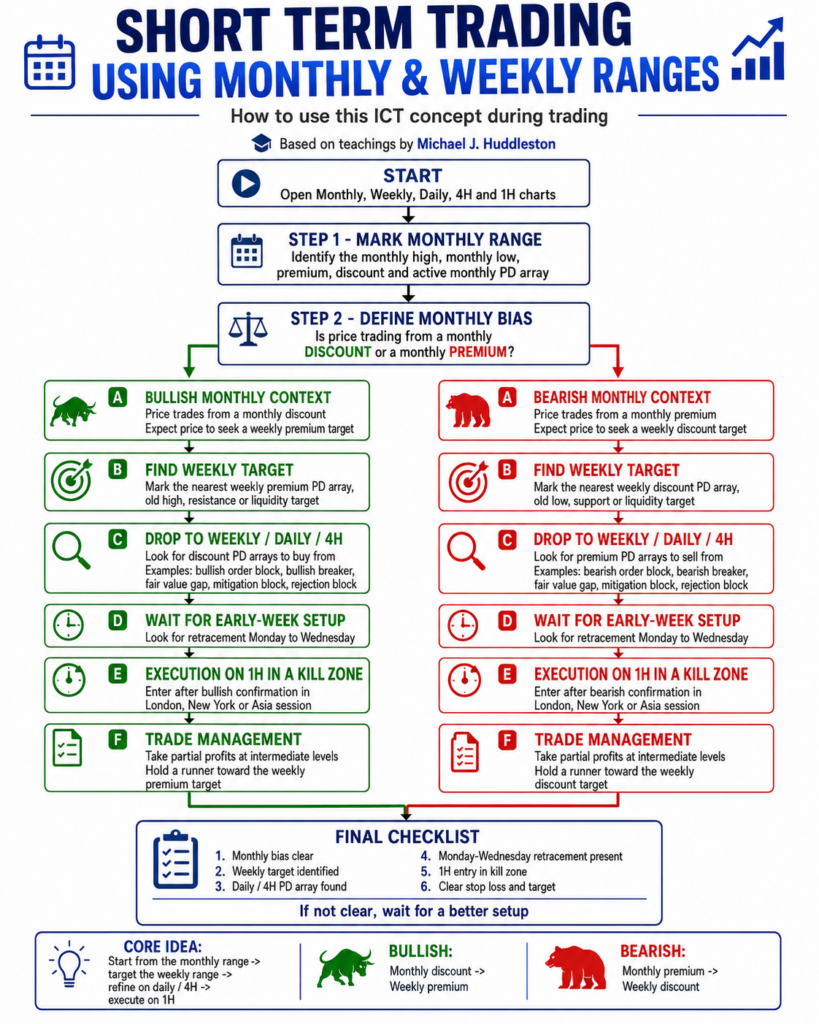
For a bearish setup:
Monthly premium → Weekly discount target → Lower-timeframe premium entry → One-hour execution
For a bullish setup:
Monthly discount → Weekly premium target → Lower-timeframe discount entry → One-hour execution
The monthly chart provides direction.
The weekly chart provides the expected destination.
The daily and four-hour charts provide potential setup locations.
The one-hour chart becomes the main executable timeframe for the One Shot One Kill model.
This prevents the trader from using the one-hour chart without understanding the higher-timeframe objective.
Using Daily and Four-Hour PD Arrays
Once the monthly and weekly ranges are defined, the trader studies the daily and four-hour charts.
These timeframes help refine the entry location.
In a bullish environment, the trader searches for discount PD Arrays such as:
- Bullish order blocks
- Bullish breakers
- Bullish mitigation blocks
- Fair value gaps below price
- Rejection blocks
- Old lows
- Previous resistance acting as support
In a bearish environment, the trader searches for premium PD Arrays such as:
- Bearish order blocks
- Bearish breakers
- Bearish mitigation blocks
- Fair value gaps above price
- Rejection blocks
- Old highs
- Previous support acting as resistance
The lower-timeframe PD Array should agree with the monthly direction and offer an entry toward the weekly target.
The Role of Monday, Tuesday and Wednesday
The early part of the week is important in ICT short-term trading.
Monday, Tuesday and Wednesday commonly provide the retracement or setup that prepares price for the weekly expansion.
In a bullish market, price may:
- Rally initially
- Retrace into a discount PD Array
- Form the weekly low between Monday and Wednesday
- Expand toward the weekly premium objective
In a bearish market, price may:
- Decline initially
- Retrace into a premium PD Array
- Form the weekly high between Monday and Wednesday
- Expand toward the weekly discount objective
The trader should not assume that the weekly high or low must form on a specific day. The purpose of the Monday-to-Wednesday filter is to focus attention on the part of the week where the short-term setup commonly develops.
Monday-to-Wednesday Range Breakout Confirmation
One important confirmation comes from observing the price range created between Monday and Wednesday.
In a bullish market, identify the highest price formed during the Monday-to-Wednesday range.
When that high is broken later in the week, it can confirm that the market is expanding in a bullish delivery toward the higher-timeframe premium objective.
In a bearish market, identify the lowest price formed during the Monday-to-Wednesday range.
When that low is broken later in the week, it can confirm that the market is expanding in a bearish delivery toward the higher-timeframe discount objective.
This does not guarantee that the target will be reached immediately. However, it can confirm that price is operating within the anticipated buy or sell program.
Entry Timing During ICT Kill Zones
The PD Array identifies the location, but the ICT Kill Zone helps refine the timing.
A bullish setup should retrace into a discount PD Array during an active trading session.
A bearish setup should retrace into a premium PD Array during an active trading session.
Depending on the market, the trader may focus on:
- Asian Kill Zone
- London Open Kill Zone
- New York Open Kill Zone
The Kill Zone should not be used independently. It becomes useful when price is already trading inside a valid higher-timeframe PD Array and the monthly and weekly narratives agree.
Managing the Weekly Objective
The full weekly target may be several hundred pips away from the entry.
The trader does not need to hold the complete position until the final target. Partial profits can be taken at intermediate objectives while a smaller portion remains open for the weekly PD Array.
Possible intermediate objectives include:
- Previous daily highs or lows
- Short-term liquidity pools
- Internal fair value gaps
- Daily PD Arrays
- Four-hour PD Arrays
- Consequent Encroachment levels
The final portion of the position can be held for the broader weekly objective when market conditions continue to support the original analysis.
This approach allows the trader to secure profit while still participating in a larger weekly expansion.
Additional Forms of Confirmation
Higher-timeframe PD Arrays and price action remain the foundation of the model. However, additional confirmation may strengthen the setup.
These supporting factors can include:
- Seasonal tendencies
- Interest-rate conditions
- Bond-market movement
- Commitment of Traders data
- Intermarket analysis
- SMT divergence
- Correlated market confirmation
These elements are not always required. They should support the existing monthly and weekly narrative rather than replace it.
Short-Term Trading Checklist
Before entering a trade, ask:
- What is the current monthly dealing range?
- Is price trading from monthly premium or discount?
- Where is the most logical opposing weekly PD Array?
- Is the weekly range likely to expand higher or lower?
- Which daily or four-hour PD Array can provide an entry?
- Does the setup agree with the monthly direction?
- Is the entry forming between Monday and Wednesday?
- Is price trading during a relevant ICT Kill Zone?
- Is there a clear one-hour execution model?
- Where are the intermediate and final objectives?
- Where is the trade invalidated?
- Is the setup obvious, or am I forcing it?
When these questions cannot be answered clearly, waiting is usually the better decision.
Common Mistakes
Starting From the One-Hour Chart
The one-hour chart is used for execution, not for establishing the entire market narrative.
Without monthly and weekly context, the trader may enter directly against the higher-timeframe draw.
Targeting Random Amounts
A trader should not automatically aim for a fixed number of pips.
The target should come from an opposing PD Array, liquidity level or clearly defined range objective.
Forcing a Weekly Trade
Short-term setups may appear regularly, but not every market offers a clear opportunity every week.
The trader should wait until price reaches a valid PD Array.
Ignoring the Opposing PD Array
Knowing the directional bias is not enough.
The trader must also identify where price is likely to move. The opposing weekly PD Array provides that destination.
Using Kill Zones Without Context
A Kill Zone is not an entry signal by itself.
The trade still requires higher-timeframe direction, a valid PD Array and an appropriate liquidity objective.
Final Thoughts
Short Term Trading Using Monthly & Weekly Ranges provides a structured way to trade the weekly price movement without reacting to every intraday fluctuation.
The monthly chart establishes the larger directional context. The weekly chart defines the probable range and objective. The daily and four-hour charts reveal potential entry locations, while the one-hour chart provides execution.
The essential process is simple:
Identify the monthly point of origin, locate the opposing weekly PD Array, wait for an early-week retracement, and execute from a lower-timeframe PD Array in the direction of the expected weekly expansion.
The strength of this ICT model comes from patience. The trader is not trying to predict every candle. The objective is to wait for price to reach a meaningful location, confirm the expected direction and participate in the clearest portion of the weekly range.