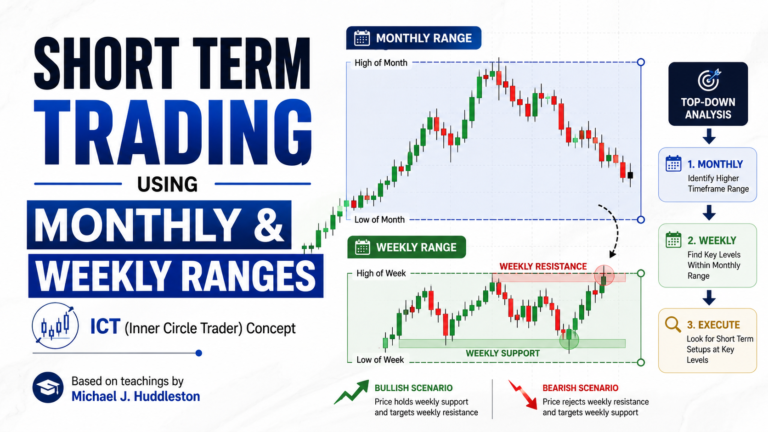
Short Term Trading Market Maker Manipulation Templates are a collection of weekly price-delivery models taught by Michael J. Huddleston, the founder of the ICT methodology. This concept is covered in the 2017 ICT Private Mentorship Core Content Month 07.
These templates help traders understand how the weekly range may form through liquidity raids, false breakouts, premium and discount pricing, and movement toward higher-timeframe objectives.
Instead of reacting to every short-term price movement, an ICT inner circle trader can compare the developing week with a known manipulation template. This provides a clearer framework for anticipating where the weekly high or low may form and where price may move before Friday’s close.
As Michael J. Huddleston explains:
“You’re looking for one setup to pay you your weekly objective.”
What Are Market Maker Manipulation Templates?
Market Maker Manipulation Templates describe recurring ways in which price can form its weekly range.
The templates combine three important elements:
- Higher-timeframe directional bias
- Weekly range profile
- Liquidity manipulation within that profile
The trader first determines whether the market is primarily bullish or bearish. After establishing the bias, the trader watches how price behaves from Monday through Wednesday.
The objective is not to predict every candle. The objective is to identify the developing weekly structure and anticipate the probable expansion into Thursday or Friday.
The Basic Logic Behind the Templates
Most manipulation templates follow a similar sequence.
- Price creates an early-week range.
- Liquidity forms above or below that range.
- Price moves against the expected weekly direction.
- Stops are taken or a higher-timeframe PD Array is reached.
- Price reverses and expands toward the real weekly objective.
In a bullish week, the manipulation normally occurs below an early-week low.
In a bearish week, the manipulation normally occurs above an early-week high.
This is why the apparent breakout is not always the genuine directional move. It may simply be the liquidity event required before the larger expansion begins.
Classic Tuesday Low of the Week
The Classic Tuesday Low of the Week is a bullish manipulation template.
Price may open the week with limited movement or trade slightly higher on Monday. On Tuesday, the market moves lower into a discount area and forms the probable weekly low.
The Tuesday decline may target:
- Sell-side liquidity below an old low
- A monthly, weekly or daily bullish Order Block
- A previously broken high acting as support
- A discount Fair Value Gap
- A liquidity void
- A higher-timeframe discount PD Array
After reaching the discount area, price is expected to rally during the remainder of the week.
The weekly high will commonly form during Thursday’s New York session, although the expansion may continue into Friday.

Bullish Target Selection
The profit objective should normally be based on a lower timeframe than the level used for entry.
For example:
- Entry from a weekly bullish Order Block
- Target at a daily or four-hour premium PD Array
The target may also align with:
- A 1.27 Fibonacci extension
- A 1.68 Fibonacci extension
- A 100 percent symmetrical price projection
- Buy-side liquidity above an old high
The strongest target is usually where a premium PD Array overlaps with a price projection.
Classic Tuesday High of the Week
The Classic Tuesday High of the Week is the bearish version of the previous template.
The market begins the week by moving higher. On Tuesday, price reaches a premium area and forms the probable weekly high.
The Tuesday rally may run into:
- Buy-side liquidity above an old high
- A monthly, weekly or daily bearish Order Block
- A previously broken low acting as resistance
- A premium Fair Value Gap
- A liquidity void
- A higher-timeframe premium PD Array
After the premium objective is reached, price is expected to decline through Wednesday and Thursday, potentially continuing into Friday.
Bearish Target Selection
The trader should target a lower-timeframe discount PD Array.
For example:
- Entry from a daily bearish Order Block
- Target at a four-hour discount Fair Value Gap
The discount target may overlap with a 1.27 extension, 1.68 extension or equal measured move.
Wednesday Low of the Week
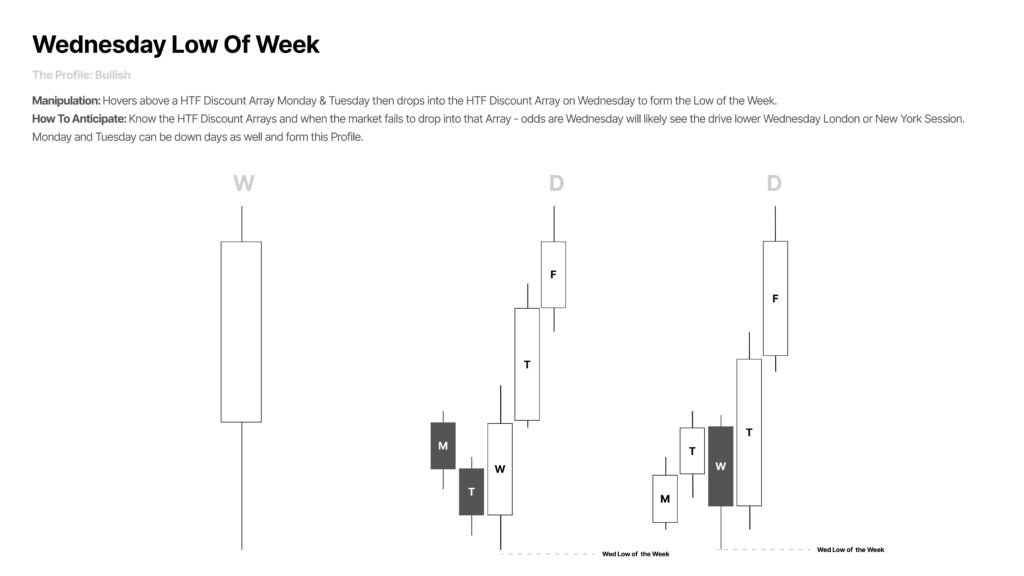
The Wednesday Low of the Week is another bullish template.
In this model, Monday may form a short-term low before price trades higher into Tuesday. Price then reverses lower and continues into Wednesday.
The Wednesday decline runs sell-side liquidity or reaches a higher-timeframe discount PD Array.
Possible entry locations include:
- An old monthly, weekly or daily low
- A previously broken high
- A bullish Order Block
- A discount Fair Value Gap
- A liquidity void
- A first swing-grade entry
- The equilibrium of a larger price move
- A third swing-grade entry
Once the Wednesday low forms, price may expand higher through Thursday and Friday.
This model is useful when the trader has a bullish higher-timeframe bias but the weekly low did not form on Tuesday.
Wednesday High of the Week
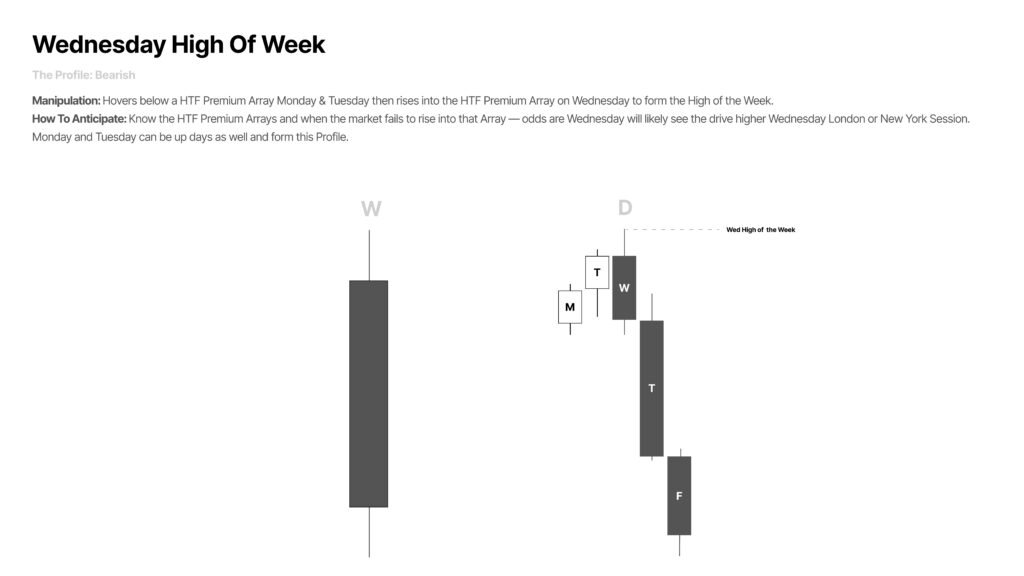
The Wednesday High of the Week develops in a bearish market.
Monday and Tuesday may create a temporary range or short-term rally. Price then moves above an old high or another premium reference point on Wednesday.
This move can take buy-side liquidity before the bearish weekly expansion begins.
The premium area may contain:
- An old monthly, weekly or daily high
- A retest of a previously broken low
- A bearish Order Block
- A premium Fair Value Gap
- A liquidity void
- A higher-timeframe premium PD Array
After the manipulation, price is expected to trade lower into Thursday or Friday.
A weekly or daily discount PD Array can be used as the objective, particularly when it overlaps with a Fibonacci extension or symmetrical price projection.
Consolidation Thursday Reversal
The Consolidation Thursday Reversal occurs when price remains in a relatively narrow range during the first half of the week.
Monday, Tuesday and part of Wednesday may show limited directional movement. Liquidity builds above and below the consolidation.
A significant economic event on Thursday can then create the manipulation.
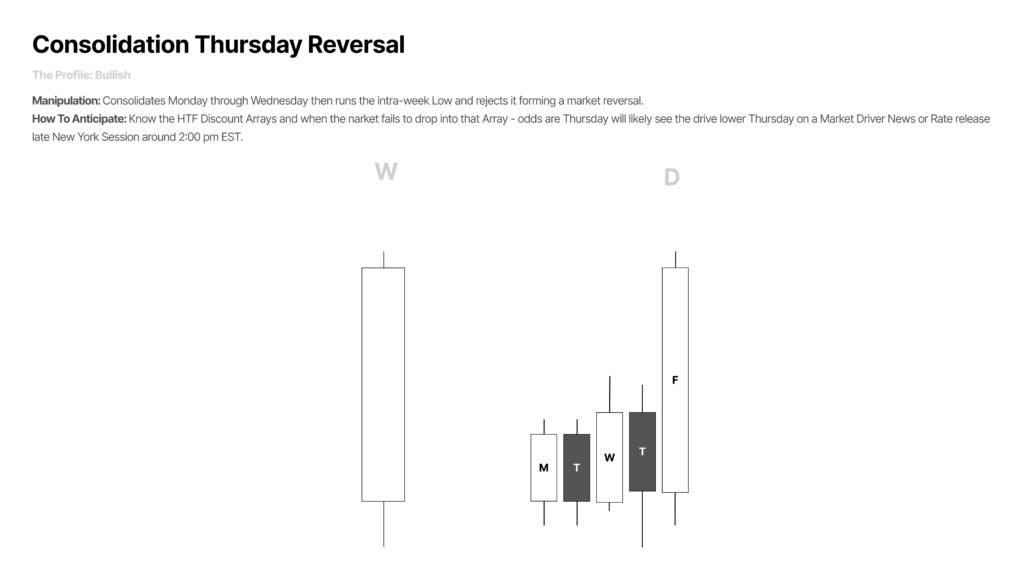
Bullish Thursday Reversal
In a bullish market, price may run below the Monday or Tuesday lows.
This takes sell-side liquidity and creates a false bearish breakout. The market then reverses and targets buy-side liquidity above the intraweek highs.
The pattern may be associated with:
- Employment data
- Interest-rate announcements
- FOMC-related volatility
- Other high-impact economic releases
This setup resembles a Turtle Soup long, where price briefly trades below an established low before reversing higher.
Bearish Thursday Reversal
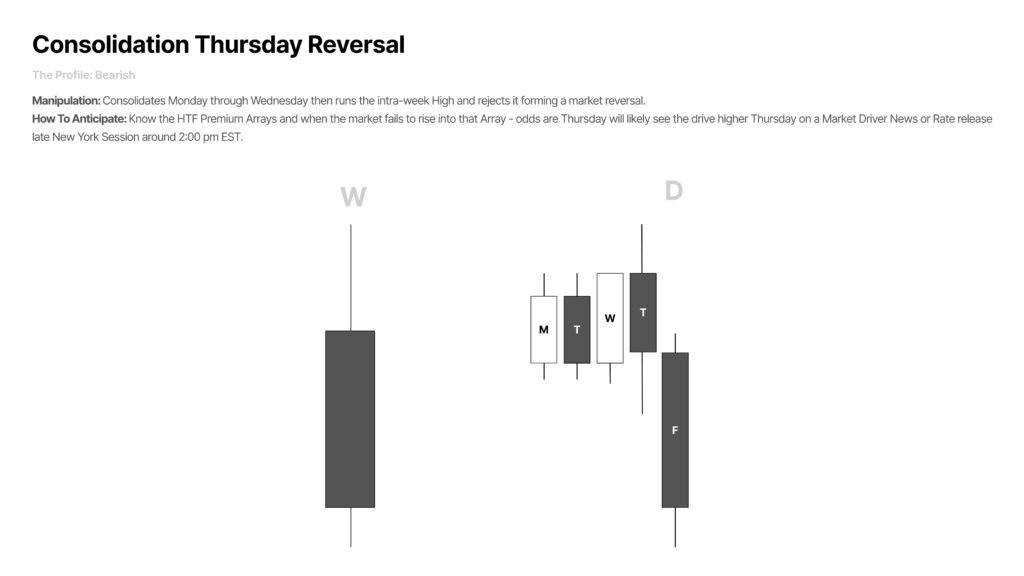
In a bearish market, price may trade above the early-week highs.
The move takes buy-side liquidity and creates a false bullish breakout. Price then reverses lower and targets sell-side liquidity below the intraweek range.
This resembles a Turtle Soup short.
Trading directly during major announcements carries substantial risk. The initial movement can be volatile, spreads may widen, and price can move through a stop before reversing.
Consolidation Midweek Rally
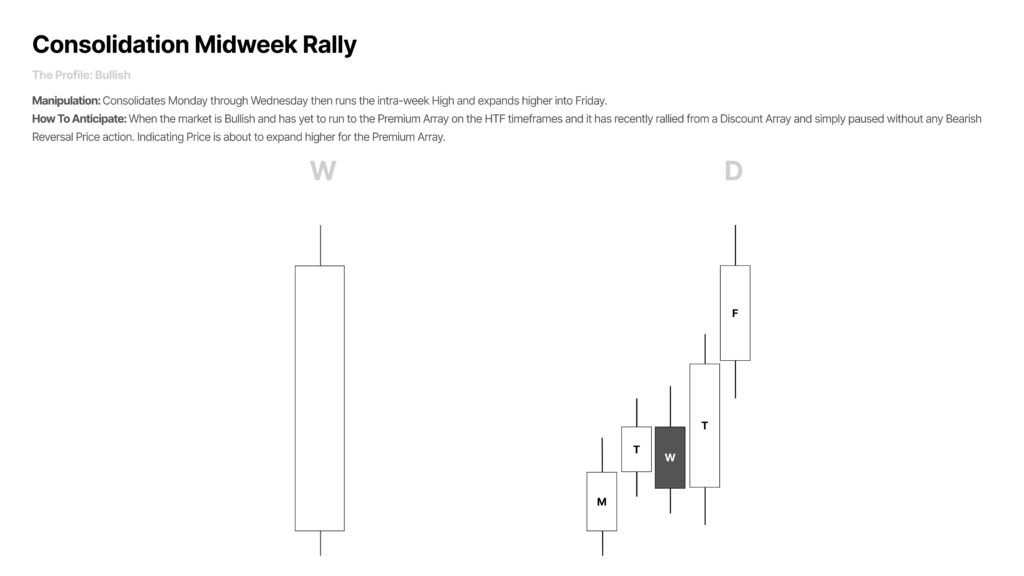
The Consolidation Midweek Rally is a bullish profile.
Price initially trades higher on Monday or Tuesday, creating a short-term high. The market then retraces into Wednesday.
The retracement should reach a discount PD Array, such as:
- A bullish Order Block
- A Fair Value Gap
- A liquidity void
- A discount higher-timeframe level
The trader uses the early-week high as the swing projection fulcrum.
The price range between the early-week high and the Wednesday low can be projected upward. The preferred objective is where a 1.27 or 1.68 extension overlaps with a premium PD Array.
A high- or medium-impact news event during the Wednesday London or New York session may act as the catalyst for the rally.
Consolidation Midweek Decline
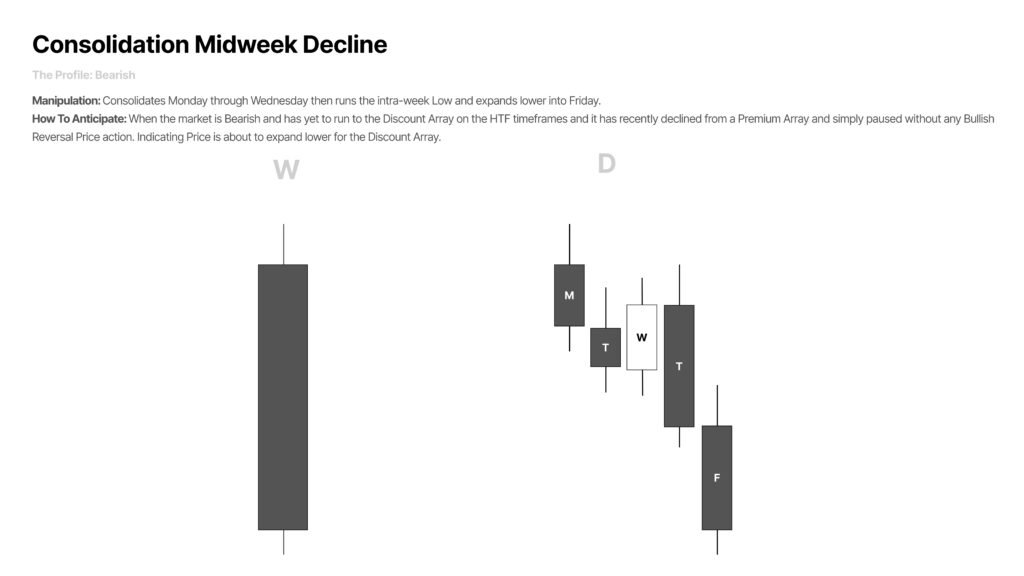
The Consolidation Midweek Decline is the bearish version of the midweek rally.
Price forms an early-week low and then retraces higher into Wednesday.
The Wednesday rally should reach a premium PD Array, such as:
- A bearish Order Block
- A premium Fair Value Gap
- A liquidity void
- A previously broken support level
- A higher-timeframe premium level
The range between the early-week low and Wednesday high is then projected downward.
The objective should be a discount PD Array that overlaps with a 1.27 extension, 1.68 extension or symmetrical measured move.
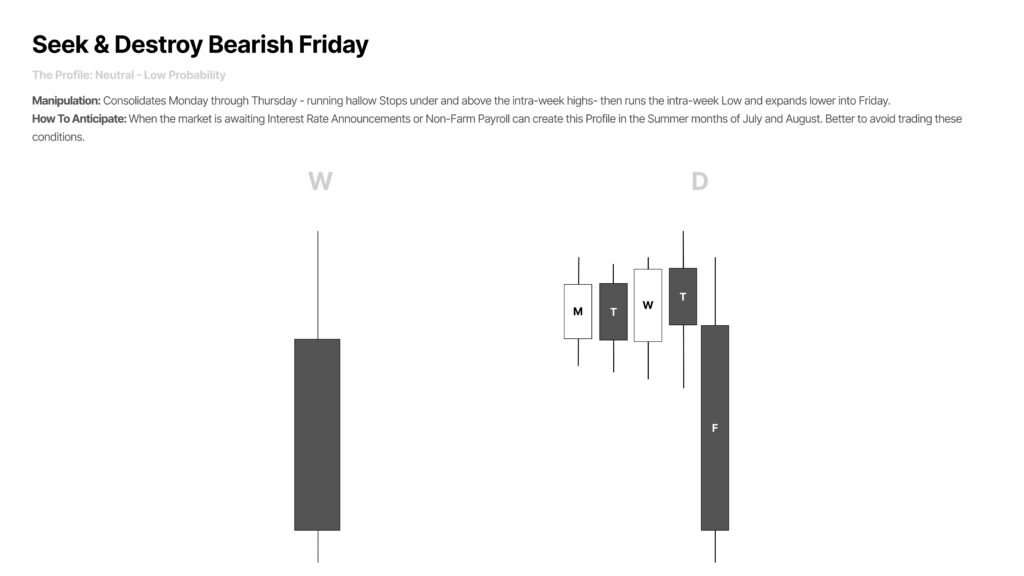
Seek and Destroy Friday
The Seek and Destroy Friday template develops when the market remains indecisive for most of the week.
Price may repeatedly trade above and below short-term highs and lows. Both buy-side and sell-side liquidity are taken without producing a clear directional expansion.
This is considered a neutral or lower-probability environment.
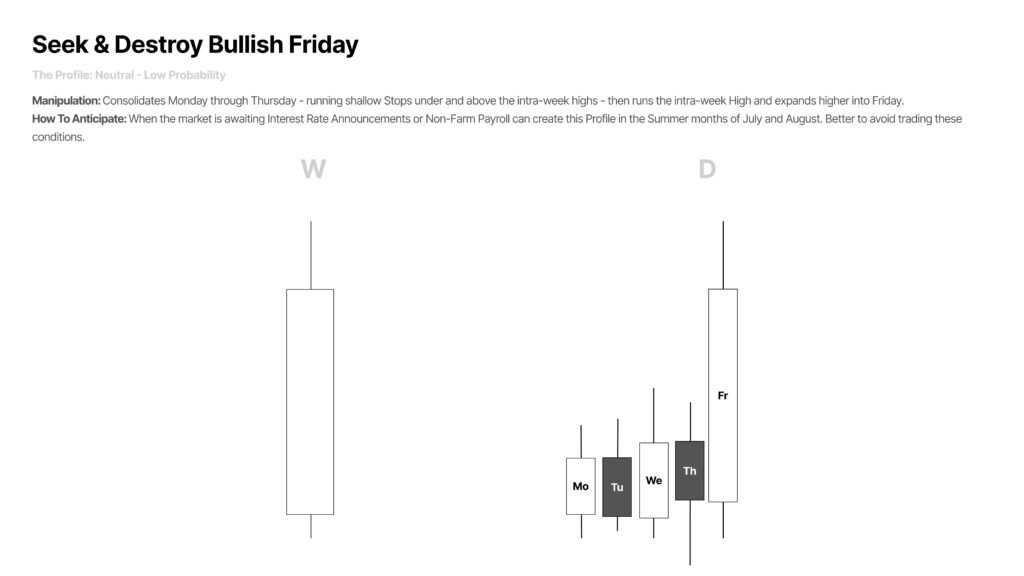
Bullish Seek and Destroy Friday
Price may consolidate from Monday through Thursday before running below the intraweek lows.
After taking sell-side liquidity, the market expands aggressively toward a daily or weekly premium PD Array.
Bearish Seek and Destroy Friday
Price consolidates during the first half of the week before trading above the intraweek highs.
After taking buy-side liquidity, the market declines toward a daily or weekly discount PD Array.
This template is generally more useful for anticipating a potential reversal from the final higher-timeframe objective than for trading the manipulation itself.
When both sides of the range are being repeatedly taken, remaining on the sidelines may be the better decision.
Wednesday Weekly Reversal
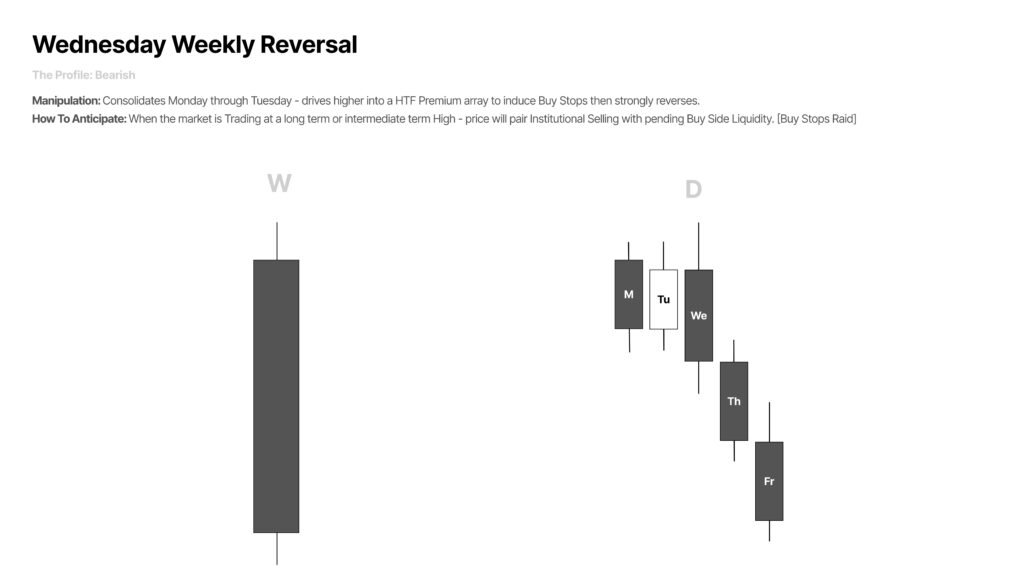
The Wednesday Weekly Reversal involves a significant higher-timeframe support or resistance level.
It is different from a normal Wednesday high or low because the manipulation is usually built around a more important monthly, weekly or daily reference point.
Bullish Wednesday Weekly Reversal
Price trades below an old low or retail support level during a high- or medium-impact news event.
The decline reaches:
- A monthly, weekly or daily discount PD Array
- A 1.27 or 1.68 downside extension
- Sell-side liquidity below a major low
The market then rejects the lower price and begins expanding toward a weekly or daily premium PD Array.

Bearish Wednesday Weekly Reversal
Price trades above an old high or retail resistance level.
The rally reaches:
- A monthly, weekly or daily premium PD Array
- A 1.27 or 1.68 upside extension
- Buy-side liquidity above a major high
After rejecting the premium level, price expands toward a weekly or daily discount PD Array.
Using Higher and Lower Timeframes
Timeframe selection is an important part of Short Term Trading Market Maker Manipulation Templates.
The higher timeframe establishes the location and directional framework. The lower timeframe helps refine the target and, in some cases, the entry.
A general rule is to target a PD Array on a timeframe lower than the timeframe used to define the entry level.
Examples include:
- Monthly entry level with weekly, daily or four-hour target
- Weekly entry level with daily or four-hour target
- Daily entry level with four-hour target
- Four-hour entry level with one-hour or lower target
This prevents the trader from holding for an objective that may require several weeks to develop.
How to Apply the Templates
Start by establishing the higher-timeframe bias.
Determine whether price is more likely to seek a premium objective or a discount objective.
Next, mark:
- Previous monthly highs and lows
- Previous weekly highs and lows
- Previous daily highs and lows
- Higher-timeframe Order Blocks
- Fair Value Gaps
- Liquidity voids
- Premium and discount zones
- Buy-side and sell-side liquidity
Observe how price trades during Monday, Tuesday and Wednesday.
Look for the template that most closely matches the developing weekly structure.
Do not force a template onto unclear price action. The characteristics should be reasonably obvious.
Practical Trading Checklist
Before using a manipulation template, confirm the following:
- Is the higher-timeframe bias bullish or bearish?
- Is price trading in premium or discount?
- Where are the important monthly, weekly and daily PD Arrays?
- Where is buy-side liquidity located?
- Where is sell-side liquidity located?
- Did Tuesday or Wednesday form a probable weekly high or low?
- Has price raided an old high or low?
- Is the manipulation moving against the expected weekly direction?
- Is there a Fair Value Gap, Order Block or liquidity void at the reversal area?
- Does the target overlap with a 1.27 or 1.68 extension?
- Is the target based on a lower timeframe than the entry level?
- Is high-impact news likely to create the liquidity event?
- Is there enough range remaining for a reasonable trade objective?
- Are the template characteristics clear enough to justify a trade?
Common Mistakes
Trading Without a Higher-Timeframe Bias
A manipulation template should not be selected before determining whether the market is bullish or bearish.
Without directional bias, the trader may incorrectly interpret a genuine breakout as manipulation.
Assuming Every Tuesday Forms the Weekly Extreme
Tuesday frequently forms an important weekly high or low, but not every week follows the Tuesday template.
The extreme may form on Wednesday or after a Thursday liquidity event.
Using Fibonacci Extensions Alone
A 1.27 or 1.68 extension should not automatically be treated as a target.
The extension should ideally overlap with:
- A premium or discount PD Array
- Liquidity
- A higher-timeframe reference point
- A lower-timeframe opposing array
Forcing a Trade During Consolidation
When price repeatedly takes both buy-side and sell-side liquidity, the weekly profile may be unclear.
This can indicate a Seek and Destroy environment, where avoiding the trade is often more appropriate.
Trying to Catch the Exact Weekly High or Low
The trader does not need to enter at the exact weekly extreme.
Once the range and manipulation characteristics become clear, an entry during the latter half of the weekly move may still provide the required objective.
Final Thoughts
Short Term Trading Market Maker Manipulation Templates provide a structured way to study weekly price delivery.
The method begins with higher-timeframe bias and then examines how liquidity is manipulated during the first half of the week.
Tuesday and Wednesday are especially important because they frequently reveal the probable weekly high or low. Thursday and Friday commonly deliver the expansion toward the opposing liquidity pool or PD Array.
The trader’s responsibility is not to predict every weekly candle. It is to identify whether price is following a recognizable bullish or bearish template, wait for the manipulation to occur and seek one well-defined setup that can satisfy the weekly trading objective.
The templates become easier to recognize through chart study. Reviewing several months of one-hour charts and classifying each weekly range can help traders understand how these ICT profiles repeatedly appear across different market conditions.