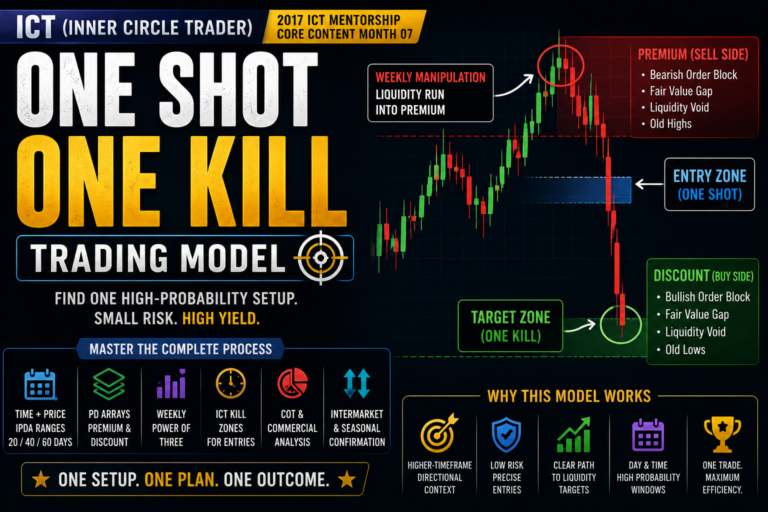
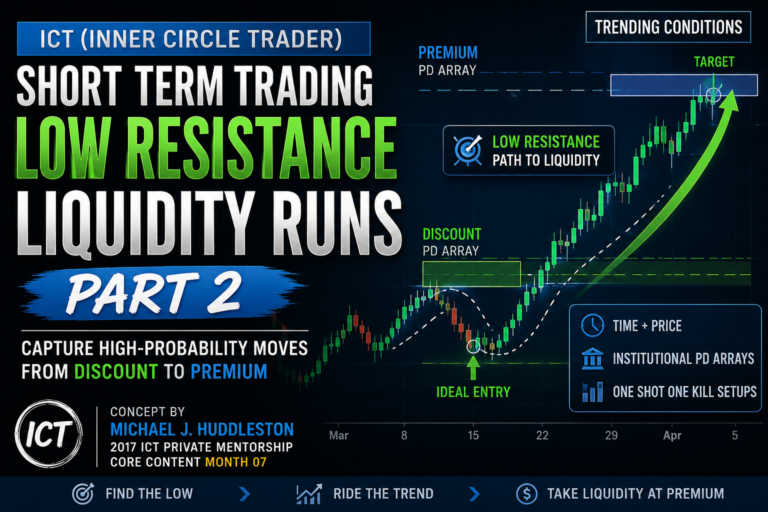
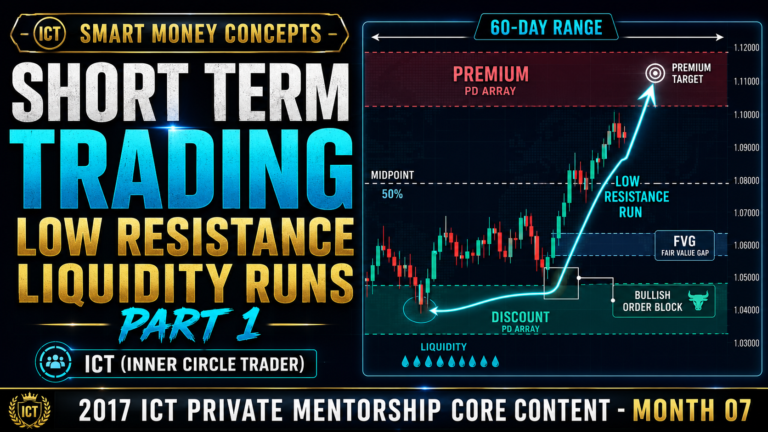
Intraweek Market Reversals & Overlapping Models is an ICT framework for recognizing when a market may abruptly reverse during the trading week, even after an initially strong move appears to confirm the expected direction. This concept was taught by Michael J. Huddleston, founder of ICT or Inner Circle Trader, in the 2017 ICT Private Mentorship Core Content Month 07.
The model focuses on the relationship between time, price, higher-time-frame PD Arrays and overlapping trading disciplines. A trader may begin the week with a valid bearish or bullish expectation, but price can reach an important institutional level early in the week and completely reverse its direction.
Michael J. Huddleston summarizes the most important clue:
“The classic telltale signs are the magnitude at which the price moves on Monday and Tuesday.”
The speed and distance of the early-week move can warn that price is rushing toward a higher-time-frame valuation point rather than beginning a sustained weekly trend.
What Is an Intraweek Market Reversal?
An intraweek market reversal occurs when price moves strongly in one direction during the early part of the week and then reverses before the week ends.
For example, price may decline aggressively on Monday and Tuesday, creating the appearance of a bearish weekly profile.
However, the decline may terminate at a daily bullish PD Array on Wednesday. Price then reverses and trades higher through Thursday and Friday.
The same idea applies in reverse.
Price may rally strongly early in the week, reach a daily or weekly bearish PD Array and then reverse lower.
The reversal usually surprises traders who focus only on the immediate short-term move.
Why Intraweek Reversals Catch Traders Off Guard
A strong early-week move often creates confidence.
A trader may already be profitable and expect price to continue in the same direction for the rest of the week.
When price begins reversing, the trader may assume the reversal is temporary.
This often leads to:
- Holding a trade after the original narrative has failed
- Ignoring a higher-time-frame PD Array
- Expecting another equal price leg
- Refusing to reduce exposure
- Allowing a profitable trade to become a loss
The problem is not always the original directional bias.
The problem is failing to recognize that price has completed its short-term objective and entered an opposing higher-time-frame model.
The Main Warning Sign: Speed and Magnitude
The first warning sign is an unusually large move on Monday or Tuesday.
Price should not only move quickly. It should also cover significantly more distance than normal.
Compare the early-week move with the previous several daily ranges.
If Monday or Tuesday trades far beyond the recent average daily range, traders should consider whether price is rapidly reaching for an institutional reference point.
A large early-week candle may indicate that:
- The weekly range is forming unusually early
- Price is moving toward a daily, weekly or monthly PD Array
- The current directional move is close to completion
- A Wednesday or Thursday reversal may develop
Speed alone is not enough.
The move must also have meaningful magnitude.
A fast but small movement does not carry the same information as a large directional expansion covering a substantial portion of the weekly range.
Price in a Hurry Is Seeking a Valuation Point
When price moves aggressively, traders often assume that momentum will continue.
ICT treats this differently.
A fast move can indicate that the market is in a hurry to reach a specific valuation point.
That valuation point may be:
- A daily bullish or bearish order block
- An order block mean threshold
- A fair value gap
- A mitigation block
- A rejection block
- An old high or low
- A weekly or monthly PD Array
Once price reaches the higher-time-frame objective, institutional order flow may enter from the opposite direction.
The aggressive move into the level may therefore become the final phase of the current move rather than the beginning of a larger continuation.
Higher-Time-Frame PD Arrays Are Essential
Monthly, weekly and daily PD Arrays provide the most important context for intraweek reversal analysis.
A trader may see a bearish move on the one-hour chart, but price may be approaching a daily bullish order block.
The lower-time-frame bearish structure can remain valid temporarily.
However, once price reaches the daily discount array, the higher-time-frame bullish model can take control.
The opposite is also true.
A lower-time-frame bullish move can fail when price reaches a daily or weekly premium PD Array.
This is why the trader must know where price is located inside the broader dealing range.
Premium and Discount Context
A market can remain inside the premium portion of a larger range while creating smaller discount ranges internally.
This can initially appear confusing.
Suppose price is positioned in the premium half of a large daily range.
Within that premium area, price declines sharply into the discount portion of a smaller short-term range.
The short-term discount PD Array may support a bullish reversal, even though price remains inside the larger daily premium range.
This means premium and discount are relative to the specific dealing range being studied.
A trader must understand both:
- The larger higher-time-frame range
- The smaller internal range
Ignoring either one can create an incomplete view of price.
The Role of the Daily Order Block Mean Threshold
A daily bullish or bearish order block mean threshold can act as a precise reversal point.
The mean threshold is generally the midpoint of the order block’s candle body range.
In a bullish reversal model, price may decline rapidly into the mean threshold of a daily bullish order block.
Very little price action may occur below the level before a strong reaction begins.
In a bearish model, price may rally into the mean threshold of a daily bearish order block and then reject higher prices.
The mean threshold is not automatically an entry.
It becomes more meaningful when it aligns with:
- An unusually large Monday or Tuesday move
- A higher-time-frame premium or discount condition
- Liquidity being taken
- A clear change in short-term order flow
- Institutional sponsorship after the reaction
Wednesday as a Common Reversal Day
Many intraweek reversals form around Wednesday.
Price may use Monday and Tuesday to deliver aggressively toward a higher-time-frame PD Array.
The move may continue into the transition from Tuesday into Wednesday.
Once the objective is reached, price can form the weekly low or high and reverse.
A bullish Wednesday reversal may involve:
- A large decline on Monday or Tuesday
- A daily discount PD Array below price
- Sell-side liquidity being taken
- A bullish reaction from the PD Array
- Wednesday breaking a short-term high
- Continued expansion on Thursday and Friday
A bearish Wednesday reversal follows the opposite sequence.
Thursday Reversals Can Also Form
Not every reversal occurs on Wednesday.
Price may reach the important higher-time-frame objective later and reverse on Thursday.
Wednesday and Thursday reversal profiles occur regularly enough that traders should monitor them whenever the early-week range is unusually large.
The exact day is less important than the conditions leading into it.
The trader should focus on:
- Early-week speed
- Early-week range expansion
- Proximity to a higher-time-frame PD Array
- Failure to continue after reaching the objective
- Evidence of opposing institutional order flow
What Are Overlapping Models?
Overlapping models occur when two trading disciplines create opposing expectations at the same time.
For example, a short-term trading model may suggest that price should continue lower.
At the same time, a daily swing-trading model may identify a valid long setup from a bullish order block.
The two models are now overlapping and opposing one another.
The lower-time-frame trader sees bearish continuation.
The higher-time-frame swing trader sees a discount entry opportunity.
This conflict can create an intraweek reversal.
The Higher-Time-Frame Model Usually Wins
The most important rule in overlapping models is that the higher-time-frame model has greater authority.
Michael J. Huddleston explains:
“The higher time frame discipline will always win.”
A one-hour bearish setup may work temporarily, but it has lower probability when it is pressing into a daily bullish PD Array.
A day-trading bullish setup may also fail when price is trading into a weekly bearish objective.
The hierarchy generally places greater importance on:
- Monthly PD Arrays
- Weekly PD Arrays
- Daily PD Arrays
- Four-hour PD Arrays
Anything below the four-hour chart is more closely connected with day trading and execution.
Lower-time-frame setups should ideally align with the higher-time-frame model.
Swing Trading Model Overlap
Swing-trading models are especially important when identifying intraweek reversals.
A sharp decline into a daily discount PD Array may look like bearish continuation to a short-term trader.
However, it may simultaneously represent a textbook swing-trade entry for a bullish trader.
If the trader understands only short-term trading, the reversal can appear unexpected.
If the trader understands swing trading as well, the same price action becomes easier to interpret.
The bullish swing model may include:
- Price reaching a daily discount array
- A sell-side liquidity run
- A bullish order block or mean threshold
- A break of a short-term high
- Bullish displacement
- Institutional sponsorship on retracements
This swing-trading model can overpower the lower-time-frame bearish profile.
Why Traders Should Study Multiple Trading Disciplines
A narrow focus can make traders vulnerable.
A scalper who studies only scalping may not recognize a daily swing reversal.
A day trader who ignores weekly structure may trade directly against a larger institutional objective.
A short-term trader who does not understand position or swing models may misread an early-week acceleration.
Studying multiple disciplines helps the trader understand how different models interact.
The objective is not to trade every style.
The objective is to recognize when another trading model is influencing the price action being traded.
Institutional Sponsorship After the Reversal
After price reacts from the higher-time-frame PD Array, traders should look for evidence of institutional sponsorship.
In a bullish reversal, this may appear as repeated support from bullish order blocks.
Price trades away from each order block with displacement and continues making higher short-term highs.
This suggests that new long positions are entering the market.
In a bearish reversal, the trader may see repeated reactions from bearish order blocks, followed by strong movement lower.
Institutional sponsorship helps confirm that the reversal is more than a temporary bounce.
Breaking a Short-Term High or Low
A reversal becomes more credible when price breaks an opposing short-term swing point.
After a decline into a daily bullish PD Array, price should eventually break a short-term high.
This indicates that the immediate bearish delivery is weakening.
After a rally into a daily bearish PD Array, price should break a short-term low.
The break does not guarantee a full reversal, but it provides evidence that order flow may be changing.
A trader can then watch for retracements into:
- Fair value gaps
- Order blocks
- Breakers
- Mitigation blocks
- Discount or premium arrays
The Balanced Price Range as a Reversal Objective
An intraweek reversal will often return to a previous balanced price range.
A balanced price range is an area where price previously consolidated before the aggressive early-week move.
For example, price may consolidate during Monday and then decline sharply on Tuesday.
After reversing from a daily bullish PD Array, price may return to Monday’s consolidation.
That previous balance becomes a logical bullish objective.
Price may stop at the balanced range or continue beyond it toward liquidity above an old high.
The trader should therefore consider two possible objectives:
- Return to the previous balanced price range
- Exceed the balanced range and take external liquidity
Connection With the Market Maker Buy Model
A bullish intraweek reversal can resemble a Market Maker Buy Model.
The general sequence may include:
- Initial consolidation
- Aggressive sell-off
- Smart-money reversal
- Low-risk buying opportunity
- Reaccumulation
- Return to the previous balanced range
- Expansion toward buy-side liquidity
The sell-off is not necessarily genuine bearish continuation.
It may be the manipulation phase that moves price into discount before institutional buying occurs.
Connection With the Market Maker Sell Model
A bearish intraweek reversal can resemble a Market Maker Sell Model.
The sequence may include:
- Initial consolidation
- Aggressive rally
- Smart-money reversal
- Low-risk selling opportunity
- Redistribution
- Return to the previous balanced range
- Expansion toward sell-side liquidity
The early-week rally can create bullish confidence immediately before price reaches a higher-time-frame premium PD Array.
When the Original Weekly Bias Fails
Traders should begin the week with a directional expectation, but they should not become emotionally attached to it.
A valid analysis can fail.
If price does not continue as expected after an early-week move, the trader should reassess the model.
Warning signs that the original bias may be failing include:
- Price reaches a major opposing PD Array
- The early-week move already covers most of the normal weekly range
- Price cannot continue beyond the higher-time-frame level
- An opposing short-term swing is broken
- Institutional sponsorship appears in the opposite direction
- Lower-time-frame continuation setups repeatedly fail
A failed expectation provides useful information.
It may reveal that the market is transitioning into an intraweek reversal profile.
Managing an Existing Profitable Trade
An intraweek reversal is particularly dangerous when a trader is already holding a profitable position.
The trade may still be in profit, but price begins behaving differently.
When this happens, traders should evaluate whether:
- The expected target has already been reached
- Price is trading into a higher-time-frame opposing array
- The early-week move is unusually extended
- Continuation displacement is weakening
- A stronger setup is forming in the opposite direction
Exiting or reducing risk can be more appropriate than hoping the original direction returns.
A profitable trade does not need to be held until it becomes a loss.
Bullish Intraweek Reversal Model
A bullish intraweek reversal may develop through the following sequence:
- Price begins the week with a bearish move.
- Monday or Tuesday produces unusually large downside expansion.
- Price approaches a daily, weekly or monthly discount PD Array.
- Sell-side liquidity is taken.
- Price reaches an order block, mean threshold or another institutional reference.
- The decline fails to continue.
- Price breaks a short-term high.
- Bullish displacement confirms changing order flow.
- Retracements find support at bullish PD Arrays.
- Price returns to a previous balanced range or seeks buy-side liquidity.
Bearish Intraweek Reversal Model
A bearish intraweek reversal may follow the opposite sequence:
- Price begins the week with a bullish move.
- Monday or Tuesday produces unusually large upside expansion.
- Price approaches a daily, weekly or monthly premium PD Array.
- Buy-side liquidity is taken.
- Price reaches a bearish order block, mean threshold or another institutional reference.
- The rally fails to continue.
- Price breaks a short-term low.
- Bearish displacement confirms changing order flow.
- Retracements find resistance at bearish PD Arrays.
- Price returns to a previous balanced range or seeks sell-side liquidity.
How to Analyse Intraweek Reversals
Start with the monthly, weekly and daily charts.
Mark the major premium and discount PD Arrays.
Determine where price is positioned inside the larger dealing range.
At the beginning of the week, monitor how much distance price covers on Monday and Tuesday.
Compare the move with the previous five daily ranges.
If the move is unusually large, identify which higher-time-frame PD Array price is approaching.
Move to the four-hour and one-hour charts after price reaches that area.
Look for evidence that the original order flow is failing.
Then monitor for a break in short-term structure and institutional sponsorship in the opposite direction.
Practical Checklist
Before anticipating an intraweek reversal, ask:
- Did Monday or Tuesday produce an unusually large move?
- Did price cover more distance than the recent average daily range?
- Is price approaching a daily, weekly or monthly PD Array?
- Is the market reaching premium or discount?
- Has the move taken meaningful liquidity?
- Has price reached an order block mean threshold?
- Did the original directional move fail to continue?
- Has an opposing short-term high or low been broken?
- Is displacement appearing in the reversal direction?
- Are bullish or bearish order blocks receiving sponsorship?
- Is a higher-time-frame swing model opposing the lower-time-frame setup?
- Is price likely to return to a previous balanced range?
Common Mistakes
One common mistake is assuming that a fast market must continue moving in the same direction.
Another is projecting an equal second leg simply because the first leg was large.
Traders also make mistakes by ignoring higher-time-frame PD Arrays and focusing only on one-hour or lower charts.
A further mistake is treating every small reaction as a reversal.
A valid reversal requires context, location and evidence of changing order flow.
Finally, traders often specialize so narrowly that they cannot recognize an opposing swing or position-trading model.
Final Thoughts
Intraweek Market Reversals & Overlapping Models helps traders recognize when an apparently strong weekly move may be approaching completion.
The most important warning signs are the speed and magnitude of price movement on Monday and Tuesday.
When price covers an unusually large distance early in the week, traders should immediately examine the higher-time-frame PD Arrays ahead.
A lower-time-frame continuation model may be colliding with a daily, weekly or monthly reversal model.
When this happens, the higher-time-frame model generally has greater influence.
By combining weekly profiling, premium and discount analysis, PD Arrays, swing-trading models and lower-time-frame confirmation, ICT traders can better prepare for Wednesday and Thursday reversals instead of being caught off guard by them.