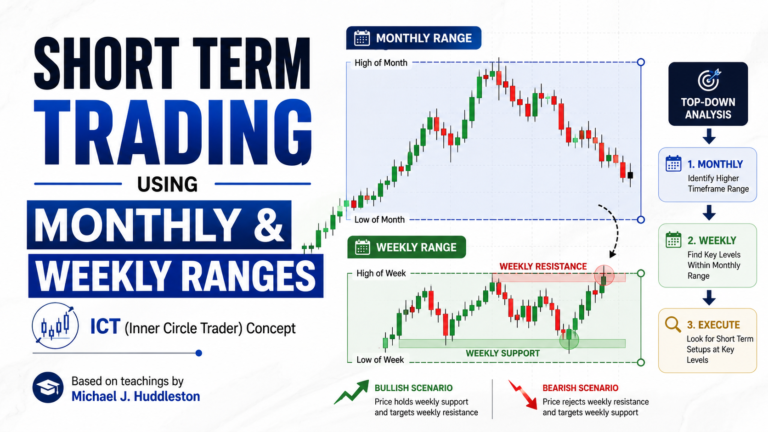
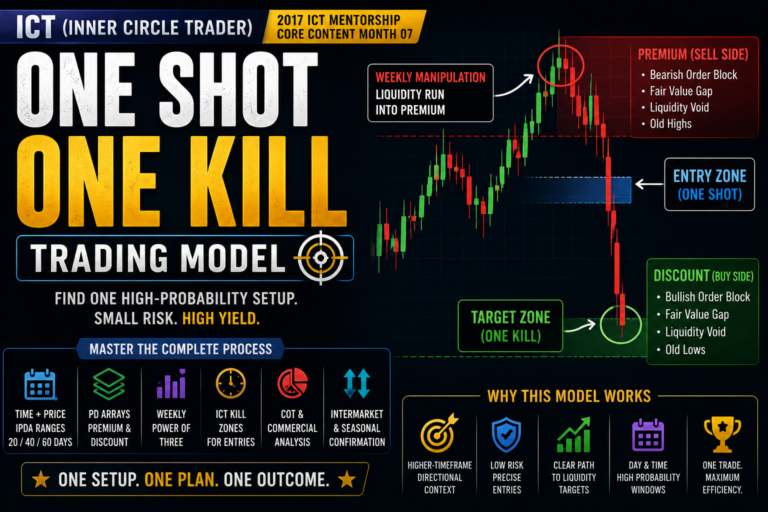
Short Term Trading Low Resistance Liquidity Runs Part 2 explains how traders can identify low-resistance price movements in trending market conditions. This concept was taught by Michael J. Huddleston, the founder of the ICT methodology, in the 2017 ICT Private Mentorship Core Content Month 07.
While Part 1 focuses mainly on consolidation, Part 2 applies the same time-and-price principles to directional markets.
The objective is to identify when price is likely to move from one institutional PD Array to another with limited resistance in its path.
As Michael J. Huddleston explains:
“Each week, the market we trade is going to seek to trade from one PD array to another.”
What Is a Low Resistance Liquidity Run in a Trending Market?
A low resistance liquidity run is a directional price move between two logical institutional reference points.
In a bullish trend, price generally moves from a discount PD Array toward a premium PD Array.
In a bearish trend, price generally moves from a premium PD Array toward a discount PD Array.
The path is considered low resistance when there are few significant opposing PD Arrays between the entry and target.
In bullish conditions, the trader looks for support below price and a logical premium objective above it.
In bearish conditions, the trader looks for resistance above price and a logical discount objective below it.
Time and Price Remain the Foundation
The ICT approach combines time and price.
The time element comes from the recent IPDA data ranges:
- Previous 20 trading days
- Previous 40 trading days
- Previous 60 trading days
For short-term trading, the last 60 trading days provide the most useful institutional reference points.
The price element comes from premium and discount PD Arrays.
These may include:
- Order Blocks
- Fair Value Gaps
- Breakers
- Mitigation Blocks
- Rejection Blocks
- Old highs and lows
- Liquidity pools
- Previous institutional buying or selling
The setup becomes stronger when time, price, directional bias and PD Array location support the same idea.
Markets Are Fractal
A market can be consolidating on one timeframe while trending on another.
For example, a daily chart may show a large consolidation, but a smaller section of that consolidation may display a clear bullish trend on the four-hour chart.
This is why traders should not label the entire market with only one condition.
The larger structure provides context.
The smaller structure provides the tradable price leg.
A trending move inside a larger range can still offer a valid low resistance liquidity run.
Start With the Larger Dealing Range
Before analyzing the trend, define the larger trading range.
Mark:
- The highest candle body
- The lowest candle body
- The 50 percent equilibrium
- The premium half
- The discount half
- Internal quadrants
This larger range becomes the master framework.
If a bullish move originates from a deep discount area, the market may seek a premium objective.
If a bearish move originates from a high premium area, the market may seek a discount objective.
The larger dealing range helps explain why the smaller trend is developing.
Look for Displacement
Displacement is an important sign of institutional participation.
In a bullish market, strong upward candles and rapid repricing suggest that money is flowing into long positions.
In a bearish market, strong downward candles and rapid repricing suggest that money is flowing into short positions.
Displacement tells the trader that price is not moving randomly.
It indicates that the market may be seeking a higher institutional reference point in bullish conditions or a lower institutional reference point in bearish conditions.
A clean displacement also helps identify:
- Fair Value Gaps
- Breakers
- Mitigation Blocks
- Future retracement entries
- Continuation targets
Why the Four-Hour Chart Is Important
The four-hour chart is one of the most useful timeframes for Short Term Trading Low Resistance Liquidity Runs Part 2.
It provides enough detail to study the weekly range without creating too much lower-timeframe noise.
The four-hour chart helps the trader see:
- The beginning and end of each trading week
- Weekly opening behavior
- Early-week manipulation
- Higher-timeframe PD Arrays
- Weekly expansion
- Premium and discount objectives
- Continuation entries
Michael J. Huddleston describes the four-hour chart as a practical timeframe for framing One Shot One Kill setups.
It allows the trader to anticipate what the completed weekly candle or weekly range may eventually look like.
Mark Weekly Dividers
Weekly dividers separate one trading week from the next.
They help the trader study the movement between Sunday’s opening and Friday’s close.
By observing each week separately, the trader can ask:
- Where did the weekly low form?
- Where did the weekly high form?
- Which PD Array supported the move?
- Which PD Array became the target?
- How much of the weekly range formed by Wednesday?
- Did price follow a bullish or bearish Power of Three profile?
This makes the weekly range easier to analyze and anticipate.
Apply Higher-Timeframe PD Arrays to the Four-Hour Chart
Monthly, weekly and daily PD Arrays should be marked on the four-hour chart.
Four-hour PD Arrays may also be added for more detail, but the higher-timeframe levels usually provide the strongest reactions.
Important bullish PD Arrays include:
- Daily bullish Order Blocks
- Weekly bullish Order Blocks
- Discount Fair Value Gaps
- Bullish Breakers
- Bullish Mitigation Blocks
- Old highs acting as support
- Sell-side liquidity below old lows
Important bearish PD Arrays include:
- Daily bearish Order Blocks
- Weekly bearish Order Blocks
- Premium Fair Value Gaps
- Bearish Breakers
- Bearish Mitigation Blocks
- Old lows acting as resistance
- Buy-side liquidity above old highs
These reference points help the trader identify where price may react and where the next weekly target may be located.
Trading From Discount to Premium
In a bullish trend, the trader looks for price to retrace into a discount PD Array.
The ideal setup may form when price reaches:
- A bullish Order Block
- A Fair Value Gap
- A bullish Breaker
- A mitigation level
- A graded range divider
- An equilibrium level
- A previous institutional buying area
Once price reacts from discount, the trader looks for movement toward a premium PD Array.
The target may be:
- A bearish Order Block
- A premium Fair Value Gap
- An old high
- Buy-side liquidity
- A higher range quadrant
- A premium range divider
The move from discount to premium represents the bullish low resistance liquidity run.
Trading From Premium to Discount
The same model can be reversed for bearish conditions.
Price rallies into a premium PD Array and finds resistance.
The premium area may contain:
- A bearish Order Block
- A bearish Breaker
- A premium Fair Value Gap
- Buy-side liquidity
- An old low acting as resistance
- A higher range divider
After the bearish reaction, price seeks a discount PD Array.
The target may be:
- A bullish Order Block
- A discount Fair Value Gap
- Sell-side liquidity
- An old low
- A lower range quadrant
- A discount divider
This creates a bearish low resistance liquidity run.
You Do Not Need the Exact Weekly Low
A common mistake is believing that a One Shot One Kill trade requires entry at the exact weekly low or high.
That is not necessary.
In a bullish weekly range, the trader may miss the lowest entry and still participate later from:
- A Fair Value Gap
- A bullish Breaker
- A mitigation block
- A retracement into equilibrium
- A lower-timeframe discount PD Array
In a bearish weekly range, the trader may miss the highest entry and still participate from a later retracement.
The goal is not perfection.
The goal is one logical setup with a realistic target.
Realistic Weekly Pip Objectives
Traders should use realistic objectives.
A beginner may focus on approximately:
- 30 to 50 pips per week
With more experience, the objective may increase to:
- 50 to 75 pips per week
More advanced traders may occasionally seek:
- 75 to 100 pips per week
However, the weekly range does not always provide 100 pips of clean movement.
Trying to capture the entire weekly range may encourage poor entries, late trades or unrealistic targets.
Capturing a consistent portion of the weekly range is more practical.
Bullish Power of Three in a Trending Market
In a bullish weekly profile, price often opens near the lower part of the weekly range and closes near the upper part.
The general sequence may include:
- Early-week accumulation
- A move lower to create the weekly low
- Bullish displacement
- Continuation toward premium
- A close near the weekly high
The weekly low commonly forms between Monday and Wednesday.
After the low forms, price may expand higher through Thursday or Friday.
This aligns with the ICT Power of Three concept.
Bearish Power of Three in a Trending Market
In bearish conditions, the weekly profile may show the opposite structure.
The general sequence may include:
- Early-week accumulation
- A move higher to create the weekly high
- Bearish displacement
- Continuation toward discount
- A close near the weekly low
The weekly high commonly forms between Monday and Wednesday.
After the high forms, price may decline during the remainder of the week.
Grading the Price Range
The larger range should be divided into smaller premium and discount sections.
These internal levels act like reference points for the algorithm.
Price may move from:
- One quadrant to another
- One midpoint to another
- A discount divider to a premium divider
- One PD Array to the next
When price breaks strongly through one graded level, it may seek the next logical level.
These dividers can help the trader identify likely support and resistance even when there is no obvious traditional horizontal level.
Why Traditional Support and Resistance Is Limited
Traditional support and resistance often rely on drawing a line from a previous reaction.
The assumption is that price will respond to the same line again.
However, old price reactions do not always explain current institutional order flow.
ICT focuses instead on:
- Where institutions previously bought
- Where institutions previously sold
- Which PD Arrays remain active
- Whether the market is in premium or discount
- Where liquidity is resting
- Which reference point price is likely to seek next
This creates a more structured framework for anticipating price delivery.
PD Arrays Can Act Like Magnets
Price often gravitates toward logical institutional reference points.
In a bullish trend, premium PD Arrays above price may act as targets.
In a bearish trend, discount PD Arrays below price may act as targets.
Range dividers may also attract price.
When price trades through one level with strong displacement, the next graded level or PD Array may become the likely objective.
This is why the trader should map the chart before the week begins.
Anticipating the Weekly Range
Before Sunday’s opening, review the four-hour chart.
Mark all important monthly, weekly and daily PD Arrays.
Then ask:
- Is price currently in premium or discount?
- Is the market trending higher or lower?
- Which PD Array is supporting price?
- Which opposing PD Array is the most logical target?
- Can price realistically reach that target by Friday?
- Where may the weekly low or high form?
- Is there a clear low resistance path?
The objective is to visualize the possible weekly range before it fully forms.
This exercise develops anticipatory price skills.
The forecast will not always be correct, but consistent practice helps traders recognize repeating weekly behavior.
Use Probability, Not Certainty
Short-term trading is based on probability.
A discount market is more likely to seek a premium objective, but it is not guaranteed.
A premium market is more likely to seek a discount objective, but it is not guaranteed.
The trader must determine whether the proposed target is reasonable within the remaining time in the week.
A distant target may be technically valid but unrealistic if only one trading day remains.
Time limits the range that price can reasonably complete.
The Importance of Monday, Tuesday and Wednesday
In bullish trending conditions, the weekly low commonly forms on:
- Monday
- Tuesday
- Wednesday
In bearish trending conditions, the weekly high commonly forms during the same period.
These are the highest-probability days for positioning into the weekly trend.
A bullish setup may include:
- Tuesday low at a daily Fair Value Gap
- Wednesday retracement into a bullish Breaker
- Continuation higher into Thursday
A bearish setup may include:
- Tuesday high at a premium Order Block
- Wednesday retracement into a bearish Breaker
- Continuation lower into Thursday
The trader should focus on these early-week opportunities rather than chasing price late in the week.
Weekly Range Completion by Wednesday
A significant portion of the weekly range may already be completed by Wednesday’s London close.
In many cases, approximately 30 to 50 percent of the weekly range has formed by this time.
This has important implications.
A trader who misses the Monday-to-Wednesday setup should not automatically expect an enormous move during Thursday and Friday.
The remaining weekly range may be limited.
Late-week chasing can lead to:
- Poor risk-to-reward
- Buying near premium
- Selling near discount
- Entering after the main displacement
- Holding for unrealistic targets
Understanding weekly range completion helps prevent emotional overtrading.
Thursday Continuation Entries
Thursday can still provide continuation setups.
In bullish conditions, price may retrace into:
- A Wednesday Fair Value Gap
- A bullish mitigation block
- A short-term discount area
- Equilibrium of the recent impulse
Price may then continue higher toward the weekly premium objective.
In bearish conditions, Thursday may retrace into a bearish PD Array before continuing lower.
However, Thursday entries should be evaluated against how much of the weekly target has already been reached.
Friday Price Behavior
Friday often provides less predictable expansion.
The market may:
- Continue slightly toward the target
- Retrace part of the weekly move
- Consolidate
- Create a small Judas Swing
- Close near the weekly high or low
- Produce a neutral close
If the major weekly displacement occurred on Tuesday or Wednesday, Friday may offer little additional movement.
Traders should avoid expecting every Friday to produce a large continuation.
Using the One-Hour Chart
The four-hour chart is used to frame the weekly setup.
The one-hour chart provides additional detail.
It may reveal PD Arrays that are not visible on the four-hour chart, including:
- Breakers
- Mitigation Blocks
- Smaller Fair Value Gaps
- Intraday Order Blocks
- Refined liquidity pools
The one-hour chart can help reduce entry risk or provide another opportunity after the higher-timeframe entry was missed.
However, the one-hour chart should remain aligned with the four-hour directional framework.
Avoid Going Below the One-Hour Chart for Weekly Setups
For One Shot One Kill and short-term weekly setups, timeframes below one hour may introduce too much noise.
Very low timeframes are more suitable for:
- Day trading
- Scalping
- Intraday execution
The goal of this model is to capture an impulse price swing that contributes to the weekly range.
The four-hour chart provides the setup.
The one-hour chart provides refinement.
Bullish Example
Assume the larger market is in discount and shows bullish displacement.
Price begins the week by retracing into a daily Fair Value Gap.
The Fair Value Gap overlaps with a graded discount level.
The weekly low forms on Tuesday.
Price then expands above Monday’s and Tuesday’s highs.
On Thursday, price retraces into an hourly mitigation block and continues higher.
The target is a daily bearish Order Block in premium.
This is a bullish low resistance liquidity run from discount to premium.
Bearish Example
Assume the market is in premium and begins showing bearish displacement.
Price rallies into a weekly bearish Order Block on Monday.
Buy-side liquidity above an old high is taken on Tuesday.
The weekly high forms at the premium PD Array.
Price then declines through Wednesday and retraces into a one-hour bearish Breaker on Thursday.
The target is a daily bullish Order Block in discount.
This represents a bearish low resistance liquidity run from premium to discount.
Practical Trading Process
Begin with the daily chart.
Define the major dealing range and determine whether price is in premium or discount.
Grade the larger range into internal quadrants.
Mark monthly, weekly and daily PD Arrays.
Move to the four-hour chart.
Add weekly dividers.
Determine whether the current price leg is trending bullishly or bearishly.
Identify the most logical opposing PD Array.
Estimate whether price can reasonably reach that target before Friday.
Look for the weekly low or high to form between Monday and Wednesday.
Use the one-hour chart to refine the entry.
Avoid chasing price if much of the weekly range is already complete.
Trading Checklist
Before entering a low resistance liquidity run, confirm:
- Has the previous 20, 40 and 60 trading days been reviewed?
- Is the larger dealing range clearly defined?
- Is price in premium or discount?
- Is the current lower-timeframe condition trending?
- Is there clear displacement?
- Which PD Array is supporting the move?
- Which PD Array is the likely target?
- Is the route between entry and target relatively clear?
- Has the four-hour chart been used to frame the weekly range?
- Are monthly, weekly and daily PD Arrays marked?
- Did the weekly high or low form between Monday and Wednesday?
- Has too much of the weekly range already been completed?
- Is the pip objective realistic?
- Is the one-hour entry aligned with the four-hour bias?
- Is enough time left in the week for the target to be reached?
Common Mistakes
Trying to Capture the Entire Weekly Range
The trader does not need the exact weekly low and high.
Capturing a clean portion of the move is enough.
Chasing After Wednesday
By Wednesday’s London close, a large part of the weekly range may already be complete.
Late entries may have limited reward.
Ignoring the Larger Range
A bullish four-hour trend may be approaching a major daily premium PD Array.
The larger context must always be considered.
Trading Without a Logical Target
A strong entry is not enough.
The trader must know which opposing PD Array price is likely to seek.
Using Very Low Timeframes
Lower timeframes can distract the trader from the weekly objective.
The four-hour and one-hour charts are generally more suitable for this model.
Expecting Every Week to Be Explosive
Some weeks have small ranges.
Targets should be adjusted to the actual market conditions.
Ignoring Time
A distant PD Array may not be reachable before the week closes.
Both price and time must support the setup.
Final Thoughts
Short Term Trading Low Resistance Liquidity Runs Part 2 applies the premium and discount framework to trending market conditions.
The trader begins with the larger dealing range, identifies whether price is in premium or discount and studies the recent 20, 40 and 60 trading days.
The four-hour chart is then used to frame the weekly range.
In bullish conditions, the trader looks for the weekly low to form between Monday and Wednesday at a discount PD Array. Price can then expand toward a premium target.
In bearish conditions, the trader looks for the weekly high to form during the first half of the week at a premium PD Array. Price can then decline toward discount.
The trader does not need to capture the exact weekly high or low.
The objective is to identify one logical setup, trade in the probable weekly direction and target the next institutional PD Array through a low resistance path.