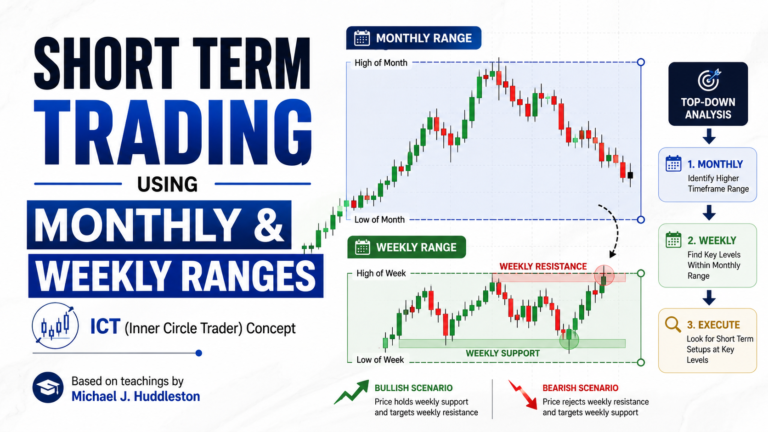
Short Term Trading Using Monthly & Weekly Ranges is an ICT framework for anticipating how price may develop from Monday through Friday. The concept was taught by Michael J. Huddleston, founder of ICT or Inner Circle Trader, in the 2017 ICT Private Mentorship Core Content Month 07.
Within this framework, Short Term Trading Defining Weekly Range Profiles helps traders recognize recurring weekly price-delivery patterns. Instead of treating every trading day independently, the trader studies how the early part of the week prepares liquidity, manipulation and expansion for the remaining sessions.
Michael J. Huddleston explains the importance of studying these patterns directly on historical charts:
“The impact is going to be really appreciated in your understanding when you go through price action with a one-hour chart.”
The objective is not to predict every candle. It is to determine where the weekly high or low may form, which liquidity price may seek and when the main weekly expansion is likely to occur.
What Is a Weekly Range Profile?
A weekly range profile is a recurring pattern describing how price forms its weekly high, weekly low, consolidation and directional expansion.
The weekly profile usually develops around four elements:
- Higher-time-frame directional bias
- Premium and discount PD arrays
- Intraweek liquidity
- Time-based manipulation
For example, when the higher-time-frame outlook is bullish, the trader may expect price to manipulate lower early in the week, reach a discount PD array and then expand higher.
When the outlook is bearish, price may manipulate higher, reach a premium PD array and then expand lower.
The weekly profile should therefore support the higher-time-frame narrative rather than replace it.
The Importance of Higher-Time-Frame PD Arrays
Weekly range profiles depend heavily on identifying higher-time-frame premium and discount arrays.
A discount array is an area below equilibrium where institutional buying may occur. Examples can include:
- Bullish order blocks
- Bullish fair value gaps
- Previous lows
- Breaker blocks
- Mitigation blocks
- Discount portions of dealing ranges
A premium array is an area above equilibrium where institutional selling may occur. Examples can include:
- Bearish order blocks
- Bearish fair value gaps
- Previous highs
- Breaker blocks
- Mitigation blocks
- Premium portions of dealing ranges
The trader must know which higher-time-frame array price is likely to seek. The weekly profile then helps estimate the day and session during which price may reach that area.
Classic Tuesday Low of the Week
The Classic Tuesday Low of the Week is a generally bullish weekly profile.
The trader already expects higher prices based on the higher-time-frame analysis.
On Monday, price usually trades above a higher-time-frame discount array without reaching it. Price may consolidate, trade slightly higher or remain inside a narrow range.
On Tuesday, price drives lower into the discount array and forms the weekly low. This manipulation commonly occurs during the Tuesday London session or New York session.
After reaching the discount array and taking sell-side liquidity, price may begin its bullish weekly expansion.
Conditions to monitor
- Higher-time-frame bias is bullish
- A discount PD array remains below price
- Monday fails to reach the discount array
- Tuesday trades below Monday’s range
- Sell-side liquidity is taken
- Bullish displacement appears from the discount array
The Tuesday London low may not always remain the final weekly low. The New York session can trade below the London low before the real reversal begins.

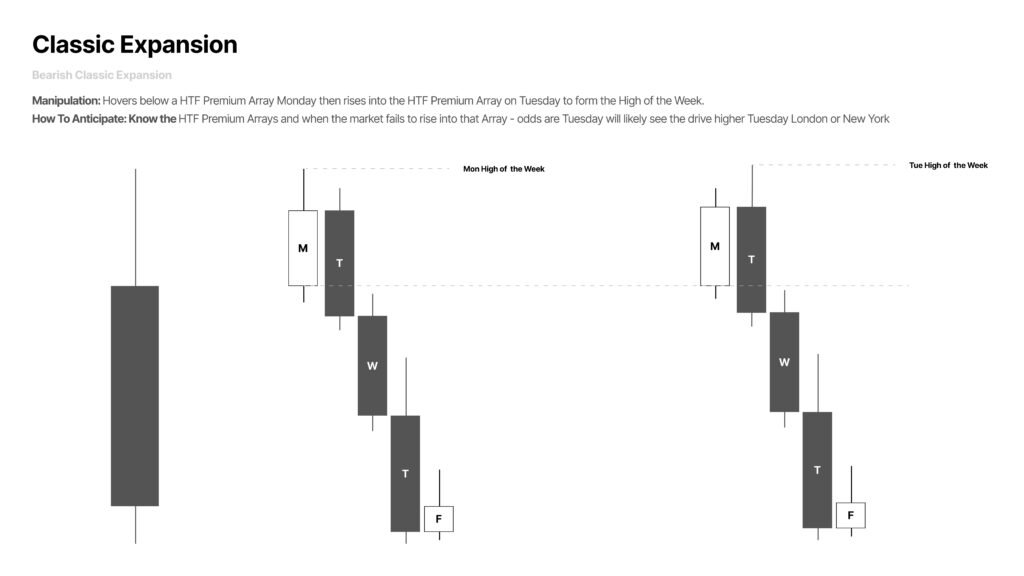
Classic Tuesday High of the Week
The Classic Tuesday High of the Week is the bearish version of the Tuesday profile.
The trader begins with a bearish higher-time-frame outlook.
On Monday, price trades below a higher-time-frame premium array but fails to reach it. On Tuesday, price expands higher into the premium array, takes buy-side liquidity and forms the weekly high.
The manipulation may occur during the Tuesday London session or New York session.
Conditions to monitor
- Higher-time-frame bias is bearish
- A premium PD array remains above price
- Monday fails to reach the premium array
- Tuesday trades above Monday’s range
- Buy-side liquidity is taken
- Bearish displacement appears from the premium array
The Tuesday New York session can trade above the London high before establishing the final high of the week.
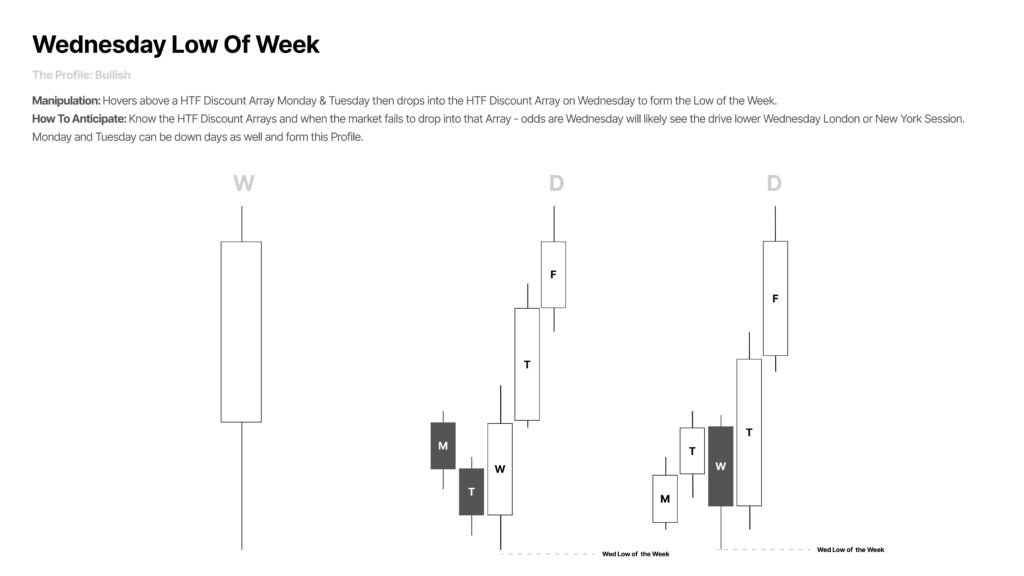
Wednesday Low of the Week
The Wednesday Low of the Week is another bullish weekly range profile.
Price may remain above a higher-time-frame discount array on Monday and Tuesday. Since the discount objective has not yet been reached, price may drive lower on Wednesday.
The Wednesday London or New York session can enter the discount array, take sell-side liquidity and establish the weekly low.
Monday and Tuesday can both be bearish days during this profile. The bullish weekly expansion begins only after the Wednesday manipulation has been completed.
Main characteristics
- Bullish higher-time-frame expectation
- Discount array remains untested
- Monday and Tuesday fail to complete the downside objective
- Wednesday delivers the main sell-side run
- Price reverses after reaching discount
The Wednesday London low can also be taken during the New York session before the weekly low is confirmed.
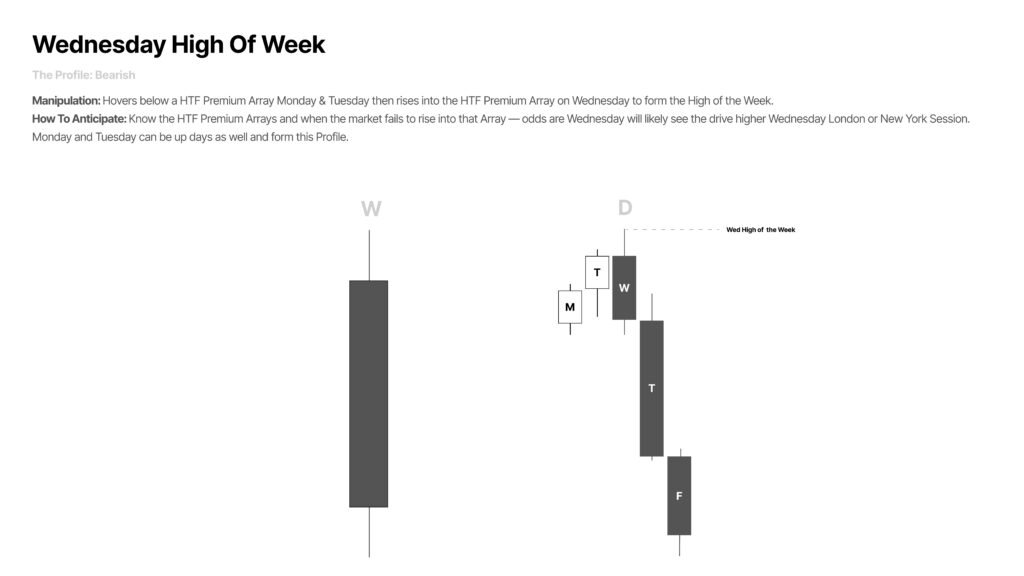
Wednesday High of the Week
The Wednesday High of the Week is a generally bearish profile.
Price may remain below a higher-time-frame premium array during Monday and Tuesday. Since the premium objective remains open, price may expand higher on Wednesday.
The Wednesday London or New York session can take buy-side liquidity, reach the premium array and establish the weekly high.
Monday and Tuesday may both be bullish days even though the larger expectation is bearish.
Main characteristics
- Bearish higher-time-frame expectation
- Premium array remains untested
- Monday and Tuesday fail to complete the upside objective
- Wednesday delivers the buy-side run
- Price rejects the premium array
- Bearish displacement follows
A trader should not assume the Wednesday London high is protected immediately. The New York session may trade above it before the bearish reversal begins.
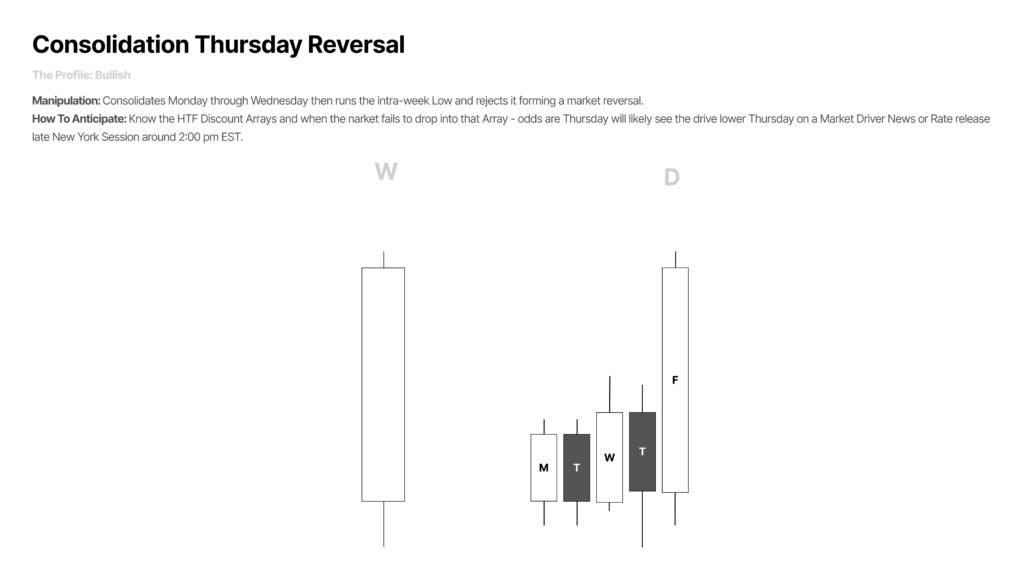
Consolidation Thursday Reversal
The Consolidation Thursday Reversal develops when price remains inside a range from Monday through Wednesday.
The early part of the week does not produce meaningful directional expansion. Instead, liquidity builds above and below the intraweek range.
On Thursday, price runs one side of the consolidation and reverses strongly in the opposite direction.
Bullish Thursday reversal
In a bullish profile, price consolidates from Monday through Wednesday.
On Thursday, price trades below the intraweek low, reaches a higher-time-frame discount array and rejects the lower prices.
The sell-side liquidity run becomes the manipulation before the bullish reversal.
This pattern may develop around market-moving news, interest-rate decisions or late New York session events.
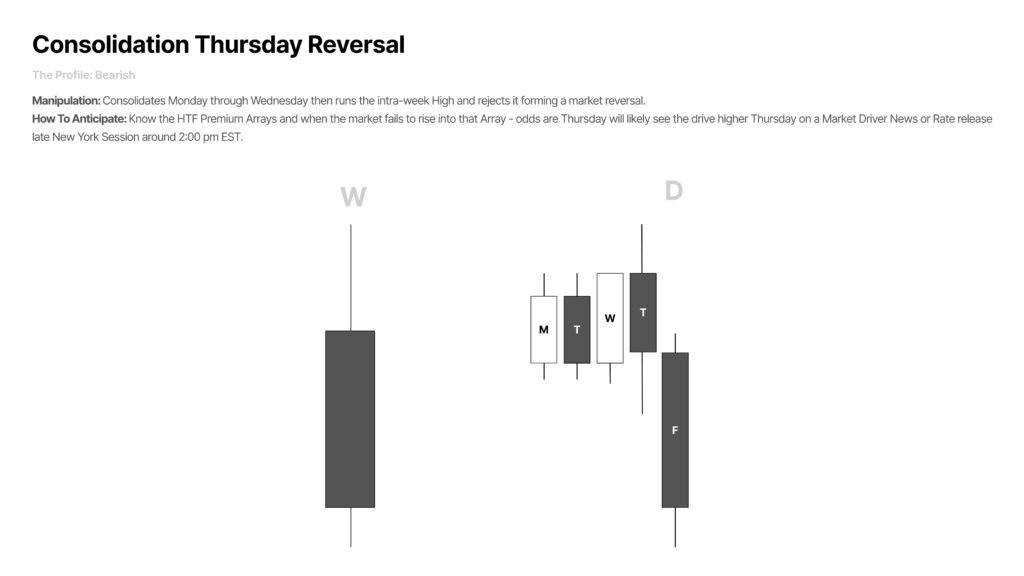
Bearish Thursday reversal
In a bearish profile, price also consolidates from Monday through Wednesday.
On Thursday, price runs above the intraweek high, reaches a higher-time-frame premium array and rejects the higher prices.
The buy-side liquidity run becomes the manipulation before the bearish reversal.
Interest-rate announcements and central-bank events can contribute to this type of Thursday price delivery.
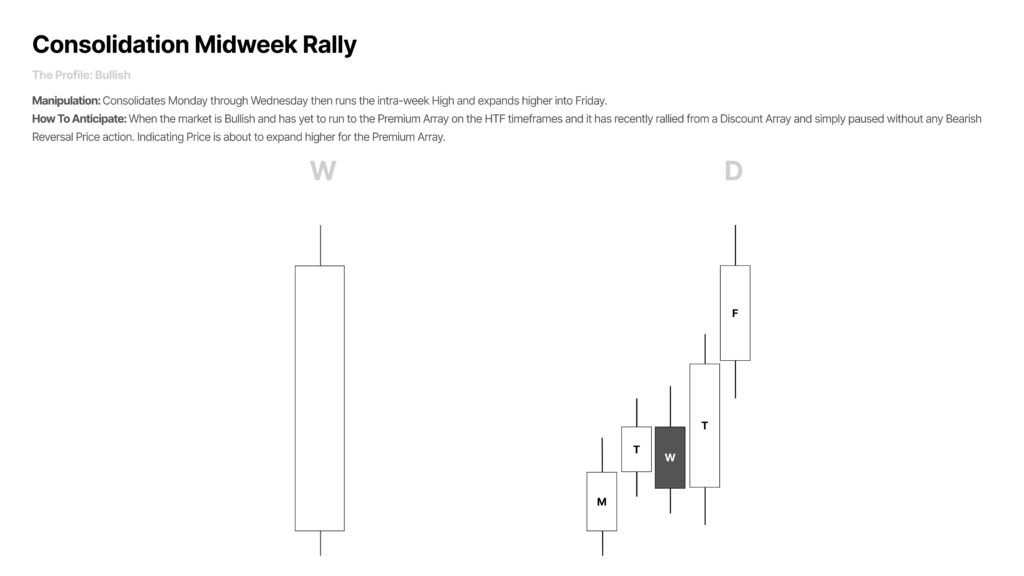
Consolidation Midweek Rally
The Consolidation Midweek Rally is a bullish continuation profile.
Price consolidates from Monday through Wednesday and then trades above the intraweek high. Instead of rejecting the breakout, price continues expanding higher into Friday.
This profile becomes more likely when:
- The higher-time-frame outlook is bullish
- Price recently moved away from a discount array
- A premium objective remains above price
- No meaningful bearish reversal pattern has appeared
- The midweek pause looks corrective rather than distributive
The consolidation is not necessarily a reversal signal. It may simply represent a pause before price continues toward the higher-time-frame premium objective.
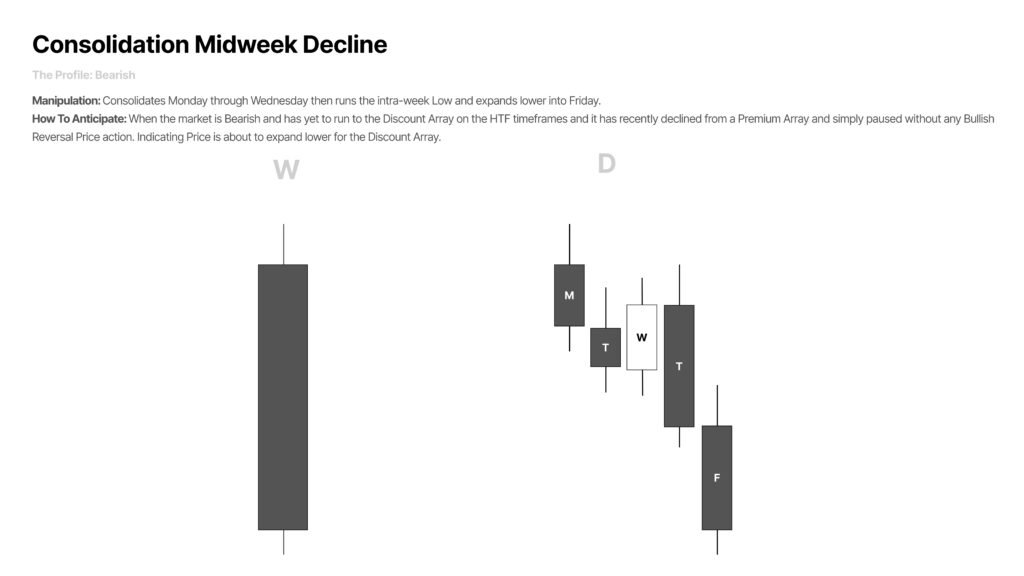
Consolidation Midweek Decline
The Consolidation Midweek Decline is the bearish continuation version.
Price consolidates from Monday through Wednesday and then trades below the intraweek low. Instead of quickly reversing, price continues expanding lower into Friday.
This profile becomes more likely when:
- The higher-time-frame outlook is bearish
- Price recently declined from a premium array
- A discount objective remains below price
- No meaningful bullish reversal pattern has appeared
- The midweek consolidation looks corrective
The break below the consolidation should align with the larger bearish narrative and the remaining higher-time-frame downside objective.
Seek and Destroy Friday Profile
The Seek and Destroy Friday profile represents neutral or low-probability trading conditions.
Price consolidates from Monday through Thursday and repeatedly trades above and below shallow intraweek highs and lows.
Both buy-side and sell-side liquidity may be taken without producing a clean directional move.
The final expansion occurs late in the week, frequently on Friday.
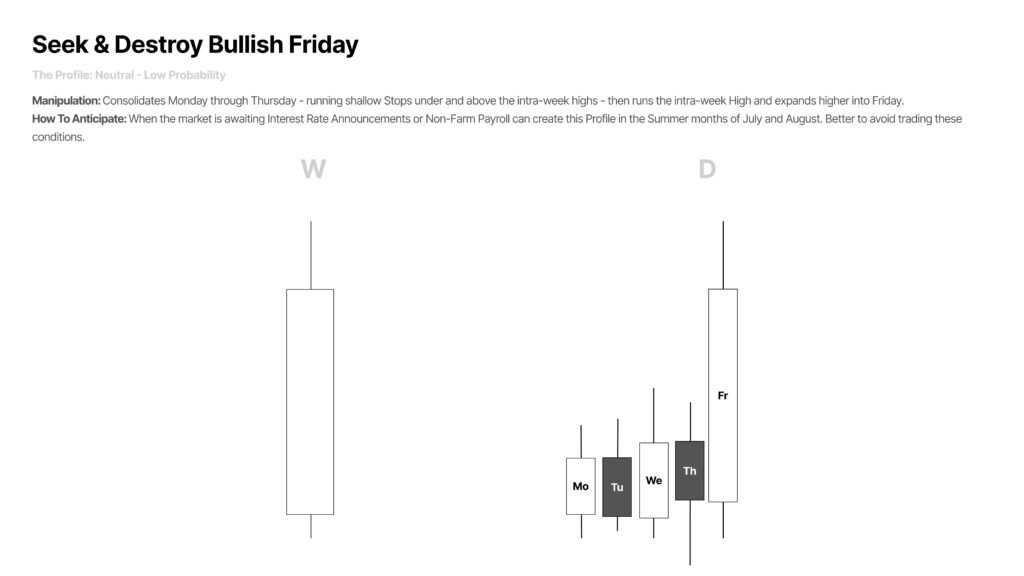
Bullish Seek and Destroy Friday
Price runs liquidity on both sides of the range from Monday through Thursday.
It later trades above the intraweek high and expands higher into Friday.
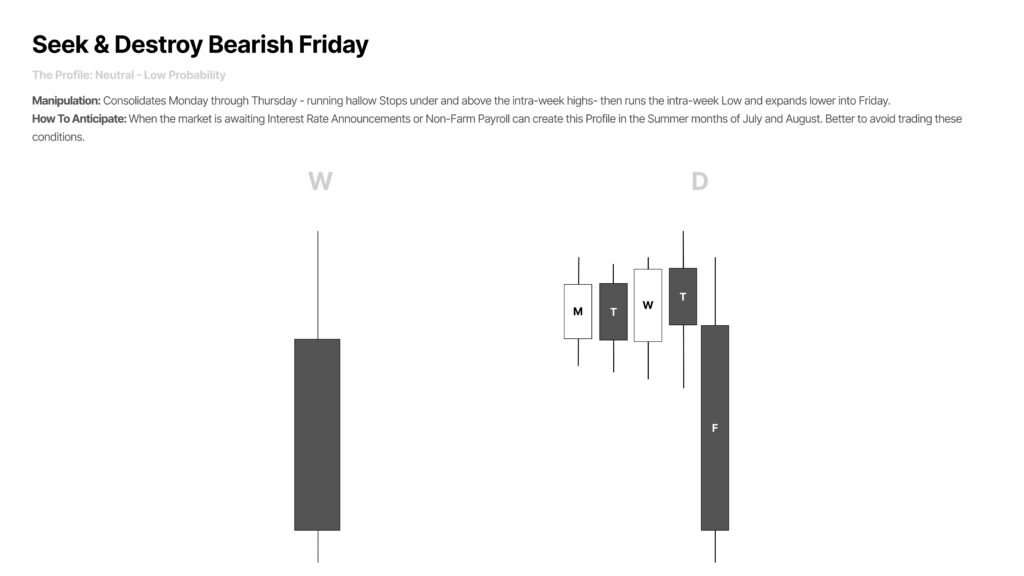
Bearish Seek and Destroy Friday
Price runs shallow liquidity above and below the intraweek range.
It later trades below the intraweek low and expands lower into Friday.
These profiles may appear when the market is waiting for major interest-rate announcements or Non-Farm Payroll data. They can also appear more frequently during the lower-volume summer months of July and August.
Because the price action is uncertain and frequently manipulative, avoiding these conditions may be more appropriate than forcing a trade.
Wednesday Weekly Reversal
The Wednesday Weekly Reversal forms when the market reaches an important long-term or intermediate-term price level around the middle of the week.
Unlike a normal continuation profile, Wednesday becomes the turning point for the entire weekly range.
Bullish Wednesday weekly reversal
Price consolidates on Monday and Tuesday.
On Wednesday, price drives lower into a higher-time-frame discount array and takes sell-side liquidity.
Institutional buying enters near the discount objective, producing a strong bullish reversal.
This pattern is more meaningful when price is trading near a long-term or intermediate-term low.

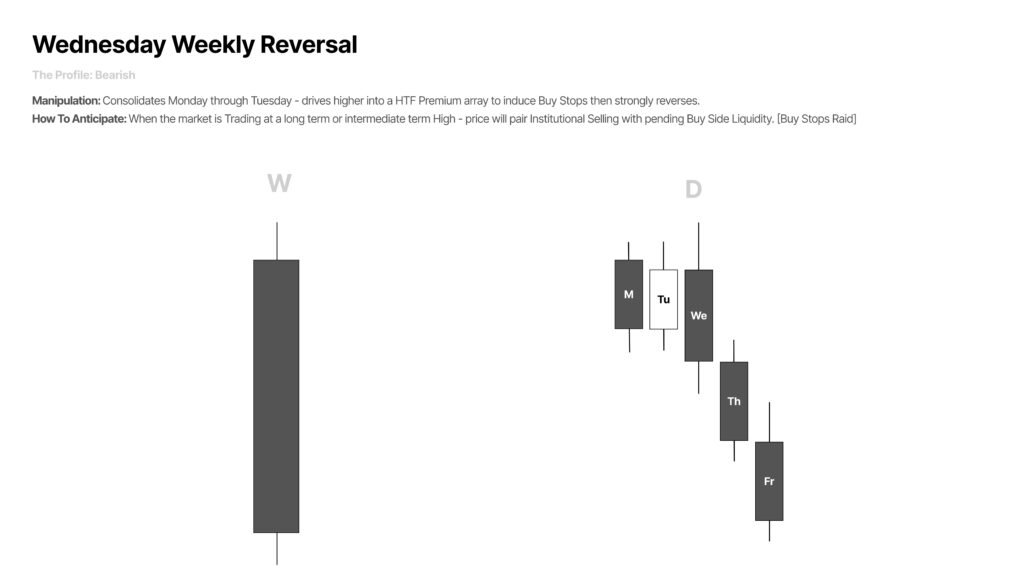
Bearish Wednesday weekly reversal
Price consolidates on Monday and Tuesday.
On Wednesday, price drives higher into a higher-time-frame premium array and takes buy-side liquidity.
Institutional selling enters near the premium objective, producing a strong bearish reversal.
This pattern is more meaningful when price is trading near a long-term or intermediate-term high.
How to Use Weekly Range Profiles in Short-Term Trading
The weekly profile should be used as a framework rather than a mechanical entry signal.
Start by determining the higher-time-frame directional bias from the monthly, weekly and daily charts.
Mark the important premium and discount PD arrays that price may seek during the week.
Study Monday’s price action. Determine whether price has already reached the expected higher-time-frame objective or whether the objective remains open.
If Monday fails to reach the expected array, consider whether Tuesday may form the weekly high or low.
If Monday and Tuesday both fail to complete the objective, consider whether Wednesday may deliver the manipulation.
When price consolidates through Wednesday, prepare for a possible Thursday reversal, midweek continuation or Seek and Destroy Friday profile.
Once the likely profile becomes clearer, use lower-time-frame confirmation for execution. This may include:
- Liquidity sweeps
- Market structure shifts
- Displacement
- Fair value gaps
- Order blocks
- Optimal Trade Entry
- Session-based entry timing
The profile provides the weekly narrative. The lower-time-frame setup provides the trade entry.
A Practical Weekly Analysis Routine
Before the week begins, mark the monthly and weekly directional bias.
Identify the nearest higher-time-frame premium and discount arrays.
Mark the previous week’s high and low, along with important daily highs and lows.
After Monday closes, evaluate whether price has reached the expected objective.
During Tuesday and Wednesday, monitor London and New York session liquidity for the possible weekly high or low.
If price remains inside consolidation through Wednesday, prepare for Thursday news volatility or a late-week expansion.
Avoid assuming the weekly profile too early. Allow price action to confirm which pattern is developing.
Common Mistakes Traders Make
One common mistake is trying to trade every weekly profile without first establishing a directional bias.
A Tuesday low profile is not automatically bullish. It becomes relevant when the higher-time-frame conditions already support higher prices.
Another mistake is assuming the London session high or low must remain protected. The New York session may take that level before creating the true weekly turning point.
Traders also make errors when they ignore major economic events. Interest-rate decisions, central-bank announcements and employment reports can delay the weekly expansion or create Seek and Destroy conditions.
The final mistake is memorizing the shapes without studying real price action. These profiles become useful only after reviewing many historical examples.
Weekly Range Profile Checklist
Before trading a weekly profile, confirm:
- What is the monthly and weekly directional bias?
- Which higher-time-frame PD array is price seeking?
- Is the target located in premium or discount?
- Did Monday reach the expected array?
- Is Tuesday likely to form the weekly high or low?
- Has the objective been delayed until Wednesday?
- Is price consolidating from Monday through Wednesday?
- Is a major Thursday or Friday news event scheduled?
- Has intraweek buy-side or sell-side liquidity been taken?
- Has displacement confirmed the expected direction?
- Does the lower-time-frame entry support the weekly narrative?
Final Thoughts
Short Term Trading Using Monthly & Weekly Ranges helps traders understand that weekly price action often follows recognizable patterns.
The weekly high or low may form on Tuesday, Wednesday or after a Thursday liquidity run. In other conditions, price may consolidate during the middle of the week before continuing toward a higher-time-frame objective.
The purpose of Short Term Trading Defining Weekly Range Profiles is not to predict the week with complete certainty. It is to organize price action around directional bias, premium and discount arrays, liquidity and time.
By reviewing these profiles on the one-hour chart and comparing them with higher-time-frame PD arrays, traders can develop a clearer understanding of how weekly price delivery unfolds.