Index Futures – AM Trend is an ICT framework for studying the primary morning price swing that often develops after the US equity market opens. Michael J. Huddleston, the founder of ICT (Inner Circle Trader) concepts, teaches traders to combine the 09:30 New York open with overnight liquidity, institutional order flow, ICT PD Arrays and divergence between major US stock indices.
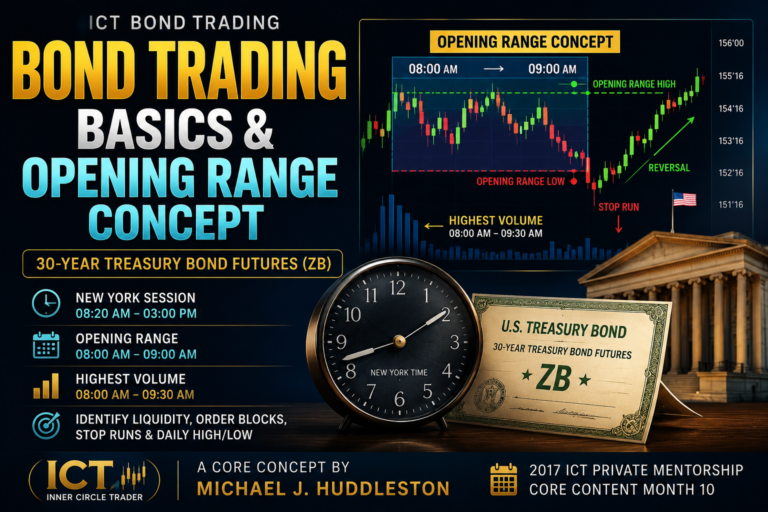
This concept is taught in the 2017 ICT Private Mentorship Core Content Month 10.
The AM Trend is the directional move or price swing that commonly develops between the opening of the US equity market and the beginning of New York Lunch. It may continue the overnight direction or completely reverse the move established during the London session.
As Michael J. Huddleston explains:
“Between the open at 9:30 a.m. and noon New York time, there is typically a trend or price swing daily.”
The objective is not to enter immediately at 09:30. The trader first studies liquidity, price location and Index SMT Divergence to determine whether the morning swing is likely to move higher or lower.
What Is the Index Futures AM Trend?
The Index Futures AM Trend is the primary morning price swing that develops during the New York equity session.
The official AM session is defined as:
09:30 to 12:00 New York time
The most important portion usually occurs between:
09:30 and 10:30 New York time
During this window, the market frequently establishes the true daily high or low.
The AM Trend may then continue until:
- 10:30
- 11:00
- Noon
The move may end earlier if price reaches its expected liquidity objective or completes a large portion of the daily range.
The AM Trend may appear as:
- A continuation of the overnight move
- A reversal of the London session
- A liquidity sweep followed by expansion
- A move from Discount to Premium
- A move from Premium to Discount
Main AM Trend Time Windows
The ICT framework separates the morning into several useful periods.
Overnight and London Session
The overnight session establishes important liquidity and institutional reference points.
The trader should mark:
- London high
- London low
- Overnight high
- Overnight low
- Fair value gaps
- Order blocks
- Liquidity voids
- Relative equal highs
- Relative equal lows
These levels may be targeted after the equity market opens.
05:00 to 09:30 New York Time
This four-and-a-half-hour period is important for identifying Index SMT Divergence.
The trader compares relative highs or lows across the major US stock indices.
The comparison does not need to begin exactly at 05:00 or end precisely at 09:30.
The highs or lows may form at:
- 06:00
- 07:00
- 08:30
- 09:00
- The 09:30 open
The entire period acts like a scouting window.
09:30 New York Equity Open
The equity market officially opens at 09:30.
This is when the Index Futures AM Trend begins.
The open may produce:
- A liquidity sweep
- A Turtle Soup setup
- A Judas swing
- A return to an order block
- A fair value gap entry
- Immediate displacement
- A reversal of the overnight direction
09:30 to 10:30
The true daily high or low commonly forms during this hour.
This is often the most active part of the morning session.
10:30 to 12:00
The morning move may continue, retrace or begin consolidating.
The AM Trend can end between 10:30 and 11:00, but traders should allow for continuation into noon.
Why the 09:30 Open Matters
The 09:30 New York open brings a major increase in liquidity and participation.
This is when:
- The cash stock market opens
- Institutional equity orders enter
- Index futures volume increases
- Overnight positions are repriced
- Buy-side and sell-side liquidity are attacked
- Correlation differences between indices become more visible
Price frequently moves toward an overnight liquidity pool before establishing the real morning direction.
For example, a bullish day may begin with a brief decline below an overnight low.
That decline may:
- Trigger sell stops
- Enter a bullish order block
- Complete a fair value gap
- Create Index SMT Divergence
- Form the low of the day
Price may then expand higher throughout the AM session.
AM Trend Continuation Profile
The AM Trend can continue the direction established overnight.
A bullish continuation may include:
- London establishes bullish structure.
- Price retraces before 09:30.
- The equity open trades into a Discount PD Array.
- A bullish order block supports price.
- Index SMT confirms accumulation.
- Price expands higher through the AM session.
A bearish continuation may include:
- London establishes bearish structure.
- Price retraces before 09:30.
- The equity open trades into a Premium PD Array.
- A bearish order block resists price.
- Index SMT confirms distribution.
- Price expands lower through the AM session.
The overnight direction alone is not enough.
The trader still needs confirmation from institutional order flow and correlated index behaviour.
AM Trend Reversal Profile
The AM Trend may also completely reverse the overnight direction.
For example, London may trade lower while the New York open creates a bullish reversal.
A bullish reversal may develop when:
- London trades lower.
- Sell-side liquidity forms below overnight lows.
- Price sweeps that liquidity near 09:30.
- One index makes a lower low while others refuse to confirm.
- Price enters a bullish PD Array.
- Bullish displacement begins.
- The AM Trend expands higher.
A bearish reversal may develop when:
- London trades higher.
- Buy-side liquidity forms above overnight highs.
- Price sweeps that liquidity near 09:30.
- One index makes a higher high while others refuse to confirm.
- Price enters a bearish PD Array.
- Bearish displacement begins.
- The AM Trend expands lower.
This reversal structure often resembles the Power of Three:
- Accumulation
- Manipulation
- Distribution
Index SMT Divergence
Index SMT Divergence compares the correlated behaviour of major stock indices.
The primary indices are:
- NASDAQ futures
- Dow futures
- S&P 500 futures
These markets usually move in general agreement.
When one index fails to confirm the high or low made by another, the disagreement may reveal institutional accumulation or distribution.
Huddleston describes this as a visible “crack in correlation.”
Bullish Index SMT Divergence
When institutional order flow is bullish, compare relative lows across the indices.
A bullish divergence appears when:
- One index makes a lower low
- One or two related indices form higher lows
- The markets should normally decline together
- The failure to confirm shows underlying accumulation
For example:
- NASDAQ makes a lower low
- Dow forms a higher low
- S&P 500 forms a higher low
The NASDAQ decline may be a stop run rather than genuine bearish continuation.
The index making the lower low becomes the primary candidate for:
- Turtle Soup long
- Stop-run reversal
- Fast bullish expansion
- Repricing toward buy-side liquidity
As Huddleston explains:
“When it’s bullish, one index is going to fail to make a lower low.”
This failure confirms that Smart Money may be accumulating beneath the market.
Bearish Index SMT Divergence
When institutional order flow is bearish, compare relative highs across the indices.
A bearish divergence appears when:
- One index makes a higher high
- One or two related indices fail to confirm
- The indices should normally rise together
- The failure reveals underlying distribution
For example:
- NASDAQ makes a higher high
- Dow forms a lower high
- S&P 500 forms a lower high
The higher high in NASDAQ may be a buy-stop run.
The index making the higher high may then reverse aggressively lower.
Why the 05:00 to 09:30 Window Is Used
The Index SMT study begins around 05:00 New York time because European and UK traders remain active.
After the London morning session, traders may return from lunch and begin allocating money into US index futures.
Large institutional flows can enter between:
- 05:00
- 06:00
- 07:00
- 08:30
- 09:30
These flows may cause one index to behave differently from the others.
The divergence becomes a clue that the apparent move in one index may not be supported by the broader equity complex.
The trader should constantly compare relative highs and lows during this period.
However, the divergence should be obvious.
Huddleston warns:
“When it’s not obvious, assume it’s not there.”
Traders should not force a divergence by comparing insignificant price points.
Institutional Order Flow Comes First
Index SMT Divergence must be interpreted within the context of institutional order flow.
Before looking for bullish SMT, the trader should already have reasons to expect higher prices.
Bullish evidence may include:
- Daily Discount Array
- Four-hour bullish order block
- Bullish fair value gap
- Sell-side liquidity sweep
- Bullish market structure
- Higher-time-frame draw on buy-side liquidity
Before looking for bearish SMT, the trader should already have reasons to expect lower prices.
Bearish evidence may include:
- Daily Premium Array
- Four-hour bearish order block
- Bearish fair value gap
- Buy-side liquidity sweep
- Bearish market structure
- Higher-time-frame draw on sell-side liquidity
SMT divergence confirms the narrative.
It should not create the entire narrative by itself.
Bullish Order Blocks in the AM Trend
A bullish order block is generally represented by the final down-close candle or series of down-close candles before a meaningful bullish displacement.
During the AM Trend, price may retrace into a bullish order block near the 09:30 open.
The setup becomes stronger when:
- The order block is below equilibrium
- Sell-side liquidity has been taken
- Index SMT is bullish
- Institutional order flow is bullish
- Price rejects the order block quickly
- Displacement leaves a fair value gap
A common sequence is:
- Price declines at the New York open.
- It trades into a previous down-close candle.
- Sell stops are triggered.
- Price rejects the order block.
- Bullish displacement begins.
- The AM Trend continues higher.
Bearish Order Blocks in the AM Trend
A bearish order block is generally represented by the final up-close candle or series of up-close candles before a meaningful bearish displacement.
During a bearish AM setup, price may rally into a bearish order block.
The setup becomes stronger when:
- The order block is above equilibrium
- Buy-side liquidity has been taken
- Index SMT is bearish
- Institutional order flow is bearish
- Price rejects the order block
- Displacement leaves a bearish fair value gap
Price can then expand lower during the AM session.
Fair Value Gaps
Fair value gaps are commonly used as entry and support or resistance points during the AM Trend.
A bullish fair value gap may form after upward displacement.
Price may retrace into the imbalance and continue higher.
A bearish fair value gap may form after downward displacement.
Price may retrace into the imbalance and continue lower.
The AM session may also fill a fair value gap created during the London session.
A valid fair value gap is not based only on candle wicks.
Huddleston emphasizes that efficient trading requires the candle bodies to cross through the area. If only wicks overlap, an imbalance may still remain.
Bullish Breakers
A bullish breaker can form when a previous bearish structure fails and price later uses that area as support.
During the London session, price may run below lows and create what initially appears to be bearish continuation.
If the market later reverses higher, the final bearish structure may become a bullish breaker.
At the 09:30 open, price can retrace into this breaker and expand higher.
The bullish breaker becomes especially meaningful when:
- Overnight lows have been taken
- Institutional order flow is bullish
- Dow and S&P refuse to confirm a NASDAQ lower low
- The AM session begins near the breaker
Turtle Soup in the AM Trend
A Turtle Soup setup trades against a false breakout of an old high or low.
Bullish Turtle Soup
A bullish Turtle Soup may occur when:
- Price trades below an old low.
- Sell stops are triggered.
- Related indices do not confirm the lower low.
- Price quickly reclaims the level.
- The AM Trend expands higher.
Bearish Turtle Soup
A bearish Turtle Soup may occur when:
- Price trades above an old high.
- Buy stops are triggered.
- Related indices do not confirm the higher high.
- Price falls back below the level.
- The AM Trend expands lower.
Index SMT provides the confidence to act on the false breakout.
Two AM Trend Entry Techniques
ICT presents two broad ways to enter an Index Futures AM Trend setup.
Buying or Selling Weakness
In a bullish setup, the trader may buy below an old low after a liquidity sweep.
This is the Turtle Soup approach.
The trader is buying weakness at sell-side liquidity.
In a bearish setup, the trader may sell above an old high after a buy-stop run.
This means selling strength at buy-side liquidity.
Buying or Selling Strength
A trader may also enter after price confirms displacement.
In a bullish setup, a buy stop may be placed above:
- A down-close candle
- A short-term high
- A displacement candle
- A market structure level
In a bearish setup, a sell stop may be placed below:
- An up-close candle
- A short-term low
- A bearish displacement candle
- A market structure level
This technique waits for momentum to confirm the expected direction.
Neither method is automatically superior.
The correct choice depends on the trader’s execution model and risk tolerance.
Which Index Should Be Traded?
When a bullish Index SMT Divergence appears, the index that sweeps the low may provide the fastest reaction.
For example:
- NASDAQ makes a lower low
- Dow and S&P hold higher lows
- NASDAQ quickly reverses
The index that takes the stops may reprice faster because the market wants to move away from the manipulated level.
However, faster movement does not always mean the largest total move.
The indices that maintained relative strength may also rally strongly.
The trader can select the index based on:
- Liquidity
- Volatility
- Entry quality
- Stop distance
- Personal familiarity
- Higher-time-frame structure
Bullish Index Futures AM Trend Model
A bullish AM Trend may develop as follows:
- Higher-time-frame institutional order flow is bullish.
- Price trades within a Discount PD Array.
- Overnight lows or London lows form sell-side liquidity.
- Between 05:00 and 09:30, the three indices trade lower.
- One index makes a lower low.
- The other indices hold higher lows.
- The weak index sweeps sell-side liquidity near 09:30.
- Price trades into a bullish order block or fair value gap.
- Bullish displacement forms.
- The trader enters through Turtle Soup or a buy-stop technique.
- Price expands toward buy-side liquidity.
- The AM high forms between 10:30 and noon.
Bearish Index Futures AM Trend Model
A bearish AM Trend may develop as follows:
- Higher-time-frame institutional order flow is bearish.
- Price trades within a Premium PD Array.
- Overnight highs or London highs form buy-side liquidity.
- Between 05:00 and 09:30, the indices trade higher.
- One index makes a higher high.
- The other indices form lower highs.
- The strong-looking index sweeps buy-side liquidity.
- Price trades into a bearish order block or fair value gap.
- Bearish displacement forms.
- The trader enters through Turtle Soup or a sell-stop technique.
- Price expands toward sell-side liquidity.
- The AM low forms between 10:30 and noon.
AM Trend Profit Objectives
The AM Trend should have a clear liquidity objective.
Bullish targets may include:
- London high
- Overnight high
- Previous-day high
- Relative equal highs
- Short-term buy-side liquidity
- Fair value gap
- Daily Premium Array
Bearish targets may include:
- London low
- Overnight low
- Previous-day low
- Relative equal lows
- Short-term sell-side liquidity
- Fair value gap
- Daily Discount Array
The trader should avoid holding beyond the logical morning objective without a clear reason.
The AM Trend frequently slows as New York Lunch approaches.
When the AM Trend Ends
The AM Trend may end around:
- 10:30
- 11:00
- Noon
Signs that the morning swing may be complete include:
- A major liquidity target has been reached
- Price trades into a higher-time-frame opposing PD Array
- Displacement weakens
- Candles begin overlapping
- Index correlation becomes less clear
- Most of the expected daily range has been completed
- Price enters New York Lunch consolidation
A trader should not assume the morning trend will continue throughout the entire day.
The PM session may continue, reverse or consolidate the AM move.
BarChart Time-Zone Adjustment
Historical index futures charts on some platforms may display Central Time rather than New York time.
For example:
- 08:30 Central Time equals 09:30 New York time
- 11:00 Central Time equals noon New York time
- 04:00 Central Time equals 05:00 New York time
Traders must confirm the platform’s chart time zone before conducting historical studies.
Otherwise, the AM Trend window may be marked incorrectly.
How to Study the AM Trend
Huddleston recommends studying a large sample of historical intraday data.
Traders can review:
- NASDAQ futures
- Dow futures
- S&P 500 futures
- DAX futures
- FTSE futures
For each day, mark:
- London high and low
- 05:00 to 09:30 relative highs and lows
- 09:30 equity open
- AM Trend high and low
- Order blocks
- Fair value gaps
- Index SMT Divergence
- Liquidity sweep
- Directional expansion
- Time when the AM move ended
The purpose is to train the eye to recognise recurring behaviour.
A few isolated examples are not enough.
Common AM Trend Mistakes
Entering Immediately at 09:30
The equity open may first manipulate liquidity.
Wait for the setup rather than assuming immediate continuation.
Ignoring the Other Indices
A trade based on only one index may miss the correlation signal.
Compare NASDAQ, Dow and S&P 500.
Forcing SMT Divergence
The divergence should be obvious.
Do not search for tiny differences between insignificant highs or lows.
Ignoring Institutional Order Flow
SMT does not replace higher-time-frame analysis.
The directional bias must come first.
Comparing Only 05:00 and 09:30 Candles
The relevant highs or lows can form anywhere within the entire four-and-a-half-hour window.
Trading Every Divergence
Small SMT differences may produce only small moves.
Look for alignment with liquidity and PD Arrays.
Holding Through New York Lunch
The AM Trend often ends before or around noon.
Avoid assuming that morning momentum must continue indefinitely.
Confusing Speed With Magnitude
The index that runs stops may reverse fastest, but it may not always produce the largest total move.
Index Futures – AM Trend Checklist
Before trading the AM Trend, confirm:
- What is the higher-time-frame institutional order flow?
- Is price in Premium or Discount?
- Where are the London high and low?
- Where are the overnight highs and lows?
- What liquidity exists near the 09:30 open?
- Have I compared NASDAQ, Dow and S&P 500?
- Is there an obvious Index SMT Divergence?
- Am I comparing the correct highs or lows?
- Has one index failed to confirm the others?
- Has price swept buy-side or sell-side liquidity?
- Is there a valid order block, breaker or fair value gap?
- Has displacement confirmed the direction?
- Is the entry based on weakness or strength?
- What is the nearest logical liquidity target?
- Has the AM Trend already completed most of its move?
- Am I approaching the New York Lunch period?
Final Thoughts
Index Futures – AM Trend provides a time-based framework for studying the main morning move in US stock index futures.
The AM session runs from:
09:30 to 12:00 New York time
The true daily high or low frequently forms between:
09:30 and 10:30 New York time
The strongest setups appear when several factors align:
- Higher-time-frame institutional order flow
- Premium or Discount location
- Overnight liquidity
- A 09:30 liquidity sweep
- Index SMT Divergence
- Order block or fair value gap
- Clear displacement
- A defined liquidity objective
The comparison between NASDAQ, Dow and S&P 500 futures helps reveal whether a breakout is genuine or simply a stop run.
When the broader outlook is bullish and one index makes a lower low while the others refuse to confirm, the weak index may be creating a Turtle Soup opportunity.
When the outlook is bearish and one index makes a higher high while the others refuse to confirm, the apparent strength may represent buy-side liquidity manipulation.
As Michael J. Huddleston explains:
“Significant trading opportunities will always have this hallmark to it.”
The purpose of the AM Trend model is not to trade every opening move. It is to patiently identify when time, liquidity, correlation and institutional order flow agree, allowing the trader to participate in the most probable morning price swing.
All examples and concepts discussed here are for educational and paper-trading purposes. Index futures trading involves substantial risk, and no time-based or divergence model can guarantee future results.