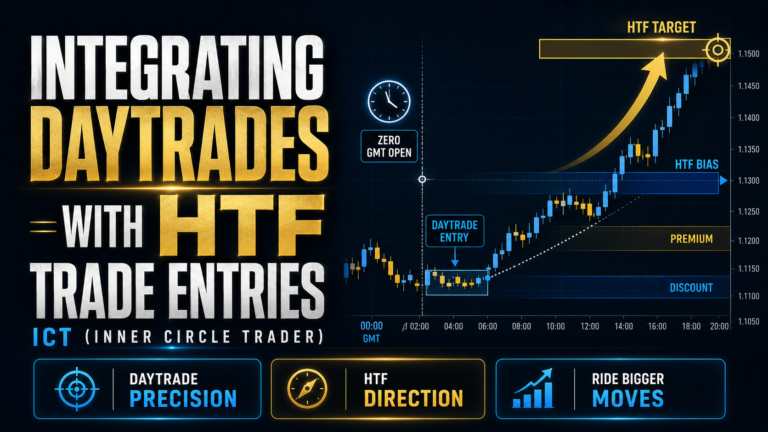
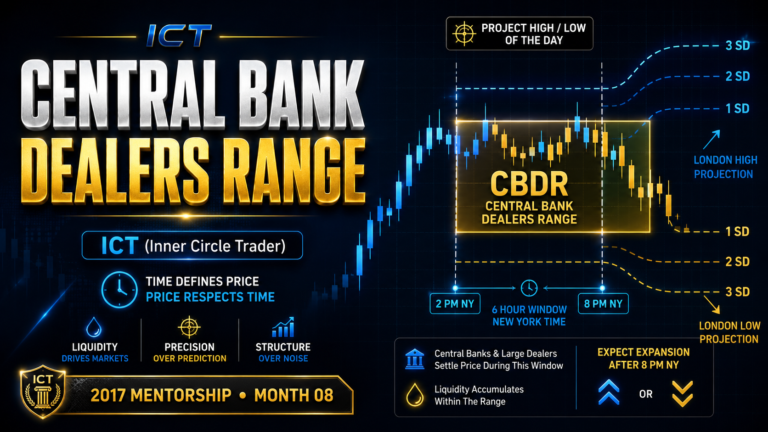
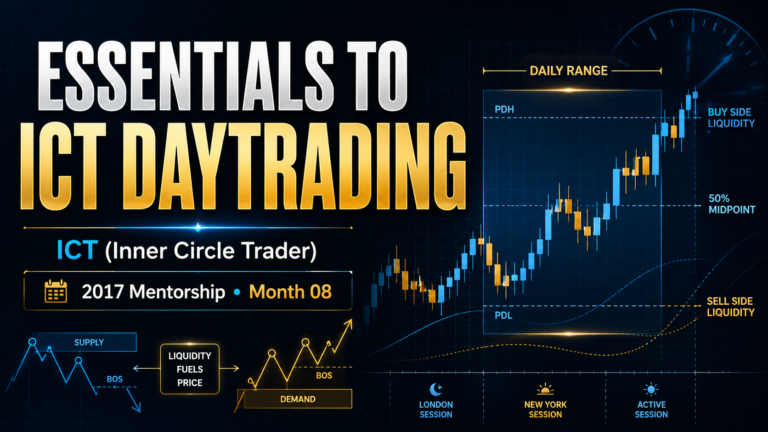
Defining The Daily Range is one of the foundational lessons in the ICT day trading model developed by Michael J. Huddleston, the founder of ICT (Inner Circle Trader). This concept is taught in the 2017 ICT Private Mentorship Core Content Month 08.
The daily range should not be viewed simply as the movement between a broker’s midnight separators. ICT defines the trading day using specific New York time windows that reflect how institutional price delivery operates.
By understanding these time windows, traders can better anticipate where the daily high, daily low, manipulation, expansion, and closing price may develop.
“There are very, very specific time elements being shown here.”
— Michael J. Huddleston
What Is the Daily Range?
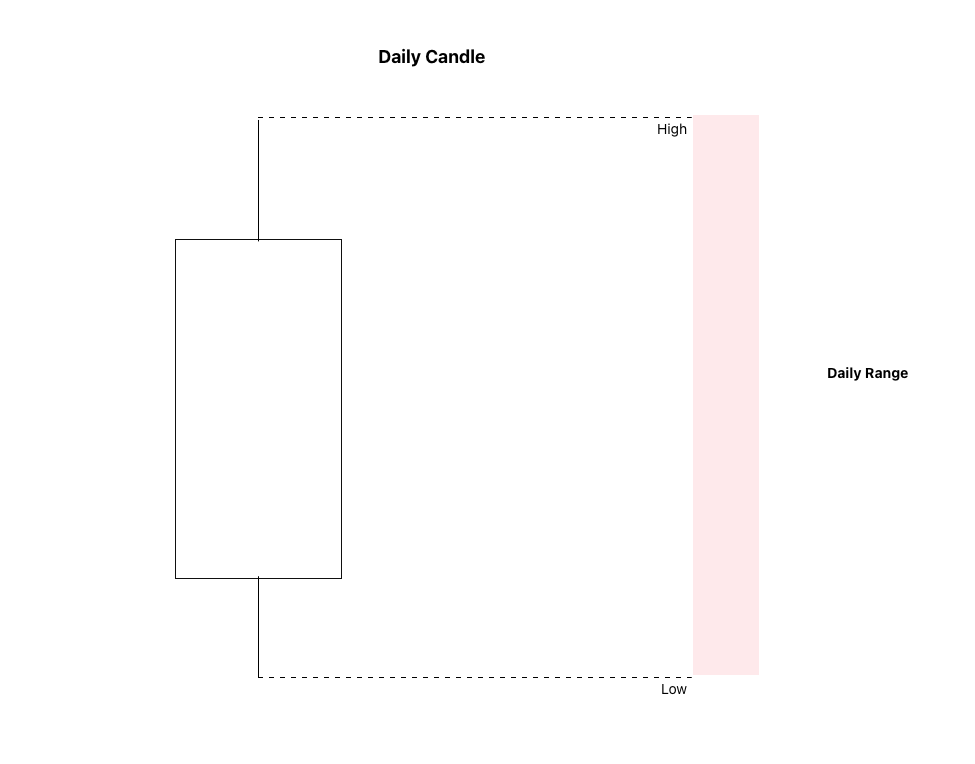
The daily range is the complete price movement between the significant high and low formed during the trading day.
It contains four basic elements:
- Daily open
- Daily high
- Daily low
- Daily close
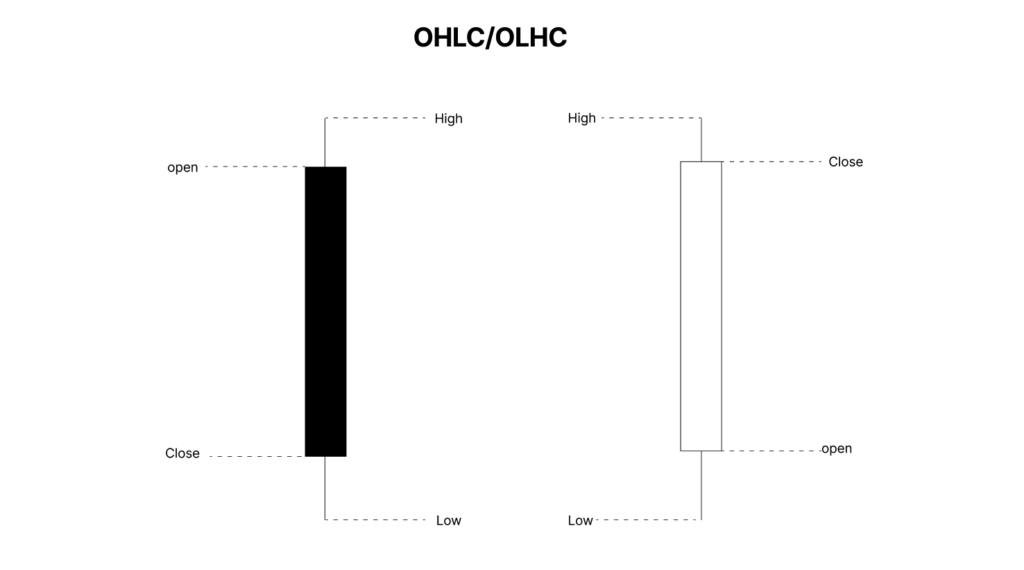
However, Defining The Daily Range involves more than identifying these four prices after the day has ended. The objective is to study how the range develops during specific institutional trading windows.
ICT traders examine:
- Where the day opens
- When manipulation is likely to occur
- Which session may form the daily high or low
- Where price is likely to expand
- When the day’s major movement is likely to end
Time provides the framework, while liquidity, institutional order flow, and PD Arrays provide the price references.
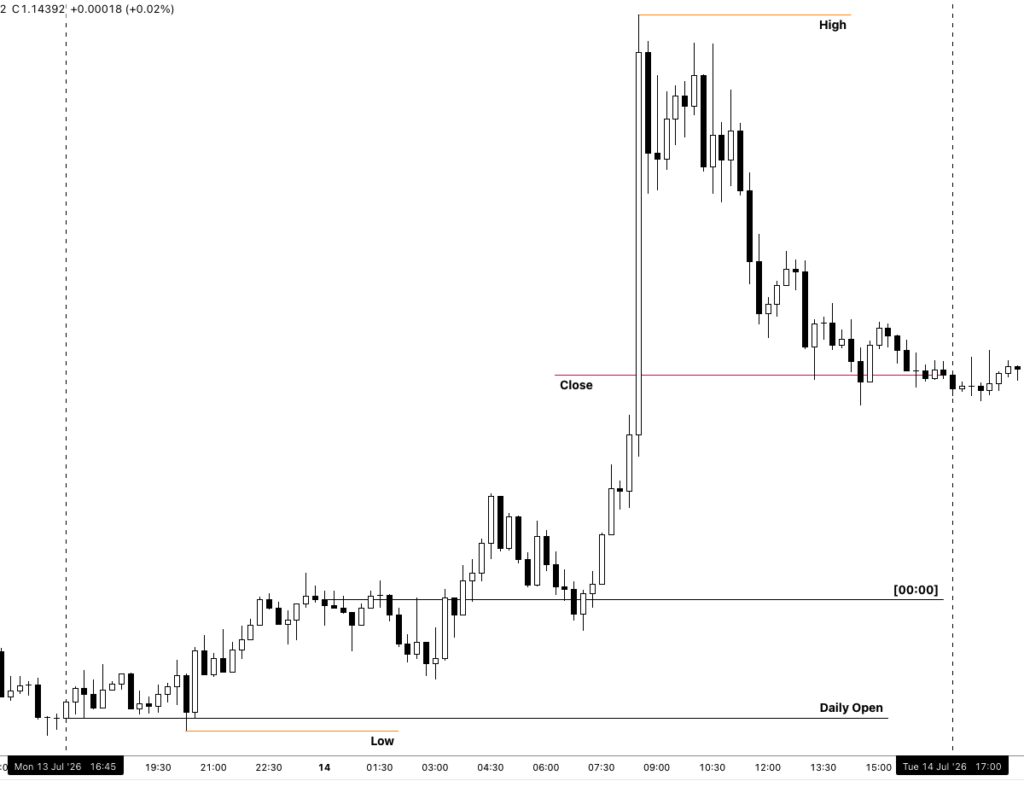
The Retail Trading Day vs the ICT True Day
Most retail trading platforms divide the chart according to the broker’s server time. These daily separators may not begin at midnight New York time.
As a result, two traders using different brokers may see different daily candles, opens, highs, lows, and closes.
ICT does not rely on these broker-defined periods.
Instead, Michael J. Huddleston teaches traders to frame price according to New York local time. The chart should follow the current time in New York, including daylight-saving adjustments.
This creates a consistent reference point for studying institutional price delivery.
ICT True Day Time Range
The ICT True Day begins at:
- 00:00 New York time
The active True Day framework ends at:
- 15:00 New York time
The midnight opening price becomes an important reference for analyzing the daily range.
The 15:00 closing point is important because the bond market has closed by this time, reducing the influence of interest rates on currency prices. Major price movement associated with FOMC announcements or interest-rate events is also generally completed or significantly developed by 15:00.
When ICT refers to the New York close within this model, it generally means the 15:00 True Day close.
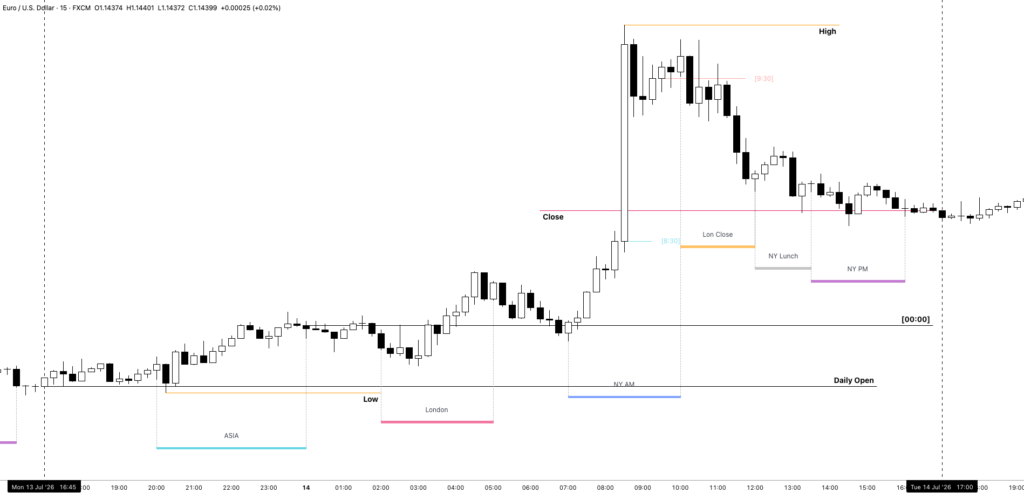
Asian Range
The ICT Asian Range is measured from:
- 20:00 to 00:00 New York time
This range forms before the ICT True Day begins at midnight.
Traders should mark:
- Asian Range high
- Asian Range low
- Asian Range midpoint
- Liquidity resting above the high
- Liquidity resting below the low
The Asian session frequently establishes an initial consolidation range. Later sessions may raid one side of this range before delivering the main directional move.
A break above or below the Asian Range should not automatically be treated as a valid breakout. It may represent a liquidity raid designed to facilitate institutional buying or selling.
ICT London Kill Zone
The ICT London Kill Zone runs from:
- 01:00 to 05:00 New York time
This is one of the most important periods for Defining The Daily Range.
During this window, price may:
- Raid the Asian Range high
- Raid the Asian Range low
- Create the daily high
- Create the daily low
- Begin the primary expansion of the day
- Establish the direction carried into New York
The daily high or low can form near the beginning or end of the London Kill Zone. Traders should therefore study price throughout the entire 01:00 to 05:00 window rather than focusing on only one specific hour.
A London move should also be evaluated against the higher-timeframe bias, institutional order flow, liquidity objectives, and nearby PD Arrays.
London Lunch
London Lunch occurs between the London and New York Kill Zones, generally around:
- 05:00 to 07:00 New York time
This period often produces quieter price action.
The market may:
- Consolidate
- Retrace slightly
- Continue slowly in the London direction
- Prepare liquidity for the New York session
Traders should generally avoid expecting major expansion during London Lunch unless unusual volatility or an important economic event is present.
The purpose of identifying this period is to prevent overtrading during a time when price may become less efficient or less directional.
ICT New York Kill Zone
The ICT New York Kill Zone runs from:
- 07:00 to 10:00 New York time
This window frequently delivers another major portion of the daily range.
During the New York Kill Zone, price may:
- Continue the London expansion
- Reverse the London move
- Raid a London session high or low
- Form the opposing daily extreme
- Reach a higher-timeframe liquidity objective
- Deliver the main setup of the trading day
For example, London may form the daily high before New York sells lower. In a bullish scenario, London may form the daily low before New York expands higher.
The relationship between London and New York is therefore essential. Traders should not study the New York session in isolation.
The 08:20 CME Open
The 08:20 New York time CME open is another important reference within the New York Kill Zone.
Price can form a short-term high or low around this opening time before expanding in the intended direction.
Traders should mark 08:20 on their charts and observe whether it aligns with:
- A liquidity sweep
- A Fair Value Gap
- An Order Block
- An institutional swing point
- A premium or discount price level
- A higher-timeframe PD Array
The time itself is not a trade signal. It becomes useful when price reaches a meaningful location and confirms the expected directional bias.
As Michael J. Huddleston explains when discussing these precisely timed reactions:
“That is not randomness.”
ICT London Close Kill Zone
The ICT London Close Kill Zone runs from:
- 10:00 to 12:00 New York time
This period may create:
- A retracement against the morning move
- A profit-taking reversal
- The final daily high
- The final daily low
- A consolidation after the main expansion
- A move into a predetermined liquidity objective
When London and New York produce a strong directional move, London Close may retrace part of that expansion.
In other cases, the London Close Kill Zone may complete the day’s liquidity objective and establish the final extreme of the daily range.
Traders entering during this period should understand that much of the day’s movement may already have occurred.
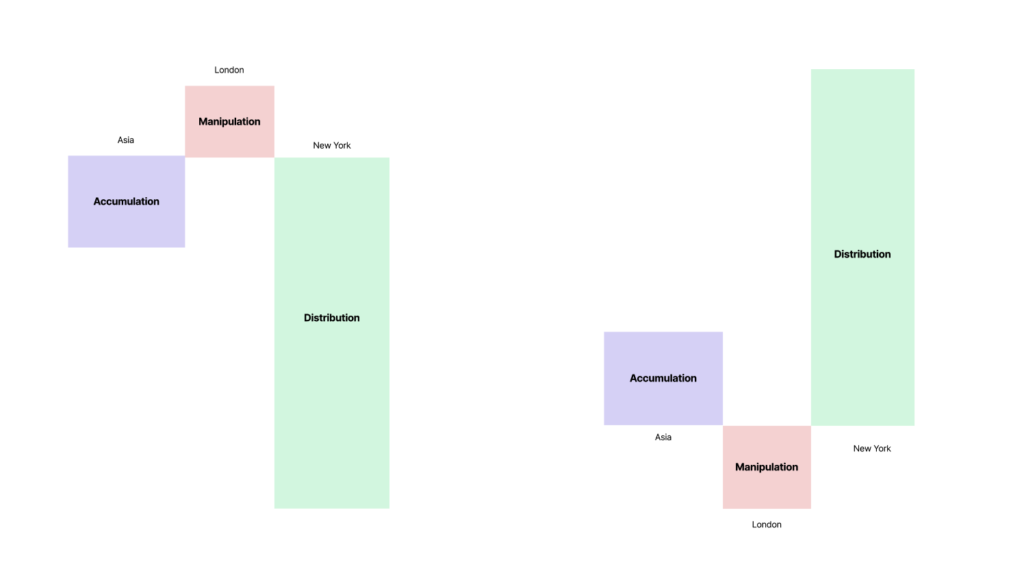
Using Power of Three to Define the Daily Range
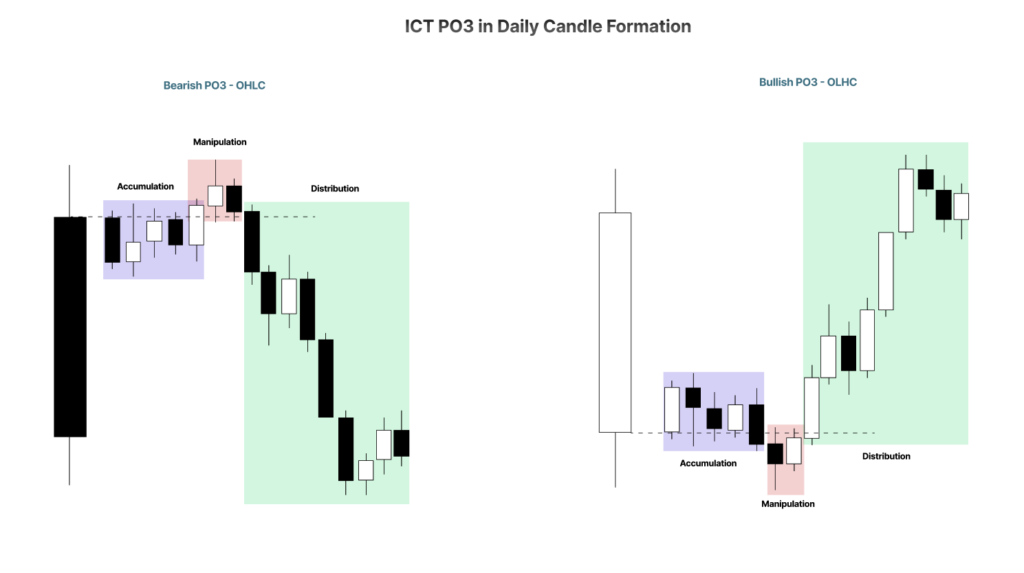
The ICT Power of Three model describes three stages of price delivery:
- Accumulation
- Manipulation
- Distribution
The midnight opening price provides a reference for studying these stages.
In a bullish daily profile:
- Price opens at midnight
- Price may trade below the opening price
- Sell-side liquidity is taken
- Price expands higher
- The daily high forms during London, New York, or London Close
In a bearish daily profile:
- Price opens at midnight
- Price may trade above the opening price
- Buy-side liquidity is taken
- Price expands lower
- The daily low forms during London, New York, or London Close
The initial movement against the expected direction may be the manipulation phase rather than a genuine directional move.
This is why traders should not determine daily bias from the first movement after midnight alone.

How to Mark the Daily Range on a Chart
Use a chart set to New York local time and mark the following levels and windows:
- Mark the 20:00 Asian Range opening time.
- Draw the Asian Range high and low between 20:00 and 00:00.
- Mark the 00:00 True Day opening price.
- Highlight the London Kill Zone from 01:00 to 05:00.
- Recognize London Lunch from approximately 05:00 to 07:00.
- Highlight the New York Kill Zone from 07:00 to 10:00.
- Mark the 08:20 CME open.
- Highlight the London Close Kill Zone from 10:00 to 12:00.
- Mark the ICT True Day close at 15:00.
- Record where the daily high and daily low formed.
After repeating this process across several weeks of price action, traders can begin recognizing recurring relationships between time, liquidity, and daily range formation.
How to Trade With the Daily Range Framework
Defining The Daily Range does not mean entering trades simply because a Kill Zone has started.
Before considering a trade, determine:
- Higher-timeframe directional bias
- Current institutional order flow
- Draw on liquidity
- Premium or discount location
- Relevant PD Arrays
- Whether the Asian Range has been raided
- Whether London has already formed a significant extreme
- Whether New York is likely to continue or reverse London
- How much of the expected daily range has already been delivered
A high-probability setup forms when time and price support the same narrative.
For example, a bullish setup may develop when:
- Higher-timeframe order flow is bullish
- Price trades below the midnight open
- Sell-side liquidity is taken
- Price enters a discount PD Array
- Bullish displacement appears during a Kill Zone
- Buy-side liquidity remains available above the market
The daily range framework helps the trader understand when this setup is most likely to appear.
Important Rules for Defining The Daily Range
- Always use New York local time.
- Do not rely on the broker’s default daily separators.
- Treat the midnight opening price as a major reference.
- Mark both sides of the Asian Range.
- Expect important highs and lows during Kill Zones.
- Do not assume every session will produce a reversal.
- Combine time with liquidity and PD Arrays.
- Avoid chasing price after the majority of the daily range has formed.
- Study where the daily high and low form each day.
- Remember that a time window is not an entry signal by itself.
Daily Range Trading Checklist
Before trading, ask:
- Is my chart correctly aligned with New York time?
- Where is the midnight opening price?
- What are the Asian Range high and low?
- What is the higher-timeframe bias?
- Which liquidity pool is price likely targeting?
- Has London raided Asian liquidity?
- Did London establish a possible daily high or low?
- Is New York likely to continue or reverse the London move?
- Is price reacting from a valid PD Array?
- Has displacement confirmed institutional participation?
- Has most of the expected daily range already been completed?
- Is the setup occurring inside a valid ICT Kill Zone?
Final Thoughts
Defining The Daily Range gives ICT traders a structured way to study how price moves throughout the trading day.
The market should not be viewed as one uninterrupted 24-hour period. Each institutional time window has a different purpose within the daily price-delivery process.
The Asian Range may establish liquidity. London may create manipulation or the first expansion. New York may continue the move, reverse it, or form the opposing daily extreme. London Close may retrace the morning expansion or complete the final objective.
By combining these time windows with the midnight open, liquidity, institutional order flow, and PD Arrays, traders can develop a more precise understanding of where the daily high and daily low are likely to form.
The real value of the ICT daily range model is not predicting every movement. It is knowing when to focus, what price is likely seeking, and when the day’s primary opportunity has already passed.