ICT Liquidity Voids are important price delivery concepts taught by Michael J. Huddleston, founder of the ICT (Inner Circle Trader) methodology. A Liquidity Void forms when price moves aggressively through a range with primarily one-sided price delivery. Long or wide candles move quickly away from a consolidation, and very little opposing liquidity is seen during the move.
For example, price may move aggressively lower from a consolidation.
Several large bearish candles form.
Most of the price delivery occurs on the downside.
Very little buying takes place through the range.
The result is a void of buy-side or contrarian liquidity.
At some point in the future, price may return to the same range and move higher through it.
The previously one-sided price range is then covered by bullish price delivery.
This creates a more balanced and uniform delivery of price.
Michael J. Huddleston explains the concept in the mentorship lesson:
“A liquidity void is a range in price delivery where one side of the market liquidity is shown in wide or long one-sided ranges or candles.”
The main idea behind ICT Liquidity Voids is therefore not simply that price moved quickly.
The important part is how price was delivered through the range.
What Are ICT Liquidity Voids?
ICT Liquidity Voids are price ranges created by aggressive one-sided market movement.
Price rapidly moves through a particular range.
The movement normally appears as:
- One large displacement candle
- Several long one-sided candles
- A rapid move away from consolidation
- Limited opposing price movement
- Small gaps or inefficient pockets inside the displacement
Suppose the market is trading inside a small consolidation.
Price is in relative balance.
Buyers and sellers are participating within a limited range.
Then price suddenly moves lower.
One or several long bearish candles leave the consolidation.
The market rapidly reprices lower.
There is very little bullish price delivery inside the move.
This creates a bearish displacement and a void of buy-side liquidity.
The entire aggressive price range may be identified as an ICT Liquidity Void.
At some future time, the market may revisit the same range.
Price can then move higher through the void.
When bullish price action covers the previous bearish range, the price delivery becomes balanced.
Main Idea Behind ICT Liquidity Voids
The main idea behind an ICT Liquidity Void is one-sided price delivery.
When the market is in consolidation, price is considered relatively balanced.
The market trades back and forth.
Price is delivered in both directions.
At some point, price leaves the consolidation.
The move can be sudden and aggressive.
In ICT terminology, this aggressive repricing is displacement.
A large bearish displacement may show almost entirely downside price delivery.
A large bullish displacement may show primarily upside price delivery.
The opposite side of price delivery is limited.
This creates a porous or inefficient price range.
Michael J. Huddleston states:
“Price typically will want to revisit this porous range or void of contrarian liquidity.”
This does not mean every Liquidity Void must immediately close.
The void can remain open for a short period or a very long time.
The important point is that the range represents one-sided delivery that may later attract price.
How Do ICT Liquidity Voids Form?
An ICT Liquidity Void normally begins with price in consolidation or a trading range.
The market is relatively balanced.
Price remains within a defined area.
Then strong participation enters the marketplace.
Price aggressively leaves the consolidation.
According to the ICT framework, significant displacement indicates participation from large market interests capable of moving price.
Suppose price breaks lower.
Several long bearish candles form.
The market moves rapidly away from the consolidation.
Very little buying occurs during the move.
The price range has mainly received downside delivery.
A Liquidity Void has formed.
The basic bearish formation is:
Consolidation → Balance → Aggressive Bearish Displacement → One-Sided Downside Delivery → Liquidity Void Forms
The bullish formation is the reverse:
Consolidation → Balance → Aggressive Bullish Displacement → One-Sided Upside Delivery → Liquidity Void Forms
The speed and directional nature of the movement create the void.
Price Balance and ICT Liquidity Voids
Price balance is an important part of understanding ICT Liquidity Voids.
When price trades inside a consolidation, the market is in a form of equilibrium.
Price moves higher.
Price moves lower.
Both sides of the range receive price delivery.
The market is relatively balanced.
The condition changes when price rapidly leaves the consolidation.
A large displacement candle may move through many price levels with limited opposing movement.
The market has transitioned from balance to imbalance.
For example, a five-minute candle may aggressively move lower from a trading range.
On a five-minute chart, the movement may appear as one large bearish candle.
When the same movement is studied on a one-minute chart, several large bearish candles and small pockets inside the movement may become visible.
The complete range can show the one-sided nature of price delivery.
This one-sided range is the Liquidity Void.
Displacement and ICT Liquidity Voids
Displacement is one of the main characteristics of an ICT Liquidity Void.
Displacement is an aggressive repricing of the market.
Price quickly moves away from an area.
Long candle bodies may form.
The market covers a significant relative price distance in a short period.
The important word is relative.
A Liquidity Void does not need to move hundreds of pips.
The movement only needs to be significant compared with the price action around it.
Suppose price has been trading inside a very small consolidation.
The market then creates two or three long bearish candles.
The number of pips may not appear large on a higher time frame.
However, compared with the previous consolidation, the movement is aggressive.
That displacement may create a Liquidity Void.
One-Sided Price Delivery in a Liquidity Void
One-sided price delivery is the foundation of the ICT Liquidity Void concept.
Suppose price aggressively moves lower.
Most of the price range is covered by bearish candles.
The market is being offered on the downside.
Very little bullish price delivery is visible.
This means the range contains a void of buy-side or contrarian liquidity.
Price has travelled through the range mainly in one direction.
The opposite occurs during bullish displacement.
Large bullish candles rapidly move higher.
The range receives primarily bullish price delivery.
Very little selling takes place throughout the move.
This creates a void of sell-side or contrarian liquidity.
The market may later revisit the range to provide the missing opposing price delivery.
Bearish Displacement and Void of Buy-Side Liquidity
A strong bearish displacement creates a void of buy-side liquidity.
Price aggressively moves lower.
Large down candles form.
The market reprices away from consolidation.
There is limited buying during the decline.
Michael J. Huddleston explains:
“It was all on south side liquidity only. Very little buying took place in that rundown.”
The market has delivered price lower through the range.
However, the same price levels have not received comparable bullish delivery.
At some future time, price may move higher through the same range.
The bullish movement provides the previously missing buy-side price delivery.
Once the complete bearish range has been covered by bullish price action, the Liquidity Void has been closed.

Bullish Displacement and Void of Sell-Side Liquidity
A bullish ICT Liquidity Void follows the same logic in reverse.
Price aggressively moves higher from a consolidation or balanced range.
One or several large bullish candles form.
The market rapidly reprices higher.
Very little bearish price delivery occurs throughout the move.
The range therefore contains a void of sell-side or contrarian liquidity.
At some future time, price may return lower.
Bearish candles can move through the previous bullish displacement range.
When bearish price action covers the complete bullish void, price has been delivered through the range in both directions.
The market has balanced the previously one-sided price delivery.

How to Identify ICT Liquidity Voids on a Chart
First, find an area of consolidation.
Price should be relatively balanced.
The candles may overlap.
The market remains inside a limited trading range.
Now look for aggressive displacement away from the consolidation.
Study the candle bodies.
Are one or several long candles rapidly moving in the same direction?
Does price leave the consolidation with little opposing movement?
Has price been delivered primarily on one side of the market?
If price aggressively moves lower, study the range for an absence of bullish price delivery.
If price aggressively moves higher, look for limited bearish price delivery.
Frame the aggressive one-sided price range.
The displacement area can be identified as an ICT Liquidity Void.
The exact appearance may change depending on the chart time frame.
A void that appears as several candles on a one-minute chart may appear as one long candle on a five-minute or 15-minute chart.
ICT Liquidity Voids on Different Time Frames
The visual appearance of an ICT Liquidity Void changes with the chart time frame.
In the ICT lecture video example, the same movement is studied on one-minute, five-minute and 15-minute charts.
On the one-minute chart, the displacement shows several bearish candles.
Small pockets and gaps inside the movement are easier to see.
The complete range clearly shows aggressive downside price delivery.
On the five-minute chart, the same price movement may appear as one large bearish candle.
The one-sided nature of the move remains the same.
On the 15-minute chart, the displacement may also appear as a single long bearish range.
The important point is not the number of candles.
The trader should study the price delivery.
Was price aggressively delivered through the range in one direction?
If yes, a Liquidity Void may be present.
How Long Can an ICT Liquidity Void Stay Open?
There is no fixed time limit for an ICT Liquidity Void to close.
This is an important lesson from the mentorship video.
A Liquidity Void may close during the same intraday trading session.
It can remain open for several days.
It may remain open for weeks or months.
The duration depends on the market context and surrounding price action.
Michael J. Huddleston explains:
“They can stay open for months. They can stay open just for a brief session intraday.”
Therefore, traders should not create a fixed rule such as:
“Every Liquidity Void must fill within one day.”
The market does not follow a fixed time schedule for closing these ranges.
The trader needs to study the price action surrounding the void.
Why Does Price Return to an ICT Liquidity Void?
Price may return to an ICT Liquidity Void because the original range received one-sided price delivery.
Consider a bearish void.
Price rapidly moved lower.
The market offered the complete range on the downside.
Very little buying occurred.
The price range has not received uniform two-sided delivery.
A later bullish move can return through the same range.
The market now offers those same price levels on the upside.
Once bullish price movement covers the previous bearish displacement range, price has been delivered through the area in both directions.
The original imbalance has been balanced.
This is why the Liquidity Void can act as an important future draw on price.
What Does It Mean to Close an ICT Liquidity Void?
An ICT Liquidity Void is closed when price covers the complete one-sided displacement range in the opposite direction.
Suppose one large bearish candle creates the void.
Price has been delivered lower through the complete candle range.
At a later time, price rallies.
Bullish price action begins covering the bearish range.
The market may partially move through the void.
If price reaches the opposite boundary of the range and covers the complete displacement, the Liquidity Void is closed.
The range has now received both bearish and bullish price delivery.
Michael J. Huddleston describes this condition as:
“Price action has been balanced out.”
The market has achieved a more complete and uniform delivery of price.
Complete and Uniform Delivery of Price
Complete and uniform price delivery occurs when the market has covered a range in both directions.
A bearish Liquidity Void initially receives downside price delivery.
The market moves lower through the range.
Later, bullish price action moves higher through the same area.
The price levels have now been offered on the down move and on the buy move higher.
The void is balanced.
The bullish Liquidity Void works in reverse.
Price first moves higher through the range.
Later, bearish price action moves through the complete area.
The range receives both bullish and bearish delivery.
This two-sided delivery closes the void.
ICT Liquidity Voids as a Draw on Price
An open Liquidity Void can become a potential draw on price.
Suppose a bearish displacement creates a void above the current market.
Price is now trading below the Liquidity Void.
If the broader price narrative supports higher prices, the top of the void may become a logical objective.
The market can trade higher through the range.
The ultimate draw may be the price level that completely closes the Liquidity Void.
In the mentorship example, the upper boundary of the bearish void became the important objective.
Price made several movements on both sides of the market.
However, the larger draw remained the closure of the Liquidity Void.
This helps traders separate short-term market movements from the larger price objective.
Liquidity Runs Before a Void is Closed
Price does not always move directly towards a Liquidity Void.
The market may first seek another liquidity pool.
For example, a bearish displacement leaves a Liquidity Void above price.
Short-term support forms below the current market.
Several lows may develop.
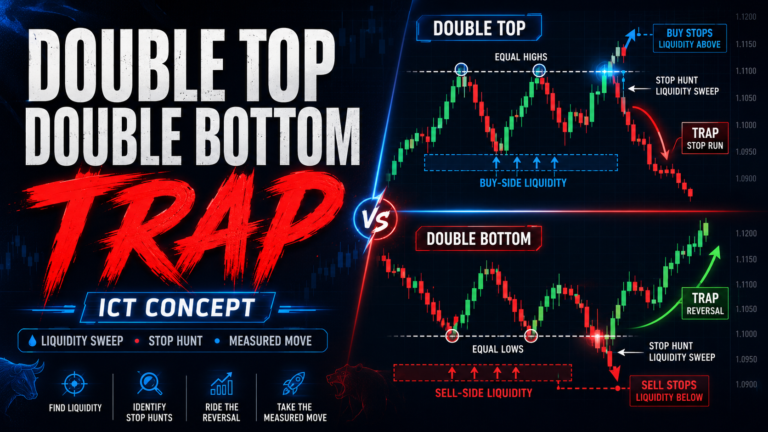
Sell stops can accumulate below these lows.
If the broader price narrative supports movement higher to close the void, the market may first trade below the short-term lows.
The sell stops are taken.
Price then moves higher.
This sell-side liquidity can be used before the market drives towards the Liquidity Void.
In the ICT lecture video example, price ran sell stops before expanding higher to close the void.
The liquidity run was therefore part of the price movement towards the larger objective.
Sell-Side Liquidity and ICT Liquidity Void Closure
Suppose a bearish Liquidity Void exists above the current price.
The market has a potential draw higher.
Below price, equal lows or short-term lows form.
Sell stops are expected below these lows.
The market trades lower and runs the sell stops.
After taking the sell-side liquidity, price begins moving higher.
The market then expands towards the Liquidity Void.
This creates a possible bullish trade narrative:
Bearish Liquidity Void Above → Sell Stops Form Below → Sell-Side Liquidity Raid → Price Expands Higher → Liquidity Void Closed
The liquidity run can provide the price movement needed before the market seeks the larger upside objective.
Buy-Side Liquidity and Bullish Liquidity Void Closure
The opposite model can occur with a bullish Liquidity Void below price.
Price aggressively moves higher and leaves a one-sided bullish range.
The open void remains below the market.
Short-term highs or equal highs may form above current price.
Buy stops accumulate above these highs.
The market may first trade higher and take buy-side liquidity.
After the buy stops are taken, price can reprice lower.
The market then delivers bearish price action through the previous bullish Liquidity Void.
The complete range may eventually be closed.
The model is:
Bullish Liquidity Void Below → Buy Stops Form Above → Buy-Side Liquidity Raid → Price Reprices Lower → Liquidity Void Closed
The same ICT price delivery logic is applied in reverse.
Do ICT Liquidity Voids Always Fill Completely?
No.
A Liquidity Void does not always immediately close on the first attempt.
Price may trade partially into the void.
The market can then move away.
Price may return to a liquidity pool.
Another liquidity run can occur.
The market may then make another attempt to move through the void.
In the mentorship example, price initially moved towards the Liquidity Void but did not completely close it.
The market returned lower.
Liquidity was taken again.
Price then moved higher and closed the remaining portion of the void.
Therefore, traders should not always expect a direct single movement through the complete range.
The larger market narrative remains important.
ICT Liquidity Void and Common Gap
The Liquidity Void lesson also discusses a common gap that forms after the larger void has been closed.
A common gap occurs when one candle closes and the next candle opens at another price, leaving a small separation between the candle bodies.
There is a price area where the bodies do not close the range.
This smaller gap can provide a specific trade reference.
In the bearish example from the lesson, the larger Liquidity Void had already been closed.
Price had made repeated movements into the higher objective.
Then bearish candles appeared.
One candle gapped lower.
The small gap showed aggressive bearish price willingness.
Because the larger narrative supported lower prices, the common gap was used as a potential selling area.
How ICT Uses a Common Gap for Entry
Suppose the broader market narrative is bearish.
Price has already closed a previous Liquidity Void above.
The market shows a willingness to move lower.
A small common gap forms between candle bodies.
The trader can identify the price inside the gap.
A sell limit order may be placed at a specific price within the range.
When price retraces higher, it closes the common gap.
The candle body covers the gap.
Price then quickly responds lower.
In the mentorship example, the body closure was sufficient.
Price wicked slightly into the area, but a full deeper retracement was not required.
The reaction showed very little drawdown and immediate bearish repricing.
Candle Bodies and Common Gap Closure
Candle bodies are important when studying the common-gap example in the ICT Liquidity Void lesson.
Price does not always need to drive deeply through the entire candle range.
The important gap may exist between the bodies.
Suppose one bearish candle closes at a price.
The next candle opens lower.
There is a visible separation between the candle bodies.
Price later retraces higher.
An up candle body closes the small gap.
The wick may move slightly beyond the body reference.
However, once the candle body has delivered through the common gap, the range may be considered covered for the trade idea used in the example.
Price can then respond in the expected direction.
ICT Liquidity Voids and Institutional Price Levels
The mentorship example also discusses institutional price levels.
Price may aggressively move away from a specific institutional-level reference.
For example, a price ending around a large figure or institutional increment may become important in the market narrative.
The Liquidity Void forms as price rapidly moves away from the area.
Later, price gradually works back towards the original level.
The market may make more than one pass into the range.
This repeated price interaction can be studied as part of the larger price delivery process.
The important lesson is that large positions may not be priced in during one single market pass.
Price can return to a reference area more than once before the next major movement develops.
Repeated Price Runs After a Liquidity Void
A Liquidity Void may be closed more than once around the same larger price objective.
In the ICT lecture video example, price traded into the upper area of the void.
Later, price returned and traded slightly higher than the previous attempt.
The second run reached above the first price movement.
After this second interaction, bearish price action developed.
The repeated movement into the area provided additional information about the market’s willingness to move lower.
Traders should therefore study what price does after a Liquidity Void closes.
The closure itself is not always the final trading signal.
The market reaction after balancing the range is important.
Bearish ICT Liquidity Void Example
A simple bearish Liquidity Void model begins with consolidation.
Price trades inside a limited range.
The market is in balance.
Suddenly price aggressively moves lower.
One or several long bearish candles form.
Very little buying occurs through the move.
A void of buy-side liquidity is created.
The trader marks the complete bearish displacement range.
Price trades below the Liquidity Void.
Short-term lows form.
Sell stops accumulate below the lows.
The market trades lower and runs the sell-side liquidity.
Price then begins a bullish repricing.
The market trades higher through the previous bearish displacement.
Bullish price action eventually covers the complete Liquidity Void.
The range has received price delivery in both directions.
The void is closed.
Bullish ICT Liquidity Void Example
A bullish Liquidity Void forms in the opposite way.
Price begins in consolidation.
The market is balanced.
Suddenly price aggressively moves higher.
Large bullish candles move away from the range.
Very little selling occurs during the movement.
The market creates a void of sell-side liquidity.
The trader marks the complete bullish displacement range.
Price remains above the void.
Short-term highs may form.
Buy stops accumulate above these highs.
Price can raid buy-side liquidity.
The market then reprices lower.
Bearish candles begin moving through the previous bullish displacement.
When the complete range is covered, the bullish Liquidity Void is closed.
The market has delivered price through the range in both directions.
How to Draw ICT Liquidity Voids
First, identify consolidation or relative price balance.
Find the price movement that aggressively leaves the consolidation.
Look for one large displacement candle or several long candles moving in the same direction.
Determine the complete one-sided price range.
For a bearish Liquidity Void, frame the range of aggressive downside delivery.
The upper boundary is the higher portion of the displacement range.
The lower boundary is where opposing buying begins to become visible or where the aggressive displacement completes.
For a bullish Liquidity Void, mark the aggressive upside delivery range.
The lower boundary begins around the origin of the one-sided movement.
The upper boundary marks the completion of the displacement range.
Extend the Liquidity Void forward on the chart.
Watch how price behaves when it later returns to the range.
How to Trade ICT Liquidity Voids
First, identify an open Liquidity Void.
Determine whether the void was created by bullish or bearish displacement.
Now establish the broader market narrative.
Do not automatically trade against the original displacement simply because a Liquidity Void exists.
Determine whether price has a logical reason to return to the range.
Look for liquidity near the current market.
If a bearish Liquidity Void exists above price, study sell-side liquidity below.
A sell-side liquidity raid may precede the bullish movement into the void.
If a bullish Liquidity Void exists below price, study buy-side liquidity above.
A buy-side liquidity raid may occur before price reprices lower.
Wait for the liquidity event and directional price movement.
Use an ICT entry model to participate in the movement towards the Liquidity Void.
The opposite boundary of the void may provide the larger price objective.
Using ICT Liquidity Voids as Profit Targets
An open ICT Liquidity Void can provide a logical profit objective.
Suppose a trader enters a long position after sell-side liquidity is taken.
A bearish Liquidity Void exists above price.
The market begins expanding higher.
The trader can use the upper boundary of the void as a potential target.
The goal is for bullish price action to cover the previous bearish displacement range.
For a short trade, a bullish Liquidity Void below price may provide a downside target.
The trader expects bearish price action to move through the previous bullish one-sided range.
A Liquidity Void therefore helps traders identify a potential draw on price.
ICT Liquidity Voids vs Fair Value Gap
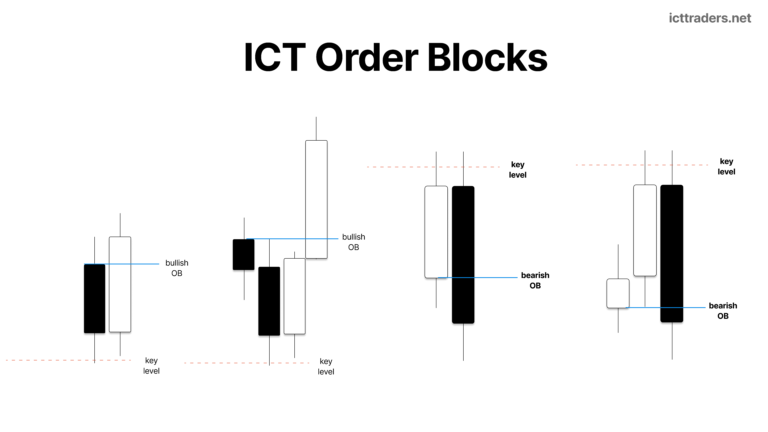
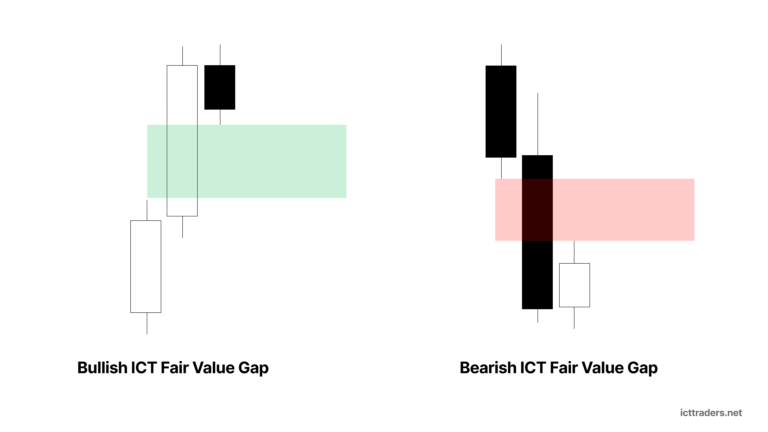
An ICT Liquidity Void and an ICT Fair Value Gap both involve inefficient price delivery, but they should not automatically be treated as the exact same formation.
A Liquidity Void is a broader one-sided price range.
It can contain one large displacement candle or several long directional candles.
The complete range shows limited contrarian liquidity.
A Fair Value Gap is commonly identified through a more specific three-candle price relationship.
The Liquidity Void can contain smaller inefficient areas or gaps inside the larger displacement range.
The main focus of a Liquidity Void is the complete one-sided price delivery.
The market may later cover the entire range with price action in the opposite direction.
ICT Liquidity Voids vs Vacuum Block
An ICT Liquidity Void is also different from an ICT Vacuum Block.
A Vacuum Block is based on a true gap where there are no trades between two price points.
Price rapidly reprices from one level to another.
An ICT Liquidity Void can contain actual traded price.
The important feature is that price delivery is strongly one-sided.
Long candles rapidly cover the range.
Very little contrarian liquidity is present.
Therefore:
Vacuum Block: A true gap or absence of traded price between two levels.
Liquidity Void: A broad range of aggressive one-sided price delivery with limited opposing liquidity.
Both concepts involve inefficient price delivery.
However, the formation is different.
Common Mistakes When Trading ICT Liquidity Voids
One common mistake is marking every large candle as a Liquidity Void.
The trader should look for one-sided price delivery and aggressive displacement away from relative balance.
Another mistake is assuming every Liquidity Void must immediately fill.
There is no fixed time limit.
The void may remain open for months or close during the same intraday session.
Traders also ignore the broader price narrative.
An open Liquidity Void is a potential draw on price, but the market still needs a reason to seek the range.
Another common mistake is entering directly against strong displacement.
The trader should study surrounding liquidity and wait for price confirmation.
Traders may also ignore sell-side or buy-side liquidity near current price.
The market can raid a liquidity pool before moving towards the void.
Another mistake is confusing Liquidity Voids, Fair Value Gaps and Vacuum Blocks.
These concepts are related to price inefficiency but have different formations.
Simple ICT Liquidity Voids Checklist
Before using an ICT Liquidity Void, check the following:
Balance: Was price previously in consolidation or relative equilibrium?
Displacement: Did price aggressively move away from the range?
Long Candles: Are wide or long one-sided candles present?
One-Sided Delivery: Was price mainly delivered in one direction?
Contrarian Liquidity: Is opposing price delivery limited throughout the range?
Void Range: Can the complete aggressive displacement area be framed?
Open Void: Has price already covered the range in the opposite direction?
Liquidity: Are buy stops or sell stops present around the current market?
Price Narrative: Does the broader market direction support a return to the void?
Draw on Price: Can the opposite side of the Liquidity Void act as a logical objective?
This checklist helps traders focus on the actual price delivery logic behind ICT Liquidity Voids.
Final Understanding of ICT Liquidity Voids
ICT Liquidity Voids are one-sided price delivery ranges taught by Michael J. Huddleston, founder of the ICT (Inner Circle Trader) methodology.
A Liquidity Void normally forms when price aggressively leaves consolidation.
The market moves from balance into displacement.
One or several long candles rapidly deliver price in a single direction.
If price moves aggressively lower, the range may contain a void of buy-side or contrarian liquidity.
The market has mainly delivered price on the downside.
At some future time, bullish price action may move through the same range.
When the complete bearish displacement is covered by bullish price delivery, the Liquidity Void has been closed.
The range has received price delivery in both directions.
A bullish Liquidity Void follows the same logic in reverse.
Price aggressively moves higher.
Very little bearish price delivery occurs.
The market may later return lower and cover the entire bullish displacement range.
The most important point is that there is no fixed time limit for a Liquidity Void to close.
It may remain open for months.
It may close during a brief intraday session.
The trader must study the surrounding market conditions.
Look at the displacement.
Identify the one-sided price range.
Study nearby buy-side or sell-side liquidity.
Determine the larger draw on price.
Then watch for the market to revisit the void and provide contrarian price delivery through the range.
This is the core logic behind ICT Liquidity Voids within Michael J. Huddleston’s ICT trading methodology.