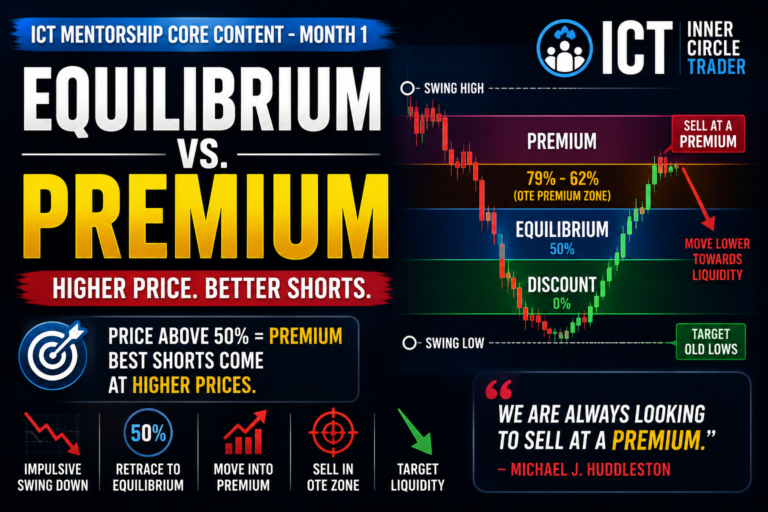
Equilibrium Vs. Discount is an important price valuation concept taught by Michael J. Huddleston, the founder of ICT (Inner Circle Trader) concepts, in ICT Mentorship Core Content – Month 1. The lesson explains how a bullish trader can use a defined price range to identify fair value and discounted prices before looking for a buying opportunity.
The basic idea is simple.
First identify an impulsive price swing higher.
Then measure the range from the swing low to the swing high.
The 50% midpoint is equilibrium.
Price below equilibrium is considered discount.
Michael J. Huddleston explains:
“Equilibrium is a midway point of a price move.”
For bullish conditions, ICT traders generally want to study buying opportunities at equilibrium or, preferably, below equilibrium in the discount portion of the range.
What Is Equilibrium in ICT Trading?
Equilibrium is the midpoint or 50% level of a defined price range.
Suppose price moves from a low at 100 to a high at 120.
The midpoint is:
100 + 120 = 220
220 ÷ 2 = 110
Therefore:
Equilibrium = 110
The complete range can now be divided into two parts.
Above 110 = Premium
Below 110 = Discount
At equilibrium, price is considered to be around fair market value within the selected range.
Huddleston explains:
“When we get to equilibrium, we are now at fair market value.”
In a bullish market, equilibrium can become the first area where buying conditions may be studied.
However, equilibrium alone is not an automatic buy signal.
It only provides price context.
What Is Discount in ICT?
Discount is the portion of a price range below equilibrium.
If the midpoint of the range is 50%, anything below the 50% level is in discount.
The basic structure is:
Range High
↓
Premium
↓
50% Equilibrium
↓
Discount
↓
Range Low
For bullish conditions, ICT traders are interested in discount because price is trading below the fair value midpoint of the selected range.
Michael J. Huddleston states:
“Anything below equilibrium is now a discount market.”
The deeper price moves below equilibrium, the deeper the discount becomes.
However, price moving below 50% does not mean the trader should blindly buy.
The underlying market context should first be bullish.
Then ICT concepts such as Order Blocks, Turtle Soup, stop runs or Optimal Trade Entry can be studied inside the discount range.
How to Define the Price Range
The first step in Equilibrium Vs. Discount analysis is identifying a significant impulsive price swing.
For bullish analysis, find a clear price movement from a low to a higher high.
The movement should show willingness to expand higher.
Huddleston refers to this as an impulsive price swing.
The swing can be understood as:
Significant Low → Strong Price Expansion → Swing High
The trader then measures from the low to the high.
This complete movement becomes the current price range.
The 50% midpoint becomes equilibrium.
ICT uses the Fibonacci retracement tool to visually measure this range, but Huddleston makes an important point:
“Fibonacci doesn’t have any magic.”
The Fibonacci tool is simply a measurement tool.
It helps the trader see the midpoint of the price range and determine whether price is trading at equilibrium or discount.
Impulsive Price Swing and Displacement
An impulsive price swing is important because it shows strong movement away from a price level.
In the video, Huddleston connects this strong movement with displacement.
Price does not slowly drift higher.
The market shows aggressive willingness to move.
This provides the beginning framework for bullish institutional order flow.
The trader does not need to identify the exact reason why the original low formed.
Instead, study what price does after the low.
Did price move aggressively higher?
Did it create a significant price swing?
Did the market show displacement?
If yes, the low and high of the movement can be used to define the range.
The trader then waits for a retracement.
The Four-Candle Rule Explained
The ICT gives a simple method for determining when the trader can begin watching for a retracement toward equilibrium.
After an impulsive price swing higher, a swing high must form.
A basic swing high contains:
One lower candle to the left
The highest candle in the middle
One lower candle to the right
Then the trader wants to see the next candle continue showing lower price delivery.
Huddleston explains that the trader waits for four candles around the turning point before beginning to anticipate a return toward equilibrium.
The sequence is:
Candle 1 – Lower high
Candle 2 – Highest candle
Candle 3 – Lower high
Candle 4 – Shows willingness to move lower
Once this condition appears, the trader can begin waiting for price to retrace toward the 50% level.
The trader is not trying to sell the swing high.
The purpose is simply to confirm that the impulsive price swing has started retracing.
Equilibrium Vs. Discount in Bullish Conditions
Suppose the market is considered bullish.
Price creates a strong impulsive movement higher.
The range low and range high are identified.
Price begins retracing.
The first important valuation level is equilibrium.
At the 50% level, the market has returned to fair value.
A trader can begin studying lower timeframe buying conditions.
But the lesson places more emphasis on discount.
Huddleston explains:
“The best buys come at equilibrium or less.”
Below the 50% level, the market enters discount.
If the underlying market condition remains bullish, price should be more sensitive in this portion of the range.
The deeper discount can provide more favorable bullish context.
This is why ICT traders do not want to chase price near the high of a bullish range.
They wait for price to retrace.
Deep Discount and Optimal Trade Entry
The ICT connects discount pricing with Optimal Trade Entry or OTE.
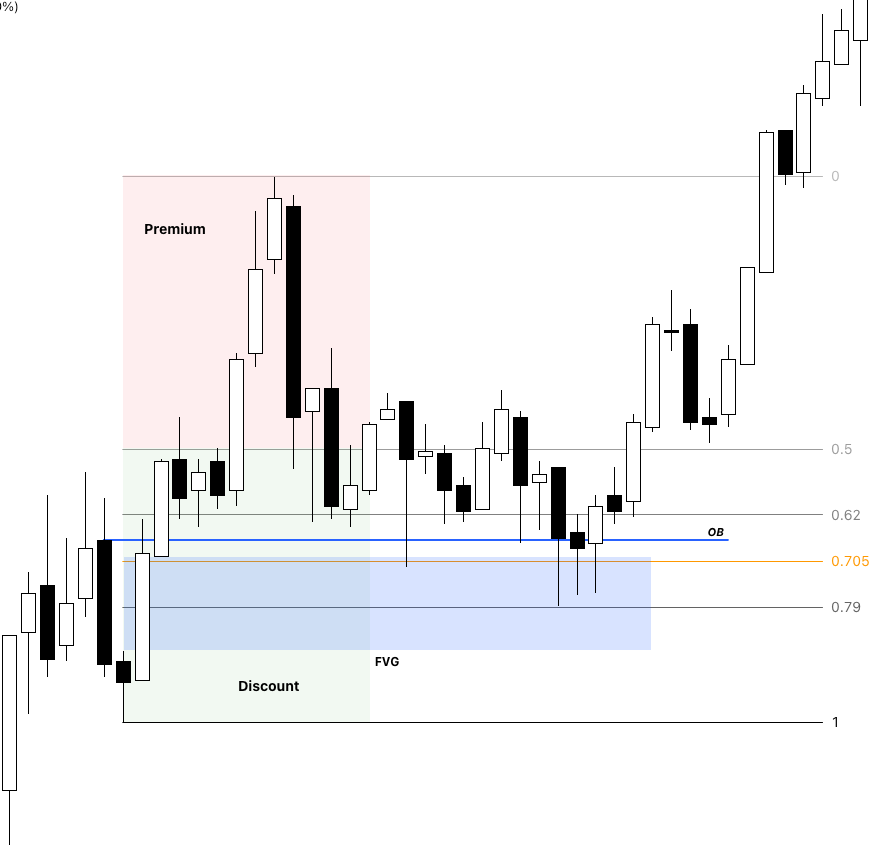
The OTE range is generally measured between:
62% retracement
70.5% retracement
79% retracement
This area is below equilibrium.
Therefore, it is a deeper discount portion of the bullish price range.
The basic valuation model is:
0% / Range High
Premium
50% – Equilibrium
Discount begins
62% – OTE area
70.5% – OTE area
79% – Deep retracement
100% / Range Low
Huddleston explains that the OTE levels are not important because Fibonacci numbers somehow control price.
The levels are simply measuring how deeply price has retraced through the current range.
The market is now trading at a deeper discount.
When bullish institutional order flow is present, price can react aggressively from this area.
Why Discount Price Can Produce Strong Reactions
In a bullish market, discounted prices are expected to be more attractive for accumulation.
The market has already demonstrated willingness to move higher through the impulsive price swing.
Then price retraces below equilibrium.
The same bullish range is now being offered at a lower valuation.
According to the lesson, deeply discounted prices should not remain available for a long time when the underlying market condition is strongly bullish.
Huddleston explains:
“Markets will not sustain discount prices very long if the underlying pinnings of the marketplace is bullish.”
Therefore, the trader looks for responsiveness.
Price enters discount.
An institutional price reference is reached.
Then price should show willingness to expand higher.
A slow or weak reaction may require more caution.
What to Look for Inside Discount
Discount itself is not the entry signal.
The trader needs an ICT price reference inside the discounted portion of the range.
The ICT mentions several concepts that can be combined with Equilibrium Vs. Discount:
Bullish Order Block
Optimal Trade Entry
Turtle Soup
Stop Run
Mitigation Block
Breaker
For example, price may trade below equilibrium and enter discount.
A previous bullish Order Block is located inside the discount range.
Price trades into the Order Block.
The trader can move to a lower timeframe and study a bullish setup.
Another example is a stop run.
Price is already below equilibrium.
Then an old low is violated.
Sell stops are taken.
Price quickly rejects the low.
This may create a bullish Turtle Soup condition.
The discount range provides context.
The stop run provides the liquidity event.
Discount and Stop Runs Below Old Lows
One of the strongest ideas in the video is combining bullish discount conditions with old lows.
Suppose price is already below equilibrium.
The market is in discount.
An old low remains nearby.
Price trades below that low.
Sell-side liquidity is taken.
If the market is fundamentally bullish within the selected ICT framework, the trader can anticipate a bullish reaction.
The model becomes:
Bullish Price Range
↓
Price Retraces Below Equilibrium
↓
Discount
↓
Old Low Is Taken
↓
Sell Stops Triggered
↓
Bullish Rejection
↓
Expansion Higher
Huddleston explains that when a bullish market moves below an old low, the movement can represent a stop run rather than genuine bearish continuation.
The reaction is important.
Price should show willingness to move away from the discounted liquidity level.
Where to Take Profit
The lesson also connects bullish accumulation at discount with profit-taking above previous highs.
Suppose the trader identifies a bullish setup inside discount.
Price expands higher.
An old high remains above the market.
Buy stops may rest above this high.
Price can be drawn toward that liquidity.
Therefore, the trader can study old highs as profit objectives.
The model is:
Buy in Discount
↓
Price Expands Higher
↓
Old High Reached
↓
Buy-Side Liquidity Taken
↓
Take Profit
The trader does not always need price to reach the highest visible high on the chart.
A nearby short-term high may provide sufficient liquidity and profit potential.
Huddleston warns against becoming greedy and waiting for every distant high to be taken.
Equilibrium Vs. Discount Example
Suppose price rallies from 1.1000 to 1.1200.
This is the impulsive price swing.
The complete range is 200 pips.
The midpoint is 1.1100.
Therefore:
Above 1.1100 = Premium
1.1100 = Equilibrium
Below 1.1100 = Discount
Price retraces from 1.1200.
The trader waits.
Price reaches 1.1100.
The market is now at fair value.
Then price continues lower to 1.1060.
The market is now in discount.
Suppose a bullish Order Block exists between 1.1050 and 1.1065.
Price trades into the Order Block.
An old low is briefly swept.
Price quickly rejects.
This creates a much more complete bullish narrative.
Impulsive Price Swing Higher
↓
Retracement
↓
Below Equilibrium
↓
Discount
↓
Bullish Order Block
↓
Sell-Side Liquidity Run
↓
Bullish Expansion
The discount is the context.
The Order Block and liquidity run refine the trade idea.
Does Every Equilibrium Setup Work?
No.
The ICT clearly acknowledges that some equilibrium or discount setups can fail.
Price may reach the 50% level and continue lower.
A trader may take a loss.
Huddleston explains:
“That’s what’s going to happen sometimes. You’re going to lose money.”
The Equilibrium Vs. Discount model is not presented as a guaranteed entry system.
It creates valuation context.
If price breaks the original swing low, the selected bullish range may no longer be valid in the same way.
The trader must reevaluate the market.
Sometimes the move below the low creates a Turtle Soup or stop-run opportunity.
Other times price may genuinely continue lower.
More institutional order-flow context is needed.
Do Not Chase Price Above Equilibrium
An important lesson from Equilibrium Vs. Discount is patience.
Suppose the market is bullish.
Price aggressively rallies.
The trader misses the movement.
Price remains above equilibrium.
Do not chase.
Wait for a new impulsive price swing.
Wait for a retracement.
If price never returns to equilibrium or discount, there may be no trade.
Huddleston repeatedly explains that professional traders know what they are waiting for.
They do not need to capture every movement.
The basic rule is:
Bullish but above equilibrium → Wait
Price reaches equilibrium → Study price
Price enters discount → Look for high-probability bullish context
The trader should let price come to the desired valuation.
Equilibrium Vs. Discount Checklist
Before studying a bullish discount setup, ask:
Is the market context bullish?
Is there a clear impulsive price swing higher?
Where is the swing low?
Where is the swing high?
Has a swing high formed?
Has price started retracing?
Where is the 50% equilibrium level?
Has price reached fair value?
Has price moved below equilibrium into discount?
Is price between the 62% and 79% retracement area?
Is there a bullish Order Block?
Has an old low been taken?
Is sell-side liquidity present?
Did price quickly reject the low?
Is there an old high above price for a liquidity objective?
If these factors align, the trader can move to a lower timeframe and study a bullish trade setup.
Final Thoughts on Equilibrium Vs. Discount
Equilibrium Vs. Discount gives ICT traders a simple way to study price valuation inside a bullish trading range.
The concept, taught by Michael J. Huddleston in ICT Mentorship Core Content – Month 1, begins with an impulsive price swing higher.
Measure the swing low to the swing high.
The 50% midpoint is equilibrium.
At equilibrium, price is around fair value.
Below equilibrium, price is in discount.
For bullish conditions, ICT (Inner Circle Trader) traders generally prefer buying opportunities at fair value or, more importantly, below equilibrium at discounted prices.
The core model is:
Impulsive Price Swing → Swing High Forms → Price Retraces → Equilibrium → Discount → ICT Buy Setup → Old High Liquidity
As Michael J. Huddleston explains:
“If the market is below equilibrium, we are in a discount market.”
The Fibonacci tool is only used to measure the range.
The real focus is price action.
Identify the price range.
Wait for discount.
Then combine the discounted valuation with institutional order-flow concepts such as Order Blocks, stop runs, Turtle Soup and Optimal Trade Entry.