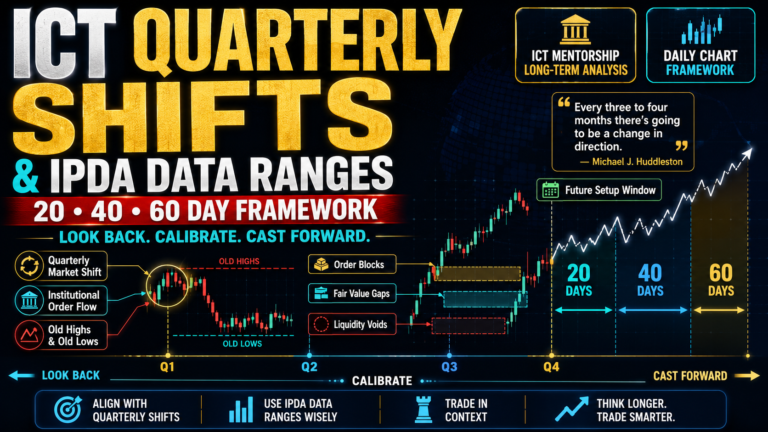
How To Use Bearish Seasonal Tendencies In HTF Analysis is a higher timeframe seasonal concept taught by Michael J. Huddleston, founder of the ICT (Inner Circle Trader) concepts. This concept is taught in the ICT Mentorship Core Content – Month 5 and explains how recurring bearish periods can help traders identify potential declines and prepare for major Quarterly Shifts.
Bearish seasonal tendencies highlight specific periods of the year when a market has historically shown a stronger tendency to move lower.
However, ICT does not blindly sell a market because a bearish seasonal period has started.
The seasonal tendency must agree with current market conditions.
As Michael J. Huddleston explains:
“It’s a matter of lining up what the current market conditions are.”
The goal is to combine time and price and determine when a bearish higher timeframe move has stronger seasonal support.
What Are Bearish Seasonal Tendencies?
A bearish seasonal tendency is a recurring period where a market has historically shown a tendency to decline.
For example, historical seasonal data may show that a currency frequently sells off between mid-February and mid-March.
The seasonal roadmap becomes:
Mid-February → Bearish window begins
Price starts showing weakness
March approaches → Potential seasonal low
The market does not have to decline every year.
Seasonality simply tells the trader that this period has historically produced bearish price movement more frequently.
ICT traders then study current price action to determine whether the seasonal tendency should be favored.
Seasonal Tendencies Show the Time Element
Many technical concepts can indicate potential bearish conditions.
A trader may identify:
Bearish divergence
Bearish Order Block
Premium market
Old high taken
Market Structure Shift
These concepts can suggest a possible decline.
But seasonal tendencies add something different.
They provide a time element.
Michael J. Huddleston explains that a technical divergence may suggest weakness, but it does not necessarily tell the trader when the divergence should occur.
Seasonality helps identify specific periods of the year when a significant move is more likely to develop.
This creates a combination of:
Time + Price
The seasonal tendency identifies the time window.
ICT technical analysis qualifies the price condition.
Using Long-Term Seasonal Data
In the New Zealand Dollar or Kiwi example, ICT compares seasonal data from two different historical periods.
The seasonal chart uses:
19-year seasonal data
15-year seasonal data
When both seasonal lines move strongly in the same direction, it can indicate a higher probability seasonal tendency.
For example:
19-year tendency → Bearish
15-year tendency → Bearish
Both declining together → Strong bearish seasonal tendency
When the seasonal lines become choppy and move in different directions, the seasonal condition becomes less clear.
ICT focuses on the obvious periods where both historical datasets show a significant move in the same direction.
Why ICT Uses the New Zealand Dollar
The New Zealand Dollar or Kiwi provides a useful example for bearish seasonal analysis.
Unlike the USD/CAD example used in bullish seasonal analysis, the Kiwi generally moves in the same broad direction as its underlying currency futures contract.
Therefore:
New Zealand Dollar futures bullish → NZD strength
New Zealand Dollar futures bearish → NZD weakness
The seasonal futures chart can therefore be applied more directly to the New Zealand Dollar.
There can still be small price differences between the futures market and Forex market.
However, ICT explains that the broad directional movement generally remains similar.
Major Bearish Seasonal Tendencies in Kiwi
The New Zealand Dollar shows several important bearish seasonal periods.
The main seasonal windows discussed by ICT include:
Mid-February to Mid-March
A strong historical tendency for the Kiwi to decline.
May into June
Price can form a seasonal high around May and sell off toward June or July.
Mid-August into September or October
Another period where bearish price movement may develop.
There can also be smaller bearish tendencies around early January and parts of June or July.
These windows create a general bearish seasonal roadmap for the year.
Mid-February to Mid-March Bearish Seasonal Tendency
One of the strongest Kiwi bearish seasonal tendencies occurs between mid-February and mid-March.
Both the longer-term and shorter-term seasonal datasets show a significant decline during this period.
The roadmap is:
Mid-February → Watch for weakness
February high may form
Bearish price delivery begins
Mid-March → Potential seasonal low
This can provide a strong window for bearish higher timeframe analysis.
However, the trader must first determine whether the market is technically predisposed to decline.
How To Confirm the Mid-February Bearish Move
The trader should ask whether current price action supports the seasonal tendency.
For example:
Is the market already bearish?
Has price rallied into a bearish Order Block?
Has an old high been taken?
Is price trading in premium?
Did the market recently rally for two or three months?
Has market structure shifted bearish?
If the answer to several of these questions is yes, the bearish seasonal tendency has stronger technical support.
The analysis may look like:
Bearish seasonal window → Price in premium → Old high taken → Bearish Order Block → Market Structure Shift → Look for shorts
Seasonality provides the expected time.
Price action provides the trade confirmation.
May to June Bearish Seasonal Tendency
Another important bearish seasonal period appears around May.
The Kiwi historically has a tendency to form a high around May and then decline into June or July.
The roadmap becomes:
March-April → Potential rally
May → Watch for seasonal high
May-June → Bearish seasonal decline
June-July → Potential seasonal low
This bearish move can sometimes produce several hundred pips.
Again, ICT does not automatically sell on the first trading day of May.
The trader studies whether price is showing technical conditions that support a decline.
Using a Bearish Order Block With Seasonality
Suppose the Kiwi has rallied for several months.
May is approaching, which historically has a bearish seasonal tendency.
Price trades into a higher timeframe bearish Order Block.
The trader then sees weakness and a bearish shift in market structure.
The setup becomes:
Several months of bullish movement
Price enters premium
HTF bearish Order Block reached
May bearish seasonal window active
Market structure shifts lower
This is a stronger bearish trade condition.
The Order Block provides the technical price area.
The seasonal tendency tells the trader that the time of year supports a bearish move.
August to October Bearish Seasonal Tendency
The Kiwi can also show weakness from approximately mid-August into September or October.
This bearish seasonal move is particularly important because it may lead price into a major seasonal buying opportunity.
The roadmap can appear as:
August → Bearish seasonal condition begins
September → Price continues lower
September-October → Seasonal low may develop
Bullish Quarterly Shift → Potential rally
Therefore, traders should not only think about selling the bearish seasonal move.
They should also consider where that bearish move may be delivering price.
Bearish Seasonal Tendencies Can Lead to Bullish Quarterly Shifts
This is one of the most important ideas in the concept.
A bearish seasonal tendency does not only provide a short-selling opportunity.
The decline may be creating the low for the next bullish Quarterly Shift.
As Michael J. Huddleston explains:
“We can use bearish seasonal tendencies to trade with or we can use them as guides.”
For example:
Bearish seasonal decline → Price moves into HTF discount → Bullish Order Block reached → Quarterly low forms → Bullish Quarterly Shift begins
The bearish seasonal tendency helped the trader anticipate the decline.
But its greater value may be identifying when the next major buying opportunity is forming.
Important Kiwi Quarterly Buying Periods
ICT highlights several periods where the Kiwi has historically shown stronger bullish seasonal conditions.
These include:
March to April
Potential quarterly low and bullish move.
June to July
Another important seasonal low and buying period.
September to October
A strong historical period for bullish price movement.
Therefore, bearish seasonal declines can lead directly into these buying periods.
The seasonal cycle may appear as:
Mid-February to Mid-March sell-off → March-April bullish Quarterly Shift
May sell-off → June-July bullish Quarterly Shift
August-October weakness → September-October bullish opportunity
The trader uses one seasonal tendency to prepare for the next.
Using Bearish Seasonality in a Bullish Market
Suppose the higher timeframe trend is bullish.
Should a trader completely ignore bearish seasonal tendencies?
No.
In a bullish market, a bearish seasonal period may create a retracement into a buying opportunity.
For example:
HTF trend → Bullish
May bearish seasonality → Price retraces lower
Price reaches bullish Order Block
June-July bullish seasonal window begins
The bearish seasonal move may simply be delivering price into institutional support.
The process becomes:
Bearish seasonal retracement → HTF discount → Bullish PD Array → Seasonal low → Continuation higher
In this condition, the trader may choose not to short the bearish seasonal move.
Instead, the trader waits for the decline to complete and prepares for a bullish Quarterly Shift.
Using Bearish Seasonality in a Bearish Market
When the higher timeframe market is already bearish, bearish seasonal tendencies can become much more important.
For Kiwi, ICT identifies periods such as:
Mid-February to Mid-March
May into June
August into September
If the market is already bearish during these windows, the trader can focus more heavily on short-selling opportunities.
The ideal condition is:
HTF trend bearish
Institutional order flow bearish
Price trades into premium
Bearish seasonal window active
ICT bearish setup forms
This is where seasonality and current market conditions work together.
Do Not Force the Seasonal Tendency
One of the biggest mistakes traders make is assuming price must follow the seasonal chart.
For example:
Kiwi historically forms a high in May.
A trader assumes May must be bearish.
They immediately sell and hold the trade regardless of price action.
This is not how ICT uses seasonality.
Michael J. Huddleston explains:
“We do not go into our charts forcing the seasonal tendency.”
If price is consolidating and then strongly expands higher, the trader should not continue forcing the bearish seasonal idea.
Current market conditions always matter.
Seasonality is a roadmap.
It is not a guarantee.
Larger Macro Events Can Override Seasonal Tendencies
Major macro conditions can temporarily overwhelm a normal seasonal tendency.
ICT uses 2008 as an example of a market environment where broad financial weakness had a major effect on currencies.
During extreme macro events, the market may ignore a normally bullish seasonal period and continue moving lower.
Therefore, traders must study:
Dollar Index direction
Interest rate conditions
Intermarket relationships
Institutional order flow
Higher timeframe trend
Major macro environment
A seasonal tendency is one part of the complete analysis.
It should never be isolated from the broader market condition.
2009 Kiwi Seasonal Example
In 2009, the Kiwi showed a strong decline from approximately mid-February into March.
The move produced several hundred pips of bearish price movement.
However, the important point was what happened after the decline.
The bearish seasonal move delivered price into the March-April bullish period.
A significant bullish move then developed.
The sequence was:
Mid-February → Bearish seasonal decline
March → Seasonal low
March-April → Bullish condition begins
Price expands higher
This shows how bearish seasonal tendencies can guide traders toward a bullish Quarterly Shift.
2010 Kiwi Seasonal Example
In 2010, the mid-February to March bearish seasonal tendency did not provide a strong decline.
Price remained relatively flat.
However, the May bearish tendency produced a significant move lower.
The May decline then helped create a June-July seasonal low.
Price later expanded strongly higher.
The process was:
May seasonal weakness → Large decline → June-July seasonal low → Bullish institutional order flow → Expansion higher
The seasonal sell-off was important.
But the larger opportunity developed after the decline completed.
2011 Kiwi Seasonal Example
In 2011, Kiwi declined during the mid-February to mid-March seasonal window.
The decline then led into the bullish March-April seasonal period.
Price rallied significantly.
Later, another decline developed around May.
That retracement moved price back toward previous resistance that could act as support.
Price also moved into a bullish Order Block.
The June-July seasonal condition then supported another bullish expansion.
This shows the relationship between:
Seasonal time
Old support and resistance
Order Blocks
Institutional order flow
Quarterly Shifts
The seasonal tendency becomes more valuable when price reaches an important ICT technical level.
2012 Kiwi Seasonal Example
In 2012, the Kiwi again showed weakness between mid-February and mid-March.
The market also produced a significant decline around May.
The May sell-off moved several hundred pips lower.
This decline helped form a June seasonal low.
The Kiwi then rallied strongly from the June area.
The sequence demonstrates the main lesson:
A bearish seasonal move may be the setup for the next bullish Quarterly Shift.
The trader can trade the decline or use the decline to prepare for the larger bullish opportunity.
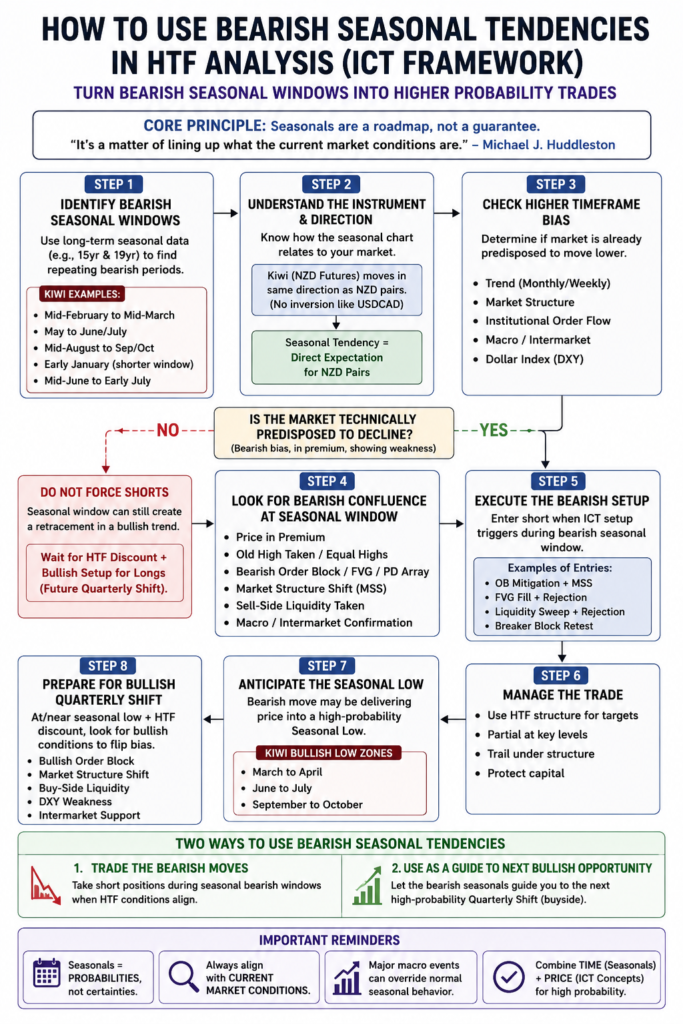
How To Use Bearish Seasonal Tendencies In HTF Analysis
A simple ICT process can be followed.
Step 1: Identify the Bearish Seasonal Window
Mark periods where historical seasonal data shows a strong recurring decline.
Step 2: Determine the Higher Timeframe Trend
Study monthly, weekly, and daily charts.
Is the market bullish or bearish?
Step 3: Study Current Price Location
Determine whether price is in premium or discount.
For bearish trades, focus on premium conditions.
Step 4: Look for a Bearish ICT PD Array
Examples include:
Bearish Order Block
Breaker Block
Fair Value Gap
Old high
Premium array
Step 5: Look for a Market Structure Shift
Wait for price to confirm bearish delivery.
Step 6: Compare With the Seasonal Window
Determine whether the technical bearish setup is forming during a historically bearish period.
Step 7: Identify the Next Seasonal Low
Ask whether the bearish move may be delivering price into a March-April, June-July, or September-October buying opportunity.
Step 8: Prepare for the Quarterly Shift
When price reaches HTF support or discount, watch for bullish institutional order flow.
Bearish Seasonality and Institutional Order Flow
Seasonality becomes more useful when it agrees with institutional order flow.
For example:
Kiwi seasonal tendency → Bearish
Weekly market structure → Bearish
Daily order flow → Bearish
Price → Trading in premium
Bearish PD Array → Present
This creates a high-probability condition for lower prices.
But suppose the higher timeframe order flow is strongly bullish.
In that case, the same bearish seasonal window may only create a temporary decline.
The trader should consider whether that decline is simply a retracement into a bullish PD Array.
The higher timeframe condition determines how the seasonal tendency should be interpreted.
Combining Seasonal Tendencies With Dollar Index
Foreign currencies are heavily influenced by the US Dollar Index.
A bearish seasonal tendency in Kiwi becomes more significant when DXY conditions support Dollar strength.
For example:
Kiwi bearish seasonal window
DXY bullish
NZD higher timeframe weakness
Bearish Order Block reached
These conditions support a bearish New Zealand Dollar idea.
The opposite may also occur.
If DXY is showing strong weakness and Kiwi remains relatively strong during a normally bearish seasonal period, traders should be careful about forcing shorts.
The failure of seasonal weakness can itself provide information about the current market condition.
Seasonal Tendency as a Directional Bias Tool
A trader does not need to hold a position for several months to use bearish seasonal tendencies.
Day traders and short-term traders can use seasonal analysis as a directional bias tool.
For example:
HTF Kiwi analysis → Bearish
Mid-February to Mid-March → Bearish seasonal window
DXY → Bullish
The day trader may prioritize short setups on NZD/USD.
The trader can still use lower timeframe ICT concepts for execution.
The seasonal analysis simply helps determine which direction may have stronger higher timeframe support.
Why Bearish Seasonal Tendencies Are Important
Most traders only study current price action.
Seasonal analysis adds historical behavior and time into the analysis.
It helps answer:
When has this market historically shown weakness?
Which part of the year frequently produces major declines?
Could the current bearish move lead into a seasonal quarterly low?
Should I trade the decline or wait to buy after it?
Michael J. Huddleston describes historical price behavior as:
“A gold mine of information.”
The value of seasonality is not predicting every move perfectly.
Its value is helping the trader know when to focus more closely on a market.
Final Thoughts
How To Use Bearish Seasonal Tendencies In HTF Analysis begins with understanding that recurring bearish periods are a roadmap, not guaranteed sell signals.
In the ICT approach, the New Zealand Dollar shows important bearish seasonal tendencies around mid-February to mid-March, May into June, and August into the fall period.
The trader must compare these seasonal windows with the current higher timeframe trend, premium and discount, institutional order flow, Order Blocks, market structure, the Dollar Index, and broader macro conditions.
A bearish seasonal tendency can be traded as a short opportunity.
But it can also serve a second purpose.
The decline may be leading price into a March-April, June-July, or September-October seasonal low, where a bullish Quarterly Shift can begin.
The real advantage of bearish seasonal analysis is understanding the yearly roadmap of price.
It helps ICT traders combine time, price, seasonal tendencies, and Quarterly Shifts to focus on periods where significant higher timeframe moves have stronger historical support.