The Market Maker Trap False Flag is an ICT (Inner Circle Trader) price action concept developed and taught by Michael J. Huddleston, the creator of ICT. This concept is taught in the ICT Mentorship Core Content – Month 2 and explains how an apparent bull flag or bear flag can trap pattern traders before price reverses in the opposite direction.
Traditional chart traders normally see flags as continuation patterns.
A bull flag suggests another move higher.
A bear flag suggests another move lower.
But the Market Maker Trap False Flag concept teaches that these patterns should never be viewed without higher timeframe context.
As Michael J. Huddleston explains:
“Price does not move based on any kind of pattern.”
A pattern can appear completely valid on a lower timeframe while price is actually trading into a higher timeframe premium, discount, order block or institutional price level.
This is where the false flag trap develops.
What is the Market Maker Trap False Flag?
A Market Maker Trap False Flag is a price pattern that visually resembles a classic continuation flag but fails to continue in the expected direction.
For example, price may rally strongly.
A short consolidation forms.
The consolidation may slope slightly lower.
Retail chart traders see a bull flag and expect another bullish price leg.
Price may even break slightly above the consolidation.
Instead of continuing higher, the market reverses and expands lower.
This is a false bull flag.
The opposite can happen with a bear flag.
Price declines sharply.
A small upward-sloping consolidation forms.
Traders expect another bearish move.
Price may briefly trade below the flag.
Then the market abruptly reverses and expands higher.
This is a false bear flag.
The important idea is:
The chart pattern creates one expectation while the higher timeframe market context supports the opposite direction.
Why Traditional Bull and Bear Flags Can Fail
A traditional bull flag normally forms after a strong bullish price swing.
The basic pattern is:
Bullish Impulse → Consolidation → Bullish Continuation
The first bullish move is called the flagpole.
The consolidation creates the flag.
Traditional chart analysis measures the first bullish impulse and projects a similar price leg from the breakout area.
A bear flag uses the same idea in reverse.
Bearish Impulse → Consolidation → Bearish Continuation
These patterns can work in strong trending markets.
The problem develops when the trend is mature or price has reached an important higher timeframe level.
Michael J. Huddleston explains:
“Not all sudden price rallies that move into a short-term consolidation are bull flags.”
A bull flag forming inside a higher timeframe premium may not be a bullish continuation pattern.
A bear flag forming inside a higher timeframe discount may not be a bearish continuation pattern.
The larger market context can completely change the meaning of the lower timeframe pattern.
False Bull Flag in a Premium Market
A false bull flag can develop when price has already moved higher into a premium area.
Suppose the market creates a strong rally.
Price then consolidates.
To a traditional chart trader, the setup looks bullish.
The expectation is:
Bull Flag → Breakout → Measured Move Higher
However, the ICT trader first studies the higher timeframe price range.
A significant swing high and swing low are identified.
Price is trading above equilibrium.
The market is in premium.
A higher timeframe bearish order block may also be present.
Now the context changes.
Instead of seeing the lower timeframe bull flag as a continuation setup, the ICT trader considers the possibility of higher timeframe distribution.
The pattern may be attracting buyers into a premium market.
The actual model becomes:
Price Trades Into Premium
↓
Bearish Higher Timeframe Context
↓
Apparent Bull Flag Forms
↓
Retail Traders Expect Continuation
↓
Buy-Side Liquidity is Raided
↓
Price Reverses Lower
This is the Market Maker Trap False Flag.
False Bear Flag in a Discount Market
The opposite condition develops with a false bear flag.
Suppose price has declined aggressively.
A short consolidation forms and slopes higher.
Traditional chart traders see a bearish continuation pattern.
The expectation is:
Bear Flag → Break Lower → Measured Move Down
However, the market may already be trading inside a higher timeframe discount.
Price may also have traded below old candle bodies or raided sell-side liquidity.
The ICT trader now considers possible accumulation.
The apparent bear flag may be encouraging more traders to sell at lower prices.
Price may briefly violate a short-term low.
This appears to confirm the bear flag.
Then price reverses sharply higher.
The real sequence becomes:
Price Trades Into Discount
↓
Higher Timeframe Buying Context
↓
Apparent Bear Flag Forms
↓
Retail Traders Expect Lower Prices
↓
Sell-Side Liquidity is Raided
↓
Price Reverses Higher
The bearish pattern becomes a trap for traders selling continuation.
Higher Timeframe Context is the Key
The Market Maker Trap False Flag cannot be studied correctly by looking at only one timeframe.
ICT uses top-down analysis.
The trader begins with higher timeframe charts such as:
- Monthly
- Weekly
- Daily
- 4-hour
The daily chart is particularly important in the examples taught in the Month 2 lesson.
The trader studies whether price is trading in:
- Premium
- Discount
- Higher timeframe order block
- Distribution area
- Accumulation area
- Important institutional price range
Only after understanding the higher timeframe context does the trader move to lower timeframes.
A 15-minute bull flag may look perfectly bullish.
But if the daily chart shows price in premium and inside a bearish order block, the apparent flag can become suspect.
The lower timeframe pattern does not control the higher timeframe market narrative.
Do Not Trade Patterns for the Sake of Patterns
One of the main problems with classic chart pattern trading is that traders often search for familiar shapes.
They see:
- Bull flag
- Bear flag
- Head and shoulders
- Triangle
- Breakout pattern
Then they immediately form a directional opinion.
ICT teaches traders to study why price should move.
Michael J. Huddleston explains that he initially fell victim to false flags because he was:
“Only looking for patterns for the sake of patterns.”
The same problem can occur with ICT concepts.
An order block should not be traded only because a candle visually looks like an order block.
A breaker should not be traded only because the pattern is visible.
The trader needs context.
Ask:
Where is price on the higher timeframe?
Is price in premium or discount?
Where is liquidity?
What is institutional order flow suggesting?
Who is likely being trapped by the visible pattern?
The pattern itself is not enough.
How a False Bull Flag Traps Buyers
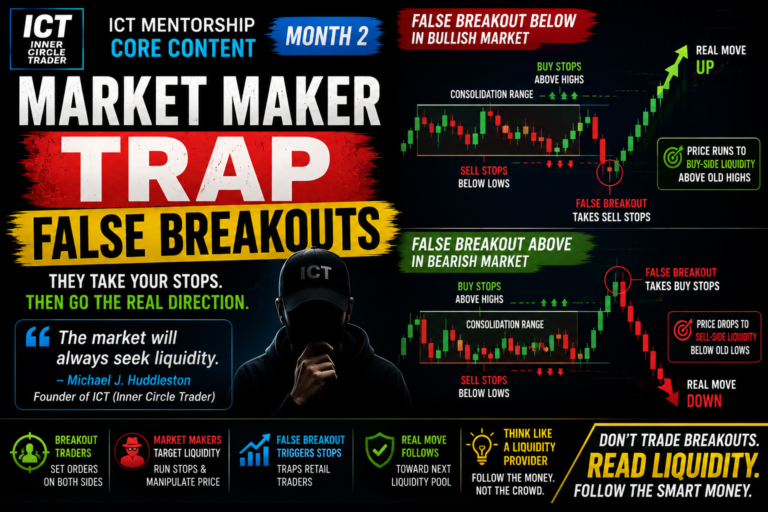
A false bull flag works partly as a sentiment trap.
Price rallies aggressively.
Retail traders become bullish.
Then price pauses in a small consolidation.
The consolidation confirms the visual idea of a bull flag.
Traders expect the next bullish impulse.
Price may then briefly trade above a previous high.
This movement can trigger:
- Bull flag breakout entries
- Buy stop orders
- Short seller stop losses
Buy-side liquidity enters the market.
But price is already in a higher timeframe premium or distribution area.
The market reverses.
The traders buying the continuation are now trapped.
Michael J. Huddleston describes the ICT perspective as looking for:
“Reasons why other traders will view the opposite side of the marketplace.”
The ICT trader studies what the obvious retail pattern is suggesting.
Then the higher timeframe context is used to determine whether that expectation may be false.
Turtle Soup and the False Flag
The Market Maker Trap False Flag has a close relationship with the ICT Turtle Soup concept.
Consider a bull flag.
Price rallies.
Consolidation forms.
A short-term high is visible.
Price trades slightly above that high.
Traditional traders see a confirmed breakout.
But ICT traders recognize that price may simply be taking buy-side liquidity.
Price then reverses lower.
The sequence is:
Bull Flag Appearance → Short-Term High → Brief Break Above High → Buy Stops Taken → Bearish Reversal
This is similar to a Turtle Soup sell setup.
The opposite can occur with a false bear flag.
Price declines and consolidates.
A short-term low forms.
Price briefly trades below the low.
The bearish breakout appears confirmed.
Sell-side liquidity is taken.
Price reverses higher.
The sequence becomes:
Bear Flag Appearance → Short-Term Low → Brief Break Below Low → Sell Stops Taken → Bullish Reversal
This is the basis of a Turtle Soup buy scenario.
How to Trade a False Bull Flag
A false bull flag should first have bearish higher timeframe context.
For example:
- Price is in premium
- Price is inside a higher timeframe bearish order block
- The market is showing distribution
- The bullish trend may be mature
A lower timeframe bull flag then forms.
Do not immediately sell simply because the pattern appears.
Wait for evidence that the bullish continuation is failing.
Price may trade slightly above a short-term high and then begin breaking lower.
Once bearish price action develops, identify the first return to a bearish order block.
A simple model is:
1. Identify Higher Timeframe Premium
Study the daily or 4-hour price range.
2. Find Bearish Institutional Context
Look for a bearish order block or distribution area.
3. Observe the Bull Flag
A strong rally and short consolidation develop.
4. Wait for Buy-Side Liquidity to be Taken
Price may briefly trade above a short-term high.
5. Wait for Bearish Breakdown
The apparent bull flag begins failing.
6. Identify the Bearish Order Block
Look for the last up candle before bearish expansion.
7. Sell the Return
A return to the bearish order block can provide the short setup.
8. Place Risk Above the False Flag High
The false flag high can provide a logical risk reference.
The initial objective may be the liquidity void created by the false flag.
Lower liquidity can provide additional objectives.
How to Trade a False Bear Flag
A false bear flag begins with bullish higher timeframe context.
For example:
- Price is in discount
- Price has reached an accumulation area
- Sell-side liquidity has been raided
- Higher timeframe support is present
A bear flag then appears on the lower timeframe.
The ICT trader does not automatically buy.
Wait for price to show bullish intent.
A useful confirmation is the violation of a swing high.
The model becomes:
1. Identify Higher Timeframe Discount
Study the larger price range.
2. Find a Higher Timeframe Buying Premise
Price may be returning to an accumulation or institutional buying area.
3. Observe the Bear Flag
A strong decline and small upward consolidation form.
4. Watch for Sell-Side Liquidity
Price may briefly violate a short-term low.
5. Wait for a Swing High to be Violated
The bullish structure begins to develop.
6. Find the Last Down Candle
The bearish candle before bullish expansion can become a bullish order block.
7. Buy the Return
A retracement into the bullish order block can provide a long setup.
8. Place the Stop Below the False Flag Low
The flag low can provide a logical invalidation reference.
Potential upside objectives may include equal highs, old highs and other buy-side liquidity pools.
Use Candle Bodies and Liquidity Voids
The ICT Market Maker Trap False Flag lesson also focuses on candle bodies and liquidity voids.
Large wicks should not always dominate the analysis.
The trader can study the bodies of higher timeframe candles to identify where the more meaningful price ranges are located.
Suppose price rallies and then drops aggressively.
The move creates a liquidity void.
Price may later return to fill part of this inefficient price range.
The ICT trader studies:
- Open prices
- Candle bodies
- Order block ranges
- Mean thresholds
- Liquidity voids
A false bull flag may rally into a bearish institutional price level while visually appearing bullish.
The apparent breakout can simply fill a previous liquidity void before price expands lower.
The pattern traps traders because the lower timeframe appearance hides the larger institutional context.
Premium and Discount Help Identify False Flags
Premium and discount are among the most important filters for the Market Maker Trap False Flag.
Consider a significant price swing.
Use the high and low to define the dealing range.
The midpoint is equilibrium.
Above equilibrium is premium.
Below equilibrium is discount.
A bull flag forming deep in premium should be viewed carefully.
Ask:
Is this really a continuation setup, or is price being distributed to willing buyers?
A bear flag forming deep in discount also requires caution.
Ask:
Is this really a continuation short, or is price being accumulated after taking sell-side liquidity?
The concept can be simplified as:
Bull Flag in Premium = Possible False Bull Flag
Bear Flag in Discount = Possible False Bear Flag
This does not mean every flag in premium or discount will fail.
The trader still needs higher timeframe institutional context and lower timeframe confirmation.
Market Maker Trap False Flag Trading Model
The complete ICT model can be simplified into the following framework.
False Bull Flag Model
Higher Timeframe Premium
↓
Bearish Order Block / Distribution
↓
Lower Timeframe Bull Flag
↓
Retail Bullish Expectation
↓
Short-Term High or Buy-Side Liquidity Taken
↓
Bearish Breakdown
↓
Return to Bearish Order Block
↓
Short Toward Lower Liquidity
False Bear Flag Model
Higher Timeframe Discount
↓
Accumulation / Institutional Buying Area
↓
Lower Timeframe Bear Flag
↓
Retail Bearish Expectation
↓
Short-Term Low or Sell-Side Liquidity Taken
↓
Swing High Violated
↓
Return to Bullish Order Block
↓
Long Toward Higher Liquidity
The visible flag creates the retail expectation.
Higher timeframe context provides the real directional premise.
Common Mistakes When Trading False Flags
The first mistake is selling every bull flag.
A false flag requires context.
The second mistake is buying every bear flag.
The market may still be in a strong bearish trend.
The third mistake is ignoring the higher timeframe.
A 5-minute or 15-minute chart alone may not reveal why the flag should fail.
The fourth mistake is entering before confirmation.
Wait for the apparent continuation pattern to begin failing.
The fifth mistake is ignoring premium and discount.
These help identify whether price is trading in a more favorable distribution or accumulation area.
The sixth mistake is ignoring liquidity.
The false breakout may exist specifically to take stops above or below the pattern.
The seventh mistake is trading chart shapes instead of price context.
A pattern does not automatically create price movement.
Final Thoughts on ICT Market Maker Trap False Flag
The Market Maker Trap False Flag concept teaches ICT (Inner Circle Trader) students to question obvious continuation patterns.
Michael J. Huddleston developed and teaches this concept as a way to understand how classic bull flags and bear flags can trap traders when they form at important higher timeframe levels.
The core idea is:
Do not trade the pattern alone.
A bull flag in a mature bullish move or higher timeframe premium can become a false bullish signal.
A bear flag in a mature bearish move or higher timeframe discount can become a false bearish signal.
The ICT trader studies:
Higher Timeframe Context → Premium or Discount → Institutional Order Flow → Liquidity → False Flag → Confirmation
When a bull flag forms in a bearish premium environment, the trader watches for buy-side liquidity to be taken and price to break lower.
When a bear flag forms in a bullish discount environment, the trader watches for sell-side liquidity to be taken and a swing high to be violated.
The most important lesson from the Market Maker Trap False Flag is to understand what other traders are likely seeing.
As Michael J. Huddleston explains:
“I’m looking for reasons why other traders will view the opposite side of the marketplace.”
For ICT traders, the obvious continuation pattern can sometimes be the trap itself.