Time & Price Theory is an important ICT (Inner Circle Trader) framework used to understand how price behaves around key opening prices across monthly, weekly, and daily ranges.
The concept was taught by Michael J. Huddleston, the founder of ICT (Inner Circle Trader), in the ICT Forex – Market Maker Primer Course. The central idea is that traders should not study price independently from time. Instead, price should be evaluated in relation to the current monthly, weekly, or daily dealing range and its respective opening price.
As Michael J. Huddleston explains:
“Everything you seek in price action is found in this formation: the open, high, the low and the close.”
By studying how price behaves above and below important opening prices, an ICT trader can develop a clearer institutional directional bias.
What Is Time & Price Theory?
Time & Price Theory studies the relationship between a specific period of time and the price range formed during that period.
Every price candle contains four basic elements:
Open → High → Low → Close
This structure exists on every timeframe.
A one-minute candle has an open, high, low, and close.
A daily candle has the same structure.
A weekly and monthly candle also follow the same basic formation.
This is because price action is fractal in nature.
Huddleston explains:
“Price action is fractal in nature.”
Therefore, a price concept visible on a lower timeframe can also appear on a higher timeframe.
However, ICT gives greater significance to higher timeframe price action because it can provide a broader institutional perspective.
The Importance of Higher Timeframes
Although price action is fractal, ICT does not treat every timeframe as equally significant.
The major hierarchy is:
Monthly → Weekly → Daily → Lower Timeframes
The monthly chart provides the broader macro perspective.
The weekly chart provides an intermediate institutional perspective.
The daily chart provides a short-term institutional perspective.
Lower timeframes can then be used for entry refinement.
The basic Time & Price Theory process is:
Higher Timeframe Bias → Opening Price Reference → Price Trades Into Favorable Area → Lower Timeframe Setup → Expansion
The trader first determines direction and then studies how price behaves relative to the appropriate opening price.
ICT Power of Three and Time & Price Theory
Time & Price Theory connects closely with the ICT Power of Three concept.
Power of Three is generally described as:
Accumulation → Manipulation → Distribution
The opening price becomes an important reference point in this model.
In bullish conditions, price may initially trade below the opening price before expanding higher.
Open → Manipulation Below Open → Bullish Expansion → Higher Close
In bearish conditions, price may initially trade above the opening price before expanding lower.
Open → Manipulation Above Open → Bearish Expansion → Lower Close
The manipulation phase creates unfavorable sentiment for retail traders while potentially offering institutional traders better pricing.
This relationship can be studied on monthly, weekly, and daily ranges.
Monthly Time and Price Characteristics
The monthly chart provides what ICT describes as a macro institutional bias.
It allows the trader to study large sections of historical price action and understand the broader direction of the market.
When the monthly perspective is bullish:
Look for Buying Opportunities At or Below the Monthly Opening Price
When the monthly perspective is bearish:
Look for Selling Opportunities At or Above the Monthly Opening Price
This does not mean blindly buying or selling the opening price.
The opening price provides a reference point.
The trader must still identify supporting price action.
In bullish conditions, ICT wants to see evidence of buying below the monthly opening price.
For example:
Monthly Bullish Bias → Price Trades Below Monthly Open → Swing Low Forms → Strong Bullish Price Delivery → Expansion Higher
In bearish conditions:
Monthly Bearish Bias → Price Trades Above Monthly Open → Swing High Forms → Strong Bearish Price Delivery → Expansion Lower
The monthly opening price helps the trader identify where institutional buying or selling may become visible.
Why the Monthly Chart Is Important
ICT places significant emphasis on the monthly chart because it allows traders to develop a macro perspective.
A monthly chart can show:
- Long-term highs and lows
- Major liquidity pools
- Long-term market structure
- Significant reversals
- Macro price objectives
Suppose price trades below a major long-term low and then recovers above it.
A swing low may subsequently form.
If price begins showing strong bullish delivery, the trader can develop a bullish macro premise.
The trader can then mark subsequent monthly opening prices and study whether buying repeatedly appears below them.
This creates a recurring Time & Price relationship.
Bullish Macro Bias + Buying Below Monthly Open = Institutional Bullish Signature
The opposite applies in bearish market conditions.
Monthly Open as a Fair Value Reference
The monthly opening price can be treated as a reference for the developing monthly range.
When the trader is bullish, prices below the opening may provide relatively favorable buying conditions.
When bearish, prices above the opening may provide relatively favorable selling conditions.
The basic concept is:
Bullish → Buy At or Below Monthly Open
Bearish → Sell At or Above Monthly Open
However, traders must combine this with directional analysis.
An opening price alone does not determine bias.
The bias must already exist before the trader uses the opening price as a reference.
Weekly Time and Price Characteristics
The same Time & Price Theory can be applied to the weekly opening price.
The weekly chart provides an intermediate institutional bias.
It is particularly useful for:
- Short-term trading
- Swing trading
- Multi-day positions
- One to four-week trade ideas
When the weekly perspective is bullish:
Focus on Buying At or Below the Weekly Opening Price
When bearish:
Focus on Selling At or Above the Weekly Opening Price
The weekly opening price therefore provides another reference point for identifying favorable pricing.
The Monthly Bias Creates the Framework for Weekly Setups
One of the most important parts of Time & Price Theory is understanding the relationship between different timeframes.
A major monthly price shift can create the framework for weekly trade opportunities.
For example:
Monthly Bullish Bias → Weekly Price Retracement → Price Trades Below Weekly Open → Bullish Setup → Weekly Expansion Higher
The weekly setup is supported by the broader monthly premise.
This is more significant than simply identifying a random bullish pattern on a weekly chart.
Huddleston explains that not every week will move in agreement with the monthly bias.
A bullish month can contain bearish weekly retracements.
A bearish month can contain bullish weekly retracements.
However, some weeks can move aggressively in the same direction as the monthly institutional bias.
These are the weeks an ICT trader wants to identify.
Not Every Week Will Follow the Monthly Bias
A common mistake is assuming that a bullish monthly bias means every individual week must close higher.
That is incorrect.
Price can retrace.
Price can consolidate.
Price can temporarily move against the macro direction.
The important idea is to identify when the weekly Time & Price relationship begins supporting the monthly bias.
For example:
Monthly Bullish → Weekly Retracement → Weekly Open Formed → Buying Appears Below Weekly Open → Strong Expansion
This can indicate that the market is resuming the broader macro direction.
The highest-quality setups often occur when multiple timeframe perspectives begin supporting the same directional idea.
Daily Time and Price Characteristics
The daily opening price provides a short-term institutional reference point.
According to ICT, the daily timeframe is extremely important for day traders and scalpers because many significant price and liquidity reference points can be studied from the daily chart.
These include:
- Previous day highs
- Previous day lows
- Weekly highs
- Weekly lows
- Intraweek highs
- Intraweek lows
- Liquidity pools
When the daily perspective is bullish:
Look for Buying Opportunities At or Below the Daily Opening Price
When bearish:
Look for Selling Opportunities At or Above the Daily Opening Price
The same Power of Three principle can appear within a single daily range.
Bullish Daily Time & Price Model
Daily Open → Price Trades Below Open → Bullish Setup Forms → Expansion Higher
Bearish Daily Time & Price Model
Daily Open → Price Trades Above Open → Bearish Setup Forms → Expansion Lower
The trader can then use lower timeframe ICT concepts to refine the entry.
The Highest Probability Time & Price Alignment
The strongest Time & Price setups occur when the monthly, weekly, and daily perspectives support the same directional idea.
For example:
Monthly Bullish Bias
↓
Weekly Bullish Bias
↓
Daily Price Trades Below Daily Open
↓
Bullish ICT Setup Forms
↓
Expansion Higher
In this scenario, the daily trade idea is supported by both the weekly and monthly perspectives.
This is significantly more meaningful than simply buying because price traded below the daily opening price.
Huddleston explains:
“The highest probabilities in trading the daily chart is when both the monthly and weekly support the trade idea.”
This is the core of timeframe alignment in Time & Price Theory.
A Bullish Time & Price Example
Assume the monthly chart suggests higher prices.
The trader identifies a bullish macro institutional bias.
The process may look like this:
Step 1: Monthly Bias Is Bullish
Price has shown bullish market structure and is targeting higher liquidity.
Step 2: Mark the Monthly Opening Price
The trader watches for evidence of institutional buying at or below the monthly open.
Step 3: Study the Weekly Range
A weekly retracement develops.
Price trades below the weekly opening price.
Step 4: Look for Bullish Strength
A swing low forms and price begins delivering aggressively higher.
Step 5: Study the Daily Range
On a suitable day, price trades below the daily opening price.
Step 6: Refine the Entry
The trader uses an ICT entry model.
The complete hierarchy becomes:
Bullish Monthly Bias → Bullish Weekly Framework → Daily Discounted Pricing → ICT Entry → Expansion Higher
A Bearish Time & Price Example
The bearish model is the inverse.
Assume the monthly chart suggests lower prices.
The process becomes:
Bearish Monthly Bias → Mark Monthly Open → Look for Selling Above Monthly Open
Then:
Weekly Price Trades Above Weekly Open → Bearish Price Delivery Appears
Finally:
Daily Price Trades Above Daily Open → Bearish ICT Entry Setup → Expansion Lower
The complete sequence is:
Bearish Monthly Bias → Bearish Weekly Framework → Daily Premium Pricing → ICT Entry → Expansion Lower
The trader is aligning timeframes before committing capital.
Time Must Be Combined With Price
The concept is called Time & Price Theory because price alone does not provide the entire context.
A swing low may form anywhere on a chart.
However, a swing low forming below the monthly, weekly, or daily opening price during a bullish institutional environment may carry greater significance.
Similarly, a swing high forming above an important opening price during a bearish environment can become more meaningful.
Therefore:
Price Pattern Without Time Context = Limited Information
Price Pattern + Timeframe Bias + Opening Price = Greater Context
The trader studies not only what price is doing, but also where it is occurring within a specific time-based range.
Opening Prices Should Not Be Used Blindly
Time & Price Theory does not teach traders to buy every move below an opening price.
It also does not teach traders to sell every move above an opening price.
The directional premise must come first.
For example:
Price Below Daily Open ≠ Automatic Buy
The trader must ask:
- Is the monthly bias bullish?
- Is the weekly perspective supporting higher prices?
- Is price near a logical liquidity or technical reference point?
- Is bullish price delivery appearing?
The opening price provides context.
It is not a standalone trading signal.
Not Every Day Is a Trading Day
Another important ICT lesson is that having a framework does not mean a trader should enter every day.
Huddleston states:
“Even day trading is not every day trading.”
A trader may understand daily opening prices but still find no high-probability setup.
There may be a conflict between monthly and weekly direction.
Price may be consolidating.
The daily range may already be extended.
The market may not offer a favorable Time & Price relationship.
Professional analysis includes knowing when not to trade.
The purpose of Time & Price Theory is to highlight the proper environment for a setup, not to force daily participation.
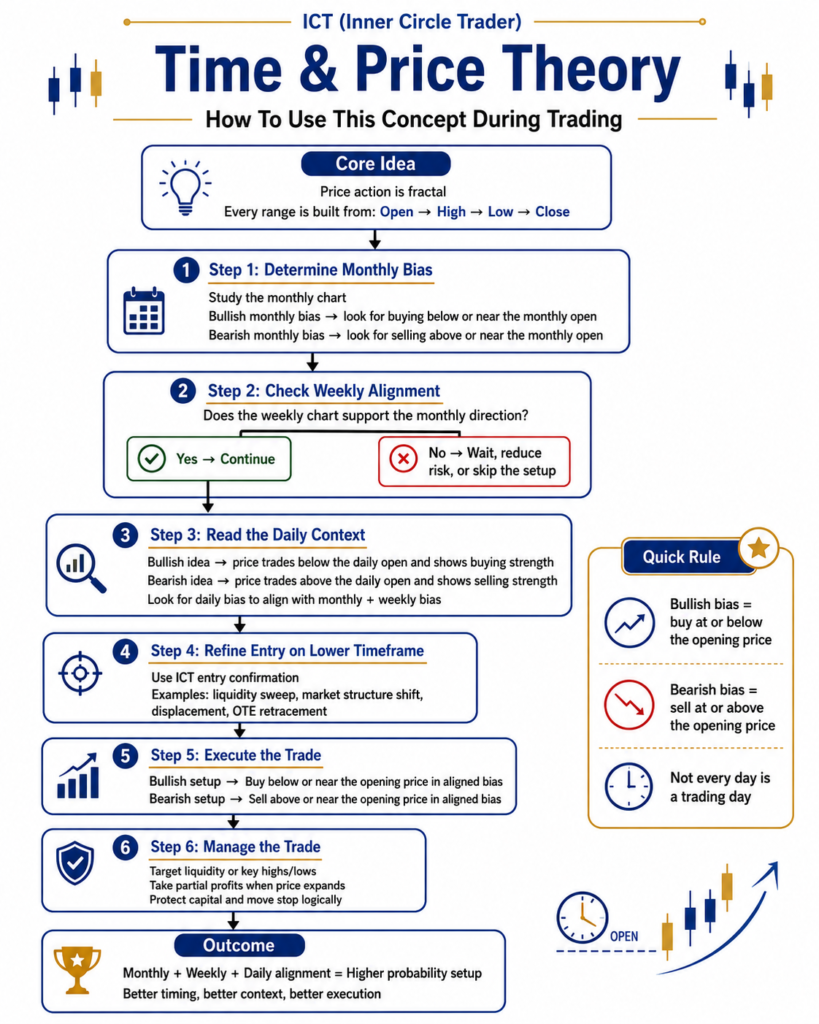
How to Use Time & Price Theory in ICT Trading
A practical process is:
Step 1: Start With the Monthly Chart
Determine the macro institutional bias.
Ask whether the market is more likely to seek higher or lower prices.
Step 2: Mark the Monthly Opening Price
Bullish → Study buying below or near the monthly open.
Bearish → Study selling above or near the monthly open.
Step 3: Analyze the Weekly Perspective
Determine whether the weekly range currently supports or retraces against the monthly direction.
Step 4: Mark the Weekly Opening Price
Look for institutional price delivery around the weekly open.
Step 5: Move to the Daily Chart
Study the short-term institutional bias.
Step 6: Mark the Daily Opening Price
Watch for favorable pricing relative to the higher timeframe bias.
Step 7: Look for Timeframe Alignment
The highest-quality environment is generally:
Monthly Bias + Weekly Bias + Daily Setup = Same Direction
Step 8: Refine the Entry
Use a suitable ICT entry concept on a lower timeframe.
Common Mistakes With Time & Price Theory
Using the Opening Price as an Entry Signal
The opening price is a reference point, not an automatic trade signal.
Ignoring Monthly Direction
Lower timeframe setups can become lower probability when they directly oppose the macro institutional bias.
Assuming Every Week Must Follow the Monthly Bias
Weekly retracements and consolidations are normal.
Assuming Every Day Must Follow the Weekly Bias
A bullish week can contain bearish daily candles.
Trading Every Daily Opening Price
Not every daily range creates a high-probability setup.
Ignoring Timeframe Alignment
The strongest setups generally appear when multiple institutional perspectives support the same direction.
Final Thoughts
Time & Price Theory is a foundational ICT (Inner Circle Trader) framework for understanding price delivery across monthly, weekly, and daily ranges.
The concept begins with a simple structure:
Open → High → Low → Close
Because price action is fractal, the same relationships can appear across different timeframes.
However, ICT gives greater significance to higher timeframe analysis.
The monthly chart establishes the macro institutional bias.
The weekly chart provides the intermediate framework.
The daily chart creates the short-term trading perspective.
The central idea is:
Bullish Bias → Look for Buying At or Below the Relevant Opening Price
Bearish Bias → Look for Selling At or Above the Relevant Opening Price
The highest-probability opportunities often appear when the monthly, weekly, and daily Time & Price perspectives align in the same direction.
Rather than reacting to random candles or isolated patterns, the ICT trader studies where price is trading in relation to time, opening prices, liquidity, and the broader institutional directional bias.