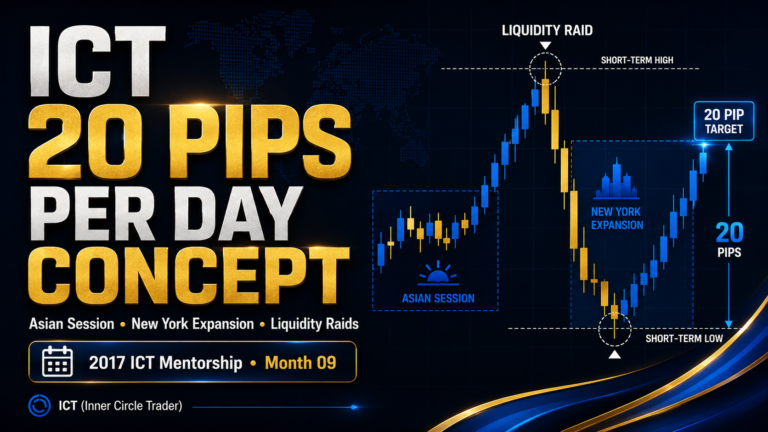
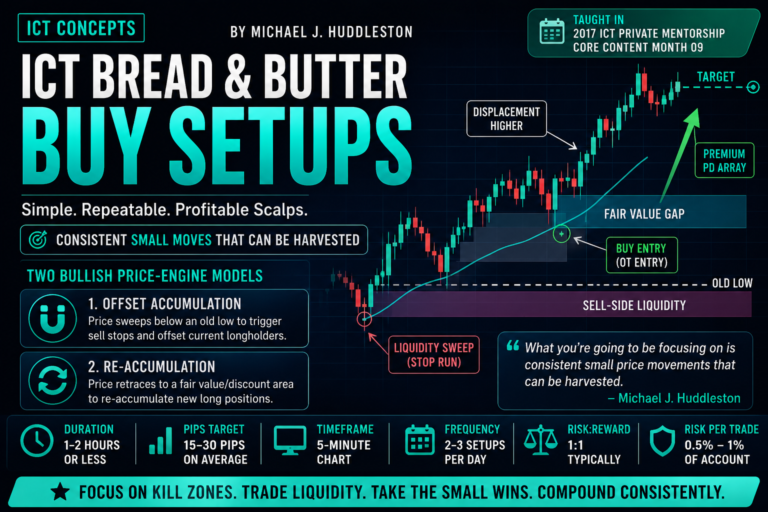
The Trading In Consolidations Concept, taught by Michael J. Huddleston, explains how traders can interpret sideways price action without blindly trading traditional breakouts.
This concept is taught in the 2017 ICT Private Mentorship Core Content Month 09 and forms part of the ICT day-trading and scalping framework.
In ICT methodology, a consolidation is not simply a quiet market. It is an area where liquidity gradually builds above and below price. Once the trader understands the higher-timeframe directional bias, the consolidation can provide opportunities to anticipate stop runs, false breakouts, and moves back toward equilibrium.
As Michael J. Huddleston explains:
“Smart money will engineer or fade breakouts of a consolidation.”
The objective is therefore not to chase every breakout. The trader first determines the likely direction from the daily and four-hour charts, then studies how price behaves around the consolidation’s highs, lows, and equilibrium.
What Is a Consolidation?
A consolidation is a period when price trades within a relatively defined range without producing a sustained directional move.
The range normally contains:
- A visible short-term high
- A visible short-term low
- An equilibrium or midpoint
- Buy-side liquidity above the range
- Sell-side liquidity below the range
As price moves sideways, orders begin to accumulate around both sides of the market.
Above the consolidation, traders may place:
- Buy-stop breakout orders
- Stop losses from short positions
- Momentum entries above resistance
Below the consolidation, traders may place:
- Sell-stop breakout orders
- Stop losses from long positions
- Momentum entries below support
This collection of orders creates open float and liquidity around the range.
Why Consolidations Matter in ICT
Retail traders often treat a consolidation as a simple support-and-resistance pattern.
They may buy when price breaks above the range or sell when price breaks below it.
ICT traders take a different approach.
The breakout may be used to:
- Trigger retail breakout entries
- Activate stop-loss orders
- Collect buy-side or sell-side liquidity
- Allow institutional traders to enter in the opposite direction
- Rebalance price toward fair value
- Begin the real directional move
Therefore, a breakout is not automatically evidence that price will continue in the breakout direction.
Start With Daily and Four-Hour Order Flow
The most important step in trading a consolidation is determining the higher-timeframe directional bias.
The trader should study the:
- Daily chart
- Four-hour chart
- Institutional order flow
- Premium and discount condition
- Active higher-timeframe PD Arrays
- Expected liquidity objective
Ideally, the daily and four-hour charts should both suggest the same direction.
For example:
- If the daily and four-hour order flow are bullish, focus on buying below the consolidation.
- If the daily and four-hour order flow are bearish, focus on selling above the consolidation.
Michael J. Huddleston states:
“The four-hour chart is your last line of defense in terms of determining directional bias.”
Lower-timeframe price action should generally remain subordinate to the higher-timeframe order flow.
The Meaning of Order Flow Subordination
Order flow subordination means that lower-timeframe price action is expected to follow the directional influence of the daily or four-hour chart.
A temporary move in the opposite direction may occur, but it can serve as a liquidity run rather than a genuine reversal.
For example:
- Bullish daily order flow may produce a temporary break below a consolidation.
- Bearish daily order flow may produce a temporary break above a consolidation.
These temporary expansions can create ideal entries in the direction of the higher-timeframe bias.
Retail Traders Chase Breakouts
Retail traders frequently wait for price to leave a consolidation before establishing a directional opinion.
Their thinking is often:
- Break above resistance means buy.
- Break below support means sell.
- Higher high means bullish structure.
- Lower low means bearish structure.
This approach causes them to enter after price has already expanded away from fair value.
They may become the liquidity required for institutional traders to take the opposite side of the move.
As Huddleston explains:
“Retail traders chase expansions that originate from the equilibrium, and smart money fades the expansions that originate from the equilibrium.”
Smart Money Fades Breakouts
Smart money does not need to chase price.
Instead, institutional traders may wait for price to move outside the consolidation and reach a known liquidity pool or PD Array.
In a bearish environment:
- Price may rally above the consolidation.
- Buy stops above an old high are triggered.
- Breakout buyers enter long.
- Institutional traders use the buying liquidity to establish short positions.
- Price then moves lower.
In a bullish environment:
- Price may decline below the consolidation.
- Sell stops below an old low are triggered.
- Breakout sellers enter short.
- Institutional traders use the selling liquidity to establish long positions.
- Price then moves higher.
The breakout can therefore function as a liquidity event rather than a genuine continuation signal.
Understanding Open Float
The longer price remains within a consolidation, the more orders may accumulate around the range.
This buildup is called open float.
Open float may include:
- Breakout entry orders
- Protective stop-loss orders
- Trailing stops
- Pending buy stops
- Pending sell stops
- Short-term speculative positions
The liquidity becomes concentrated above and below the current market price.
This is why clearly defined consolidation highs and lows often become important targets.
Buy-Side Liquidity Above the Consolidation
Buy-side liquidity generally rests above:
- Equal highs
- Old short-term highs
- Consolidation resistance
- Previous session highs
- Previous-day highs
This liquidity may consist of:
- Buy-stop breakout entries
- Stop losses from short sellers
- Momentum orders expecting continuation
When the higher-timeframe order flow is bearish, price may trade above these highs to collect the buy-side liquidity before reversing lower.
Sell-Side Liquidity Below the Consolidation
Sell-side liquidity generally rests below:
- Equal lows
- Old short-term lows
- Consolidation support
- Previous session lows
- Previous-day lows
This liquidity may consist of:
- Sell-stop breakout entries
- Stop losses from long positions
- Momentum orders expecting continuation lower
When the higher-timeframe order flow is bullish, price may trade below these lows to collect sell-side liquidity before reversing higher.
Equilibrium Inside the Consolidation
The equilibrium is the midpoint or 50% level of the consolidation range.
It represents the approximate fair-value area within the range.
Price often moves away from equilibrium, trades through liquidity outside the range, and then returns toward the midpoint.
This creates a practical target for trades taken after a false breakout.
Michael J. Huddleston explains:
“Price, while in consolidations, is always going to want to gravitate back to the mean.”
The opposite side of the consolidation may eventually be reached, but the equilibrium is often the more conservative and reliable initial objective.
Bullish Consolidation Setup
A bullish consolidation setup begins with bullish daily or four-hour institutional order flow.
The trader then waits for price to move below:
- A short-term low
- Equal lows
- The consolidation low
- The Asian session low
- The previous day’s low
This movement below the range is viewed as a run on sell-side liquidity.
Retail traders may interpret the move as bearish and enter short.
However, ICT traders consider whether the selling pressure is being used by institutional traders to accumulate long positions.
Bullish Sequence
A common bullish sequence is:
- Daily or four-hour order flow is bullish.
- Price forms a lower-timeframe consolidation.
- The consolidation midpoint is identified.
- Sell stops accumulate below the range.
- Price expands below equilibrium.
- A short-term low is violated.
- Retail traders sell the apparent breakdown.
- Smart money uses the selling liquidity to buy.
- Price returns toward equilibrium.
- Price may continue toward buy-side liquidity above the range.
The break below the low is not automatically bearish market structure. It may be a liquidity sweep within a bullish higher-timeframe environment.
Bullish Entry Area
The preferred bullish area is generally below the consolidation low, particularly when price also reaches:
- A bullish order block
- A discount fair value gap
- An old low
- The Asian session low
- A previous-day low
- A higher-timeframe discount PD Array
The trader should still wait for a valid entry model rather than buying immediately after price crosses the low.
Possible confirmations may include:
- Market Structure Shift
- Displacement
- Fair Value Gap
- Order Block reaction
- Change in State of Delivery
- Rejection from a discount PD Array
Bullish Profit Objectives
The first practical objective may be the equilibrium of the consolidation.
Additional targets may include:
- The opposite side of the range
- Equal highs
- Buy-side liquidity
- Previous session high
- Previous-day high
- A premium PD Array
The trader should not assume that price must always reach the opposite side of the range.
The return to equilibrium may provide enough movement for a valid day trade.
Bearish Consolidation Setup
A bearish consolidation setup begins with bearish daily or four-hour institutional order flow.
The trader then waits for price to move above:
- A short-term high
- Equal highs
- The consolidation high
- The Asian session high
- The previous day’s high
This movement above the range is viewed as a run on buy-side liquidity.
Retail traders may interpret the breakout as bullish and enter long.
ICT traders instead consider whether the buying pressure is being used by institutional traders to establish short positions.
Bearish Sequence
A common bearish sequence is:
- Daily or four-hour order flow is bearish.
- Price forms a lower-timeframe consolidation.
- The consolidation midpoint is identified.
- Buy stops accumulate above the range.
- Price expands above equilibrium.
- A short-term high is violated.
- Retail traders buy the apparent breakout.
- Smart money uses the buying liquidity to sell.
- Price returns toward equilibrium.
- Price may continue toward sell-side liquidity below the range.
The move above the high may be a stop run rather than the beginning of a bullish trend.
Bearish Entry Area
The preferred bearish area is generally above the consolidation high, especially when price also reaches:
- A bearish order block
- A premium fair value gap
- An old high
- The Asian session high
- A previous-day high
- A higher-timeframe premium PD Array
The trade should be supported by a valid bearish entry model.
Possible confirmation may include:
- Bearish displacement
- Market Structure Shift
- Fair Value Gap
- Bearish order block
- Change in State of Delivery
- Rejection from a premium PD Array
Bearish Profit Objectives
The first practical objective may be the equilibrium of the consolidation.
Additional targets may include:
- The opposite side of the range
- Equal lows
- Sell-side liquidity
- Previous session low
- Previous-day low
- A discount PD Array
The equilibrium target allows the trader to manage the position without assuming that price must cross the entire consolidation.
Equal Highs and Equal Lows Inside the Range
Equal highs and equal lows often form during consolidation.
Retail traders may treat them as strong support or resistance.
ICT traders view them as areas where liquidity may be accumulating.
For example:
- Equal highs may attract buy stops.
- Equal lows may attract sell stops.
- Repeated tests can increase the number of resting orders.
- A brief breakout can be used to collect those orders.
- Price may then reverse in the higher-timeframe direction.
The more obvious a level appears to retail traders, the more useful it may become as a liquidity reference point.
A Break in Structure Is Not Always Genuine
One of the most common mistakes is treating every short-term high or low violation as a genuine change in trend.
Inside a consolidation:
- A break above a short-term high may be a buy-stop run.
- A break below a short-term low may be a sell-stop run.
- The move may provide liquidity for the opposite direction.
- Higher-timeframe order flow remains the dominant factor.
Therefore, the trader should not evaluate lower-timeframe structure without considering the daily and four-hour context.
Premium and Discount Within the Range
The equilibrium divides the consolidation into two sections.
The upper half represents premium.
The lower half represents discount.
In bullish conditions:
- Focus on buying below equilibrium.
- Prefer entries near sell-side liquidity.
- Avoid chasing price in premium.
In bearish conditions:
- Focus on selling above equilibrium.
- Prefer entries near buy-side liquidity.
- Avoid chasing price in discount.
This framework helps the trader avoid buying high or selling low inside the consolidation.
How to Trade a Consolidation Step by Step
Step 1: Establish the Higher-Timeframe Bias
Study the daily and four-hour charts.
Determine whether institutional order flow is bullish or bearish.
Step 2: Identify the Consolidation
Mark the clearly defined short-term high and low.
Avoid forcing a range where one does not exist.
Step 3: Mark Equilibrium
Measure the midpoint of the consolidation.
This separates premium from discount.
Step 4: Identify Liquidity
Mark buy-side liquidity above the range and sell-side liquidity below it.
Step 5: Wait for Expansion
Do not trade randomly inside the middle of the consolidation.
Wait for price to expand away from equilibrium.
Step 6: Compare the Expansion With the Bias
If the higher-timeframe bias is bullish, focus on moves below the range.
If the higher-timeframe bias is bearish, focus on moves above the range.
Step 7: Wait for Confirmation
Look for displacement, a Market Structure Shift, a Fair Value Gap, or another valid ICT entry model.
Step 8: Target Equilibrium First
Use the midpoint as the initial conservative objective.
Step 9: Consider the Opposite Liquidity Pool
Hold a portion only when price action and higher-timeframe context support further expansion.
Common Mistakes When Trading Consolidations
Trading Both Sides of the Range
A trader should normally focus on one side based on the higher-timeframe bias.
Trading both directions can lead to repeated losses in choppy conditions.
Chasing the Breakout
Entering immediately after price breaks the range may place the trader directly into a liquidity sweep.
Ignoring Daily and Four-Hour Order Flow
Lower-timeframe setups become less reliable when they conflict with the dominant higher-timeframe direction.
Entering Near Equilibrium
The middle of the range often offers poor risk-to-reward conditions.
Better opportunities generally form near the outer edges of the consolidation.
Treating Support and Resistance Mechanically
An old high or low should be understood as a liquidity reference point, not an automatic reversal level.
Expecting the Opposite Side Every Time
The market may return only to equilibrium before reversing again.
Taking partial profit at the midpoint can reduce unnecessary risk.
Entering Without Confirmation
A liquidity sweep alone does not guarantee reversal.
The trader should wait for evidence that price is delivering in the expected direction.
Example of a Bullish Consolidation Trade
Assume the daily and four-hour charts show bullish institutional order flow.
Price forms a consolidation on the 15-minute chart.
The range contains equal lows near the Asian session low.
Retail traders identify the equal lows as support and place stop losses beneath them.
Price later trades below those lows and enters a higher-timeframe discount Fair Value Gap.
Instead of selling the breakdown, the ICT trader waits for bullish displacement and a Market Structure Shift.
A long position is taken from a lower-timeframe Fair Value Gap.
The first target is the equilibrium of the consolidation.
The second target is buy-side liquidity above the consolidation high.
Example of a Bearish Consolidation Trade
Assume the daily and four-hour charts show bearish institutional order flow.
Price forms a consolidation on the hourly chart.
The range contains equal highs near the previous day’s high.
Retail traders sell at the equal highs and place stop losses above them. Breakout traders also prepare to buy above the range.
Price later moves above the highs and reaches a premium bearish Order Block.
The ICT trader waits for bearish displacement and a lower-timeframe Market Structure Shift.
A short position is taken from a Fair Value Gap.
The first target is the consolidation equilibrium.
The second target is sell-side liquidity beneath the consolidation low.
Trading Consolidations Checklist
Before taking a consolidation trade, confirm:
- Is the daily order flow clear?
- Does the four-hour chart support the same direction?
- Is there a clearly defined consolidation?
- Where is the equilibrium?
- Where is buy-side liquidity?
- Where is sell-side liquidity?
- Is price expanding away from equilibrium?
- Is the expansion against the higher-timeframe bias?
- Has price reached a relevant PD Array?
- Has a valid entry model formed?
- Is equilibrium a logical first target?
- Is there sufficient time and volatility for the trade?
Final Thoughts
The Trading In Consolidations Concept teaches traders to stop viewing every breakout as a continuation signal.
A consolidation allows liquidity to accumulate above and below price. Retail traders often chase the eventual breakout, while institutional traders may use that breakout to collect stops and enter in the opposite direction.
The daily and four-hour institutional order flow determine which side of the consolidation should receive the trader’s attention.
When the higher-timeframe bias is bullish, a move below the consolidation may represent the collection of sell-side liquidity.
When the higher-timeframe bias is bearish, a move above the consolidation may represent the collection of buy-side liquidity.
By combining higher-timeframe direction, equilibrium, premium and discount, liquidity, and lower-timeframe confirmation, the Trading In Consolidations Concept can help ICT traders avoid false breakouts and find lower-risk entries around the edges of a range.