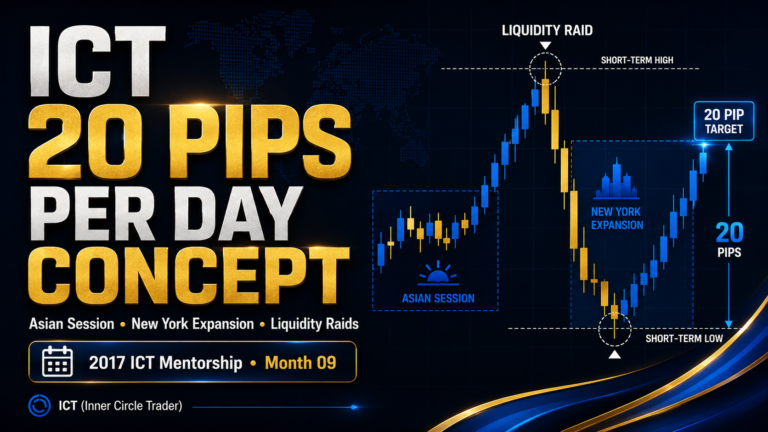
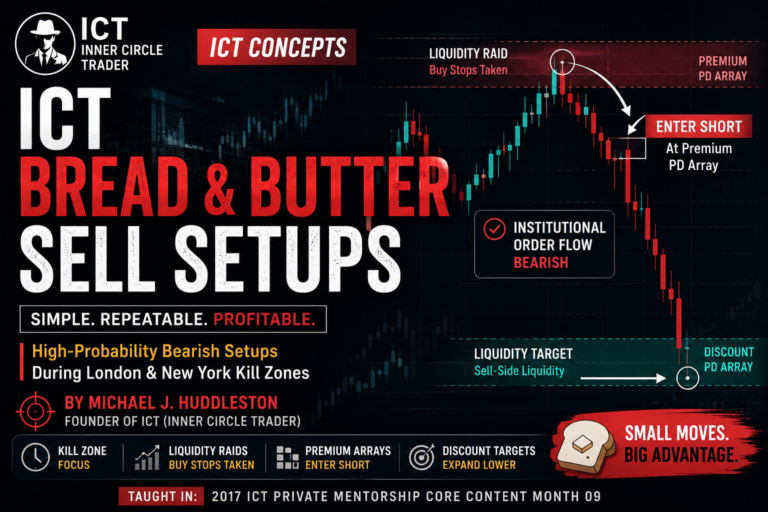
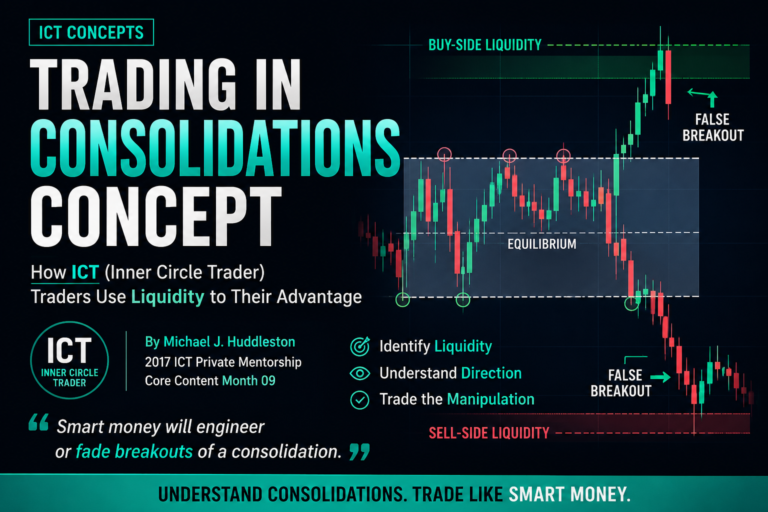
The ICT Bread & Butter Buy Setups, developed and taught by Michael J. Huddleston, explain how traders can identify repeatable bullish intraday opportunities by combining higher-timeframe institutional order flow, discount PD Arrays, liquidity, and session timing.
This concept is taught in the 2017 ICT Private Mentorship Core Content Month 09 as part of ICT day trading and scalping.
The objective is not to capture the entire daily range. Instead, traders focus on relatively small and consistent bullish price movements that may appear during active trading sessions.
As Michael J. Huddleston explains:
“What you’re going to be focusing on is consistent small price movements that can be harvested.”
These setups are called bread-and-butter opportunities because they are designed to provide practical, repeatable trading models rather than rare, oversized trades.
What Are ICT Bread & Butter Buy Setups?
The ICT Bread & Butter Buy Setups are short-term bullish trading models used when higher-timeframe institutional order flow suggests that price should move higher.
The trader looks for price to temporarily move lower into:
- Sell-side liquidity
- A bullish Order Block
- A Fair Value Gap
- A liquidity void
- An Optimal Trade Entry
- Another discount PD Array
This temporary decline allows institutional traders to enter long positions at more favorable prices.
Once the sell-side liquidity has been used to facilitate buying, price may expand toward a nearby premium PD Array.
The Main Objective
The primary objective is to capture small bullish intraday movements.
The expected characteristics generally include:
- A trade lasting two hours or less
- A target of approximately 15 to 30 pips
- Execution on the five-minute chart
- One setup during an active session
- A risk-to-reward ratio near 1:1
- Risk of approximately 0.5% to 1%
These are scalping setups, so the trader should not automatically expect a large daily or weekly expansion from every entry.
Higher-Timeframe Institutional Order Flow Comes First
Before looking for a buy setup, the trader must determine whether the market is bullish from an institutional perspective.
The directional analysis should begin on the:
- Monthly chart
- Weekly chart
- Daily chart
- Four-hour chart
The trader studies how price reacts to higher-timeframe PD Arrays.
Bullish institutional order flow may be indicated when:
- Old highs are being broken
- Important lows remain protected
- Down-close candles provide support
- Bearish Order Blocks are displaced through
- Liquidity voids are filled and price rallies
- Fair Value Gaps provide support
- Price reacts from discount PD Arrays
- Recent sell-side liquidity raids are followed by displacement higher
The lower-timeframe buy setup should support this broader bullish expectation.
The Two Bullish Price-Engine Models
Michael J. Huddleston teaches two primary price-engine models for bread-and-butter buy setups:
- Offset accumulation
- Re-accumulation
Both models create opportunities for institutional traders to buy at discount prices, but they form in slightly different ways.
Offset Accumulation
Offset accumulation occurs when price trades beneath an old low to trigger sell-side liquidity.
This may include:
- Stop losses from existing long positions
- Sell-stop breakout entries
- Orders from traders selling weakness
- Stops below equal lows
- Stops below session lows
- Stops below previous-day lows
The selling created beneath the low provides counterparty liquidity for institutional long positions.
Michael J. Huddleston explains:
“Its primary purpose is to offset current long holders or induce more sellers at discount pricing.”
After accumulating below the old low, price may expand toward a short-term premium PD Array.
How Offset Accumulation Works
A typical offset-accumulation sequence is:
- Higher-timeframe order flow is bullish.
- A visible short-term low forms.
- Sell stops accumulate beneath the low.
- Price rapidly trades below the low.
- Existing long holders are stopped out.
- Breakout traders enter short.
- Institutional traders use the selling liquidity to enter long.
- Price displaces higher.
- A premium PD Array becomes the objective.
The move beneath the low is therefore not necessarily bearish. It may be an engineered liquidity event within a bullish market.
Where Offset Accumulation Usually Forms
Offset accumulation may occur beneath:
- The Asian session low
- The London session low
- A previous-day low
- Equal lows
- A short-term intraday low
- The midnight opening price
- A higher-timeframe discount PD Array
The model often develops quickly, so the trader must identify important lows before price reaches them.
Re-Accumulation
Re-accumulation occurs when a bullish market retraces into a fair-value or discount price area.
Unlike offset accumulation, price does not always need to sweep a major old low.
The purpose of the retracement is to:
- Offer institutional traders another long-entry opportunity
- Remove weak long holders
- Trigger tight stop losses
- Induce short-term selling
- Reprice the market into fair value
The selling created during the retracement becomes liquidity for additional institutional buying.
How Re-Accumulation Works
A typical re-accumulation sequence is:
- Higher-timeframe order flow is bullish.
- Price produces an initial bullish expansion.
- The market retraces lower.
- Weak long holders close or are stopped out.
- Short-term sellers enter during the decline.
- Price reaches a discount PD Array.
- Institutional traders accumulate new long positions.
- Price resumes its bullish expansion.
- A premium PD Array becomes the objective.
Michael J. Huddleston explains:
“Its primary purpose is to reaccumulate new long entries and/or induce more sellers at discount pricing.”
Common Re-Accumulation Entry Areas
Re-accumulation frequently develops at:
- Bullish Fair Value Gaps
- Bullish Order Blocks
- Liquidity voids
- Optimal Trade Entry zones
- Discount portions of an intraday range
- Previous resistance that now provides support
- Higher-timeframe bullish PD Arrays
The retracement should occur inside a market that is already showing bullish institutional sponsorship.
Difference Between Offset Accumulation and Re-Accumulation
The two models share the same bullish objective, but they use different forms of liquidity.
Offset Accumulation
Price trades below an old low and triggers sell stops.
The liquidity event is usually obvious and aggressive.
Re-Accumulation
Price retraces into fair value without necessarily raiding a major low.
The opportunity is created through a controlled decline into a discount PD Array.
Both models are designed to provide institutional traders with selling liquidity that can be paired with long positions.
Realistic Trade Objectives
The ICT Bread & Butter Buy Setups are scalping models.
The trader should maintain realistic expectations.
Typical characteristics include:
- Trade duration: One to two hours or less
- Average objective: 15 to 30 pips
- Execution chart: Five-minute timeframe
- Expected setups: Approximately two or three per day across several markets
- Session frequency: Roughly one potential opportunity per active session
- Risk-to-reward: Commonly around 1:1
- Risk per trade: Approximately 0.5% to 1%
The exact opportunity depends on volatility, market conditions, and the instrument being traded.
Why ICT Kill Zones Matter
All bread-and-butter scalping should be focused around the ICT Kill Zones.
Scalping requires volatility because the trade duration and profit objective are relatively small.
The most important sessions are:
- London Kill Zone
- New York Kill Zone
- London Close
- Asian session
The best opportunities generally occur during London and New York because these periods normally produce more liquidity and displacement.
As Michael J. Huddleston states:
“All scalping should be done during ICT kill zones.”
Why the Five-Minute Chart Is Used
The five-minute chart provides enough detail for scalping without producing as much noise as the one-minute chart.
It allows the trader to identify:
- Sell-side liquidity raids
- Fair Value Gaps
- Bullish Order Blocks
- Optimal Trade Entry retracements
- Short-term Market Structure Shifts
- Displacement
- Session-based Judas Swings
The higher-timeframe bias still comes from the monthly, weekly, daily, and four-hour charts.
The five-minute chart is used for execution, not for determining the primary directional bias.
The Bullish Daily Range Profile
When higher-timeframe institutional order flow is bullish, the opening price should generally form near the lower portion of the daily range.
Price may trade slightly below the opening before expanding higher.
The trader monitors both:
- 00:00 New York opening price
- 00:00 GMT opening price
A bullish daily profile may include:
- Price opens near the daily low.
- A small decline occurs after the opening.
- Sell-side liquidity is collected.
- London produces the first bullish expansion.
- London lunch creates consolidation or retracement.
- New York continues the move higher.
- Price reaches the Average Daily Range high.
- The daily high may form around London Close.
- Price may close slightly below the high.
This is a general profile, not a guaranteed pattern.
The London Bread & Butter Buy Setup
The London session may form the daily low when higher-timeframe order flow is bullish.
A common London setup begins after the New York midnight opening.
Price may trade lower after midnight, creating the London Judas Swing.
The trader looks for this decline to enter:
- Sell-side liquidity
- A bullish Fair Value Gap
- A bullish Order Block
- A discount PD Array
After the liquidity event, price may expand higher during the London Kill Zone.
London Buy Setup Sequence
A practical London buy sequence is:
- Confirm bullish higher-timeframe order flow.
- Mark the New York midnight opening price.
- Identify nearby sell-side liquidity.
- Mark discount PD Arrays beneath price.
- Wait for the Judas Swing lower.
- Look for a liquidity sweep or discount reaction.
- Confirm bullish displacement.
- Enter from a five-minute PD Array.
- Target 15 to 30 pips or the next premium PD Array.
The trader should avoid chasing price after the initial expansion has already occurred.
London Session Targets
Potential London targets include:
- Asian session high
- Previous short-term high
- Buy-side liquidity
- A five-minute bearish Fair Value Gap
- A higher-timeframe premium PD Array
- The projected Average Daily Range high
London may complete approximately 40% to 60% of the expected daily range before London lunch.
London Lunch Re-Accumulation
London lunch generally occurs between 05:00 and 07:00 New York time.
During bullish conditions, the market may:
- Consolidate
- Retrace lower
- Enter a Fair Value Gap
- Reach a bullish Order Block
- Form an Optimal Trade Entry
This retracement can create a re-accumulation opportunity before the New York session.
However, this period is normally quieter. The trader should be selective because some sessions do not produce enough volatility.
The New York Bread & Butter Buy Setup
The New York session can provide another bullish setup after London has already confirmed institutional sponsorship.
When London forms the daily low and produces a bullish expansion, New York may retrace before continuing higher.
The trader looks for a New York Judas Swing into a discount PD Array.
Important references include:
- The 08:20 New York CME opening
- London session low
- London Fair Value Gaps
- Intraday bullish Order Blocks
- Optimal Trade Entry levels
- Sell-side liquidity below short-term lows
New York Buy Setup Sequence
A practical New York buy sequence is:
- Confirm bullish higher-timeframe order flow.
- Confirm that London showed bullish sponsorship.
- Mark the 08:20 New York CME opening.
- Wait for a retracement after the opening.
- Identify a discount PD Array.
- Look for a sweep of short-term sell-side liquidity.
- Confirm bullish displacement.
- Enter from a five-minute Fair Value Gap or Order Block.
- Target the Average Daily Range high or another premium PD Array.
The entry should not be taken if the market has already reached a major higher-timeframe premium objective.
New York Profit Management
If price reaches the five-day Average Daily Range high before 10:00 New York time, most of the position should be secured.
A practical method is:
- Close approximately 80% of the position.
- Leave a smaller portion open.
- Protect the remaining position.
- Allow for the possibility of an expanded daily range.
Price can occasionally exceed the Average Daily Range significantly.
The ADR level is an expectation, not a barrier.
The Five-Day Average Daily Range
The five-day Average Daily Range helps estimate how far price may travel during the trading day.
In a bullish market, the projected ADR high can serve as:
- A profit objective
- A range-expansion reference
- A point for reducing exposure
- A potential daily-high area
However, traders should not assume that price must reverse exactly at the ADR high.
Strong bullish days can exceed or even double the average range.
London Close and Bullish Days
During a strong bullish day, London and New York may both move higher.
The daily high may form between approximately 10:30 and 13:00 New York time.
Price may then retrace from the high.
The retracement often represents approximately 20% to 30% of the completed daily range.
However, London Close reversal trades are less reliable when bullish displacement remains strong.
A trader holding a long position should not automatically close everything simply because the market has entered the London Close period.
The Asian Session Buy Setup
The Asian session may offer smaller bullish scalps.
When the market is bullish, price may trade at or slightly below the 00:00 GMT opening before expanding approximately 15 to 20 pips.
However, the Asian session generally produces a narrow range.
This creates a conflict:
- The trader wants a bullish scalp.
- The broader daily model may require Asia to remain contained.
Therefore, the Asian-session buy setup is less attractive than London or New York.
Asian Session Trade Management
When trading an Asian-session scalp:
- Target approximately 15 to 20 pips.
- Take full profit.
- Do not expect a second major expansion.
- Avoid holding the trade as though it is the final daily low.
- Remain aware that London may later produce a deeper Judas Swing.
A profitable Asian scalp can become a losing trade when the trader becomes greedy and holds through the London liquidity raid.
Market Orders and Limit Orders
For scalping, Michael J. Huddleston generally favors active execution.
Market orders can be useful because:
- The setup develops quickly.
- Price may not return to the perfect entry.
- The trader is actively monitoring the market.
- The expected move is relatively small.
Limit orders may occasionally execute outside a Kill Zone, particularly during London lunch or after the New York open.
A practical approach is:
- Use market orders for entries when confirmation appears.
- Use limit orders for profit targets.
- Avoid placing unattended scalp orders in low-volatility periods.
Entry Confirmation
The liquidity sweep or retracement alone does not create a complete setup.
The trader should look for confirmation such as:
- Bullish displacement
- Market Structure Shift
- Fair Value Gap formation
- Bullish Order Block
- Change in State of Delivery
- Rejection from a discount PD Array
- Failure to continue below a liquidity sweep
The best entry usually forms after price shows that institutional buyers are actively repricing the market higher.
Profit Objectives
Common profit targets include:
- 15 to 20 pips
- 20 to 30 pips
- The next short-term high
- Asian session high
- London session high
- Buy-side liquidity
- Average Daily Range high
- A higher-timeframe premium PD Array
Because the setup is designed for scalping, traders should avoid turning every position into a long-duration trade.
Risk Management
Risk should remain modest because scalping opportunities may occur frequently.
A reasonable risk structure includes:
- Begin with approximately 0.5% risk.
- Increase toward 1% only after demonstrating consistency.
- Avoid risking more than 1%.
- Use a stop based on the setup’s invalidation point.
- Maintain realistic 1:1 expectations.
- Do not increase risk simply because a setup appears obvious.
Frequent setups do not justify aggressive risk.
Bread & Butter Buy Setup Checklist
Before entering a bullish scalp, confirm:
- Is higher-timeframe institutional order flow bullish?
- Is price trading near a discount PD Array?
- Has sell-side liquidity been identified?
- Is the setup offset accumulation or re-accumulation?
- Is the trade forming during an ICT Kill Zone?
- Is price near an important session opening?
- Has a Judas Swing occurred?
- Is there bullish displacement?
- Has a valid five-minute entry model formed?
- Is the next premium PD Array clearly defined?
- Is a 15-to-30-pip objective realistic?
- Is the risk limited to 0.5% to 1%?
- Has price already reached the ADR high?
- Is there enough time and volatility remaining?
Common Mistakes
Buying Without Higher-Timeframe Confirmation
A lower-timeframe liquidity sweep does not automatically make the market bullish.
The setup must align with institutional order flow.
Chasing the Initial Expansion
The trader should wait for a discount entry rather than buying after price has already expanded.
Treating Every Old Low as a Buy
An old low becomes meaningful only when it aligns with bullish order flow, liquidity, timing, and a discount PD Array.
Trading Outside Active Sessions
Scalping requires volatility.
Setups forming outside Kill Zones may not produce enough movement.
Expecting Large Risk-to-Reward Ratios
These are bread-and-butter scalps.
A realistic 1:1 trade is acceptable when the setup is repeatable and risk is controlled.
Holding Asian Scalps Too Long
The Asian range may later be raided during London.
Take the intended profit and avoid turning a scalp into an unplanned position trade.
Assuming ADR Must Stop Price
The Average Daily Range is not a resistance barrier.
Price can expand significantly beyond it during high-volatility conditions.
Risking Too Much
The frequency of setups can tempt traders to overtrade or increase risk.
The risk per setup should remain small.
Practical Bullish Example
Assume the daily and four-hour charts show bullish institutional order flow.
Price rallies during London and then retraces during the New York Kill Zone.
The retracement trades below a short-term low and enters a five-minute bullish Fair Value Gap.
This movement triggers sell stops and removes weak long holders.
Price then produces bullish displacement and leaves another Fair Value Gap.
The trader enters long from the retracement into that gap.
The target is the next short-term high or the five-day Average Daily Range high.
The position is closed after approximately 20 to 30 pips.
This is a classic bread-and-butter re-accumulation setup.
Final Thoughts
The ICT Bread & Butter Buy Setups focus on repeatable bullish scalping opportunities rather than rare, oversized market moves.
The model begins with bullish higher-timeframe institutional order flow.
Price then moves lower to create selling liquidity through either:
- Offset accumulation beneath an old low
- Re-accumulation at a fair-value or discount PD Array
The trader uses the five-minute chart to identify confirmation and executes during the ICT Kill Zones.
London and New York generally provide the best opportunities because they offer more liquidity, volatility, and institutional participation.
The expected trade is relatively modest: approximately 15 to 30 pips, a duration of two hours or less, and a risk-to-reward ratio near 1:1.
When combined with disciplined risk management, session timing, liquidity, and PD Array analysis, the ICT Bread & Butter Buy Setups can provide a practical framework for identifying consistent bullish intraday trades.