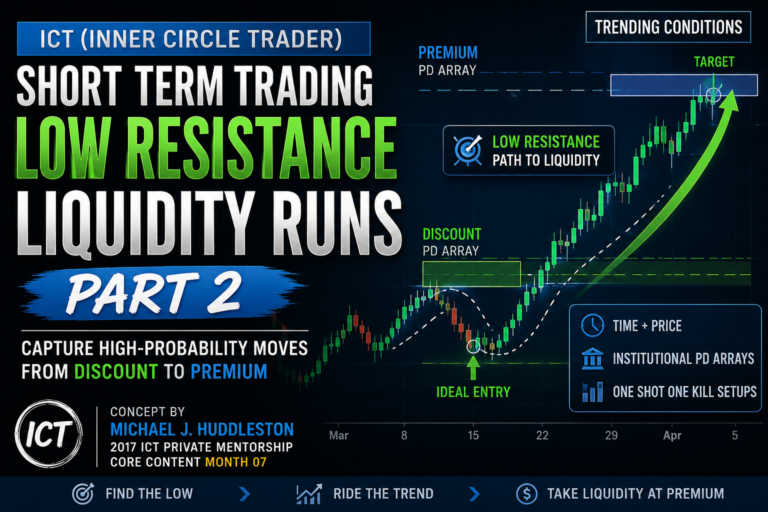
The One Shot One Kill Model is an ICT short-term trading framework designed to identify one high-probability weekly setup with a clearly defined directional bias, entry area and price objective. This concept was taught by Michael J. Huddleston, founder of ICT or Inner Circle Trader, in the 2017 ICT Private Mentorship Core Content Month 07.
The model is not based on a single indicator or entry pattern. It combines higher-time-frame analysis, IPDA Data Ranges, PD Arrays, seasonal tendencies, weekly profiles, intermarket analysis and precise lower-time-frame execution.
Michael J. Huddleston explains that the objective is to narrow the market down to:
“Very tight, small risk, high yield setups.”
The One Shot One Kill Model is therefore a top-down process. It begins with the position trader’s perspective and gradually narrows the analysis into a short-term or day-trading entry.
What Is the One Shot One Kill Model?
The One Shot One Kill Model is a structured method for finding one major trading opportunity during the week.
The trader attempts to determine:
- The likely weekly direction
- The probable high or low of the week
- The premium area for selling or discount area for buying
- The expected weekly price objective
- The best session and time for entry
- The point where the original idea becomes invalid
The goal is not to take many trades.
The goal is to wait for one well-framed setup in which multiple ICT concepts support the same directional expectation.
The Core Principle
The model combines three layers of analysis:
- Higher-time-frame directional context
- Weekly price-delivery expectations
- Lower-time-frame execution
The higher-time-frame analysis determines whether the trader should generally look for buys or sells.
The weekly model helps anticipate when the weekly high or low may form.
The lower-time-frame chart helps refine the entry and reduce risk.
This creates a complete trading narrative rather than an isolated entry pattern.
Concepts Required for the Model
The One Shot One Kill Model brings together several ICT concepts.
A trader should understand:
- Quarterly shifts
- IPDA 20, 40 and 60-day Data Ranges
- Premium and discount PD Arrays
- Position-trading concepts
- Swing-trading concepts
- Weekly Power of Three
- Weekly range profiles
- Market Maker Buy and Sell Models
- Day-of-week tendencies
- ICT Kill Zones
- Fibonacci projections
- Seasonal tendencies
- Commitment of Traders analysis
- Commercial hedging
- Intermarket analysis
A trader does not need every condition to appear on every setup.
However, the strongest opportunities usually contain several forms of confirmation pointing in the same direction.
Start With the Quarterly Shift
The first step is to determine the current or potential next quarterly shift.
A quarterly shift helps establish the broader institutional narrative.
The trader studies whether the market is likely to:
- Continue an existing long-term trend
- Reverse from an important premium or discount area
- Reprice toward a new higher-time-frame objective
- Begin a new three-month directional phase
The One Shot One Kill setup should ideally align with this larger market expectation.
A short-term trade taken against the quarterly narrative may have less probability and a smaller potential range.
Use IPDA Data Ranges
The next step is to examine the previous:
- 20 trading days
- 40 trading days
- 60 trading days
These IPDA Data Ranges provide a time-based framework for identifying important historical highs, lows and PD Arrays.
The trader should begin with the most recent 20-day range.
If the necessary price objective is not available within that range, the analysis can extend into the 40-day or 60-day lookback period.
The purpose is to determine where price may seek liquidity next.
Identify Higher-Time-Frame PD Arrays
After marking the IPDA ranges, identify the important monthly, weekly and daily PD Arrays.
For a bearish setup, the trader looks for premium PD Arrays such as:
- Bearish order blocks
- Bearish fair value gaps
- Bearish breakers
- Mitigation blocks
- Rejection blocks
- Liquidity voids
- Old highs
- Buy-side liquidity
For a bullish setup, the trader looks for discount PD Arrays such as:
- Bullish order blocks
- Bullish fair value gaps
- Bullish breakers
- Mitigation blocks
- Rejection blocks
- Liquidity voids
- Old lows
- Sell-side liquidity
The higher-time-frame PD Array provides the location from which the weekly move may begin.
Study Interest-Rate Differentials
Interest-rate markets can help confirm whether a currency pair is likely to trend or consolidate.
The trader may study:
- Government bond yields
- Treasury markets
- Interest-rate differentials
- German Bunds for euro-related analysis
- Relative strength between different countries’ rates
When the relevant interest-rate markets are trending, the currency pair may have greater permission to expand.
When rates are tightly consolidated, the currency pair may also struggle to create a meaningful range.
Interest rates should support the technical narrative rather than be used as an isolated signal.
Use Seasonal Tendencies
Markets often demonstrate recurring seasonal behavior.
A seasonal tendency shows whether a market has historically been more likely to rise or fall during a particular part of the year.
For a stronger setup, both the long-term and short-term seasonal models should point in the same direction.
For example, if both seasonal curves suggest that EURUSD generally declines during the second half of March, the trader may begin looking for bearish technical conditions.
Seasonality does not guarantee a move.
It becomes useful when it agrees with:
- Higher-time-frame PD Arrays
- Institutional order flow
- Commercial positioning
- Weekly price structure
- Intermarket confirmation
Seasonality provides a probable directional influence, not a complete trade setup.
Apply Swing Analysis
The trader should classify the important price swings from the higher time frames down to the one-hour chart.
This includes identifying:
- Impulse swings
- Retracement swings
- Expansion swings
- Intermediate-term highs and lows
- Short-term highs and lows
- Dealing ranges
- Premium and discount zones
These swings can be used for:
- Fibonacci projections
- Retracement measurements
- Liquidity targets
- Entry refinement
- Weekly range projections
The trader should not apply Fibonacci tools randomly.
The correct swing must fit the larger market narrative.
Anticipate the Weekly Profile
Once a directional bias is established, the trader identifies the weekly profile most likely to develop.
For a bearish week, possible profiles include:
- Monday high of the week
- Tuesday high of the week
- Wednesday high or weekly reversal
- Consolidation followed by a bearish decline
For a bullish week, possible profiles include:
- Monday low of the week
- Tuesday low of the week
- Wednesday low or weekly reversal
- Consolidation followed by a bullish rally
In many weeks, the high or low forms between Monday and Wednesday.
This helps the trader narrow the time window during which the One Shot One Kill entry may appear.
Apply Weekly Power of Three
The weekly candle can be interpreted using the Power of Three:
- Accumulation
- Manipulation
- Distribution
In a bearish weekly model, price may accumulate near the weekly opening price, manipulate higher and then distribute lower.
In a bullish weekly model, price may accumulate near the open, manipulate lower and then distribute higher.
The manipulation may create the weekly Judas Swing.
This false move encourages traders to enter in the wrong direction before the real weekly expansion begins.
Look for the Market Maker Manipulation
Once the expected weekly profile is selected, the trader looks for a matching Market Maker Buy or Sell Model.
A bearish setup may involve:
- Initial consolidation
- Price moving higher into premium
- Buy-side liquidity being taken
- A bearish reversal
- Distribution toward discount
A bullish setup may involve:
- Initial consolidation
- Price moving lower into discount
- Sell-side liquidity being taken
- A bullish reversal
- Expansion toward premium
The manipulation should occur at a logical time and price.
It should not be identified only because price briefly moved in the opposite direction.
Determine Premium and Discount
The trader should clearly define the dealing range.
The range may be created from:
- A projected weekly high and low
- A major swing high and swing low
- An important expansion leg
- A higher-time-frame impulse range
The midpoint of the range is equilibrium.
Price above equilibrium is premium.
Price below equilibrium is discount.
For a bearish One Shot One Kill setup, the trader wants to sell in premium and target discount.
For a bullish setup, the trader wants to buy in discount and target premium.
Wait for Volatility Expansion
The best One Shot One Kill setups often appear when the market is transitioning from low volatility to high volatility.
Markets tend to move through cycles.
A small or compressed range is often followed by expansion.
A large range is often followed by consolidation or reduced volatility.
The trader should therefore prefer entries when:
- Price has been consolidating
- The expected weekly manipulation has occurred
- A higher-time-frame objective is supporting expansion
- A major session or news event can introduce volatility
- The market has room to reach the opposing PD Array
The aim is to enter before the larger weekly range is created, not after most of the move has already occurred.
Commitment of Traders and Commercial Hedging
Commitment of Traders data can help identify whether commercial participants are supporting or opposing the current price move.
Commercial traders often hedge into market rallies or declines.
For example, price may make a higher high while commercial traders increase their net selling.
This can suggest that the rally is being met by institutional hedging.
For a bearish One Shot One Kill setup, useful confirmation may include:
- Price making a higher high
- Commercials selling more aggressively
- A bearish seasonal tendency
- Price reaching a higher-time-frame premium PD Array
For a bullish setup, the opposite conditions may apply.
COT data should not be used alone.
It is one component of the wider setup.
Frame a Low-Resistance Liquidity Run
A low-resistance liquidity run occurs when few meaningful obstacles exist between the entry and the target.
For a bearish trade, the trader seeks:
- A premium PD Array for the short entry
- Clear bearish displacement
- Limited support between entry and target
- A discount PD Array as the objective
For a bullish trade, the trader seeks:
- A discount PD Array for the long entry
- Clear bullish displacement
- Limited resistance between entry and target
- A premium PD Array as the objective
The cleaner the path between the entry and target, the more efficient the setup may be.
Pair Opposing PD Arrays
The One Shot One Kill Model is often framed by pairing one PD Array with an opposing PD Array.
In a bearish setup:
- Entry comes from a premium PD Array
- Target is a discount PD Array
In a bullish setup:
- Entry comes from a discount PD Array
- Target is a premium PD Array
For example, price may trade into a weekly bearish order block.
After the reversal, the target may be a four-hour liquidity void below price.
The entry and target do not need to come from the same time frame.
A higher-time-frame entry area can deliver price toward a lower-time-frame objective.
Use Fibonacci With PD Arrays
Fibonacci levels should converge with logical PD Arrays.
They should not be used as independent support or resistance.
The trader may use Fibonacci tools to project:
- The weekly high
- The weekly low
- Expansion objectives
- Retracement entries
- Measured price swings
A Fibonacci level becomes more meaningful when it overlaps with:
- A fair value gap
- An order block
- A liquidity void
- An old high or low
- A premium or discount array
This convergence provides stronger time-and-price confirmation.
Use Intermarket Analysis
Intermarket analysis helps determine whether related markets support the setup.
For EURUSD, a trader may study:
- The US Dollar Index
- EURGBP
- Interest-rate markets
- Related currency pairs
- Government bond yields
A bearish EURUSD setup may become stronger when:
- The Dollar Index is reacting from discount
- The Dollar Index has premium PD Arrays above it
- EURGBP is weak
- Commercials are selling euro futures
- EURUSD is trading into a weekly premium PD Array
Multiple related markets do not need to move identically.
Their behavior should support the general directional narrative.
Day-of-Week Timing
The expected high or low of the week often forms between Monday and Wednesday.
For a bearish setup, the trader should watch for the high on:
- Monday
- Tuesday
- Wednesday
For a bullish setup, the trader should watch for the low during the same period.
Monday is studied first.
If Monday does not form the weekly extreme, Tuesday may produce it.
If Tuesday also fails, Wednesday may create the final manipulation and reversal.
The trader should not assume the first reversal is automatically the weekly high or low.
Price may still take Monday’s level on Tuesday before beginning the true expansion.
Use ICT Kill Zones for Entry
The lower-time-frame entry should normally form during an active ICT Kill Zone.
Important periods include:
- London session
- New York session
- London Close
- Other specific intraday windows taught within the ICT framework
A bearish setup may form when price trades into premium during London or New York and then creates bearish displacement.
A bullish setup may form when price trades into discount during an active session and then reverses higher.
Time of day helps refine the entry.
A valid PD Array reached outside an important session may not offer the same quality of execution.
Example of a Bearish One Shot One Kill Setup
Suppose the analysis suggests EURUSD should trade lower.
The broader evidence may include:
- Bearish seasonal tendency
- Commercial traders selling into a rally
- Dollar Index trading from a weekly discount PD Array
- EURGBP showing euro weakness
- EURUSD reaching a weekly bearish order block
- Monday expected to form the weekly high
Price opens the week and rallies on Monday.
The rally trades into the weekly bearish order block.
An intraday expansion projects a possible high near a specific price level.
Price reaches that level during an active session and then rejects it.
The trader identifies a liquidity void below price as the weekly objective.
The complete narrative is:
- Higher-time-frame context is bearish
- Monday creates the manipulation
- Price trades into premium
- Buy-side liquidity is taken
- Bearish order flow begins
- Price moves toward a discount liquidity void
Example of a Bullish One Shot One Kill Setup
A bullish model follows the opposite structure.
The evidence may include:
- Bullish seasonal tendency
- Commercial traders buying into a decline
- Dollar Index showing weakness
- The traded pair reaching a weekly discount PD Array
- Monday or Tuesday expected to form the low of the week
Price declines into a daily or weekly bullish order block.
Sell-side liquidity is taken.
Bullish displacement appears during London or New York.
The trader uses a premium PD Array above price as the weekly target.
Position Sizing and Early Entries
A trader may believe Monday is forming the high or low of the week but should still allow for the possibility that Tuesday or Wednesday may create a more extreme level.
One approach is to use reduced risk on the initial entry.
If Monday appears to form a bearish weekly high, the trader may take only a small position.
If Tuesday fails to trade higher and confirms bearish order flow, the trader may then have greater confidence in the original idea.
This reduces the risk of holding a full position while price creates a higher high or lower low later in the week.
Do Not Become Attached to the Bias
The trader should create a weekly opinion and follow it while the supporting evidence remains valid.
However, the bias should not be defended when price clearly invalidates the narrative.
Intraweek reversals can occur.
A setup expected to continue lower may reach a higher-time-frame discount PD Array and reverse higher.
A setup expected to continue higher may reach a premium PD Array and reverse lower.
The trader should remain committed to the process, not emotionally committed to the prediction.
Top-Down Reduction
The One Shot One Kill Model begins from the highest relevant perspective and gradually moves lower.
The process can be understood as:
- Position-trading context
- Swing-trading structure
- Short-term weekly profile
- Day-trading entry
- Optional scalping precision
The position-trading perspective defines the broad direction.
The swing model identifies the important price leg.
The short-term model frames the weekly range.
The day-trading model provides the precise entry.
Scalping concepts can reduce the stop further, but they are not necessary for the model to work.
One Shot One Kill Procedure
A practical procedure is:
- Determine the current or next quarterly shift.
- Mark the 20, 40 and 60-day IPDA ranges.
- Identify monthly, weekly and daily PD Arrays.
- Evaluate interest-rate direction.
- Study seasonal tendencies.
- Classify the important higher-time-frame swings.
- Select the probable weekly profile.
- Identify the expected Monday, Tuesday or Wednesday high or low.
- Look for the relevant Market Maker manipulation.
- Define the dealing range and equilibrium.
- Wait for price to enter premium or discount.
- Check COT and commercial hedging.
- Confirm the idea through intermarket analysis.
- Pair the entry PD Array with an opposing target.
- Use Fibonacci only when it converges with a logical PD Array.
- Refine the entry during an ICT Kill Zone.
- Define the invalidation point before entering.
- Manage the trade toward the planned weekly objective.
One Shot One Kill Checklist
Before taking the setup, ask:
- What is the quarterly directional expectation?
- Which IPDA Data Range is currently relevant?
- Which higher-time-frame PD Array is price approaching?
- Is the market in premium or discount?
- What does seasonal analysis suggest?
- Are interest-rate markets trending?
- Does COT or commercial hedging support the idea?
- Which weekly profile is likely to form?
- Is Monday, Tuesday or Wednesday expected to form the weekly extreme?
- Has the weekly manipulation occurred?
- Is the setup aligned with the Market Maker model?
- Is there a clear opposing PD Array for the target?
- Does intermarket analysis confirm the direction?
- Is the entry forming during an ICT Kill Zone?
- Is the path toward the target relatively clear?
- Where does the setup become invalid?
Common Mistakes
One common mistake is looking for a precise entry before establishing the higher-time-frame direction.
Another mistake is using seasonal tendencies as guaranteed predictions.
Traders may also misuse COT data without understanding how commercial hedging relates to price.
Another error is forcing Monday to be the weekly high or low when Tuesday or Wednesday may create a more extreme price.
Some traders enter after the market has already completed most of the weekly range.
The One Shot One Kill entry should ideally occur before the main expansion, not near its end.
Finally, traders may try to combine every ICT concept on one chart. The purpose is not to create unnecessary complexity. The purpose is to select the concepts that directly support the current setup.
Final Thoughts
The One Shot One Kill Model is not a single entry pattern. It is a complete process for blending macro conditions, time, price, liquidity and execution.
The model begins with the quarterly and higher-time-frame narrative.
IPDA Data Ranges and PD Arrays identify the important institutional reference points.
Seasonality, interest rates, commercial positioning and intermarket analysis help confirm the directional idea.
Weekly profiles and the Power of Three help anticipate when the manipulation and expansion may occur.
Finally, the lower-time-frame chart provides a precise entry from premium or discount toward an opposing PD Array.
The objective is not perfection on every trade. It is to develop a repeatable process for finding one carefully selected, high-probability weekly opportunity with controlled risk and meaningful reward.