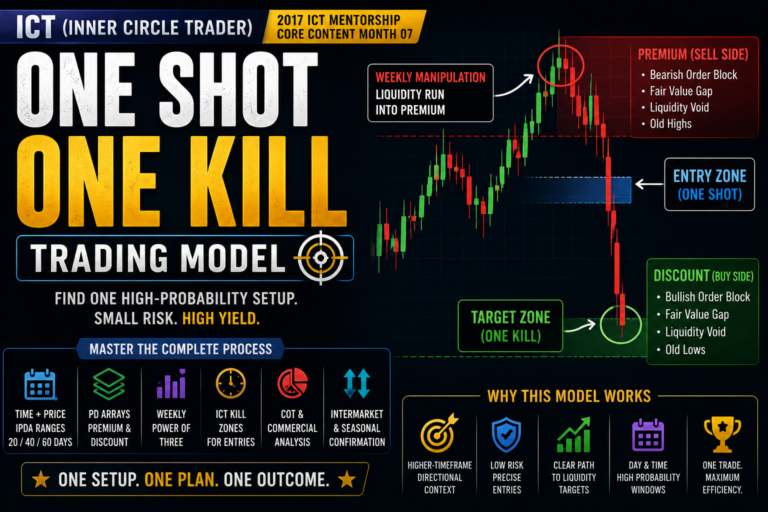
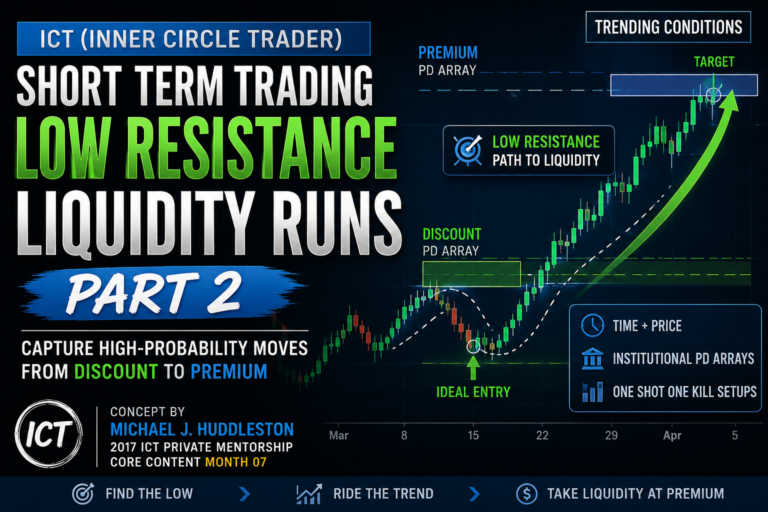
Short Term Trading Blending IPDA Data Ranges & PD Arrays is an ICT framework that combines time-based market analysis with price-based liquidity reference points. The concept was taught by Michael J. Huddleston, founder of ICT or Inner Circle Trader, in the 2017 ICT Private Mentorship Core Content Month 07.
The basic principle is simple:
- IPDA Data Ranges represent time
- PD Arrays represent price
- Combining them helps traders estimate where price may seek liquidity next
Michael J. Huddleston explains this relationship clearly:
“When we refer to time and price, what we’re doing is we’re blending both the components just like the algorithm does.”
This framework helps traders study how the Interbank Price Delivery Algorithm may reference the previous 20, 40 and 60 trading days when delivering price toward premium or discount objectives.
What Are IPDA Data Ranges?
IPDA stands for Interbank Price Delivery Algorithm.
The IPDA Data Range framework divides historical price action into three main lookback periods:
- Last 20 trading days
- Last 40 trading days
- Last 60 trading days
These ranges represent approximately:
- 20 trading days as one trading month
- 40 trading days as two trading months
- 60 trading days as three trading months
Each new trading day shifts these ranges forward.
The trader removes the oldest day and includes the newest day. This creates a continuously updating view of recent market structure, liquidity and price objectives.
Why Traders Use 20, 40 and 60-Day Ranges
The 20, 40 and 60-day lookback periods provide a time-based framework for understanding where important price levels may exist.
The 20-day range usually represents the nearest and most recent market data.
The 40-day range provides a broader view when the 20-day range does not contain a suitable liquidity objective.
The 60-day range provides an even wider reference when price has already violated or exhausted the important levels inside the 20 and 40-day ranges.
Price may therefore reach into older data when no meaningful liquidity target remains inside the nearest lookback period.
What Are PD Arrays?
PD Arrays are price reference points used to identify areas where price may react, reverse, rebalance or seek liquidity.
PD means Premium and Discount.
Premium PD Arrays are located above the current market price or within the premium portion of a dealing range.
Discount PD Arrays are located below the current market price or within the discount portion of a dealing range.
The trader uses these arrays to identify possible trade-entry zones and price targets.
Premium PD Arrays
When price is trading toward premium, traders look for bearish PD Arrays.
The main premium PD Arrays include:
- Bearish mitigation block
- Bearish breaker
- Liquidity void
- Fair value gap
- Bearish order block
- Rejection block
- Old high
- Old low
These areas may act as resistance, sell zones or locations where buy-side liquidity is taken before price moves lower.
In a bearish market, premium PD Arrays are generally used to frame short setups.
Discount PD Arrays
When price is trading toward discount, traders look for bullish PD Arrays.
The main discount PD Arrays include:
- Bullish mitigation block
- Bullish breaker
- Liquidity void
- Fair value gap
- Bullish order block
- Rejection block
- Old low
- Old high
These areas may act as support, buy zones or locations where sell-side liquidity is taken before price moves higher.
In a bullish market, discount PD Arrays are generally used to frame long setups.
Time and Price Working Together
IPDA Data Ranges tell the trader how far back in time to look.
PD Arrays tell the trader which price levels inside that period may matter.
This creates a structured process.
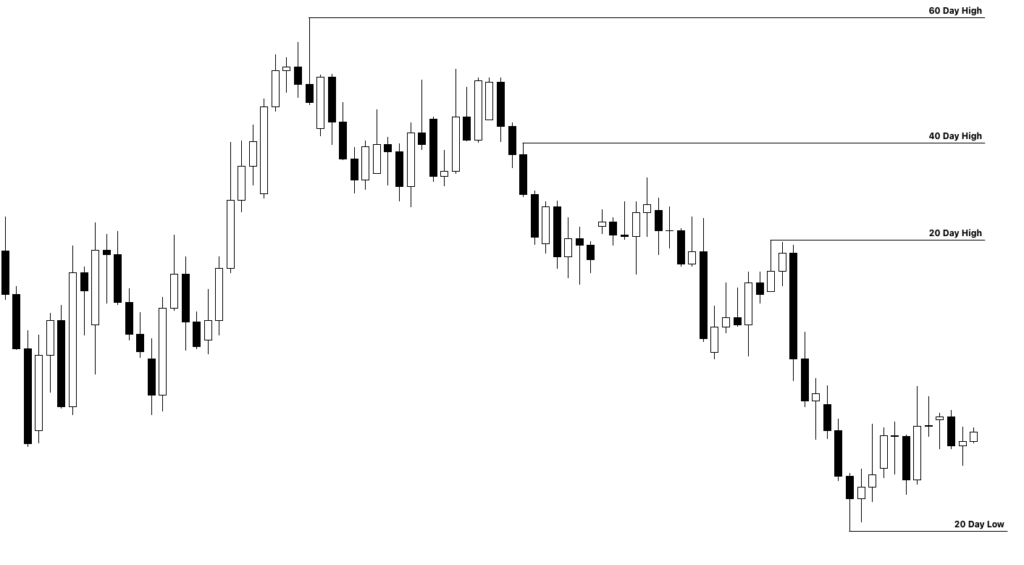
The trader first marks the last 20, 40 and 60 trading days.
Next, the trader identifies the highs and lows inside each range.
Then, the trader searches for valid premium and discount PD Arrays within those lookback periods.
This helps answer two important questions:
- Which liquidity objective is closest to price?
- Which PD Array is most likely to attract price next?
The combination of time and price provides more context than using either element alone.
How to Mark IPDA Data Ranges
Start with the daily chart.
Count back 20 trading days from the current day.
Mark the highest high and lowest low formed inside that period.
Repeat the same process for the last 40 trading days.
Then repeat it for the last 60 trading days.
These highs and lows define the outer limits of each data range.
The trader can then divide the range into premium and discount using its midpoint or equilibrium.
Price above equilibrium is considered premium.
Price below equilibrium is considered discount.
Start With the 20-Day Range
The 20-day range should normally be the first area of analysis.
Look above the current market price and identify which premium PD Arrays exist.
Look below the current market price and identify which discount PD Arrays exist.
Not every PD Array will always be present.
A chart may contain only two or three useful arrays.
The trader should not force an order block, fair value gap or breaker onto the chart when it is not clearly present.
As Huddleston explains:
“They’re either in the chart or they’re not.”
The absence of a specific PD Array does not invalidate the analysis. It simply reduces the number of available setups or targets.
Moving From the 20-Day to the 40-Day Range
Sometimes price reaches or violates the most important high or low inside the 20-day range.
If no meaningful PD Array remains beyond that level, the trader should extend the analysis into the 40-day range.
The objective is not to use the 40-day range automatically.
It becomes relevant when the 20-day data no longer contains the next logical liquidity target.
For example, if price trades below the lowest low of the last 20 trading days, look inside the 40-day range for:
- An older low
- A bullish order block
- A discount fair value gap
- A rejection block
- A liquidity void
- Another discount PD Array
If no lower reference exists inside the 40-day period, the trader may need to examine the 60-day range.
Moving From the 40-Day to the 60-Day Range
The 60-day range is the broader IPDA reference.
It becomes useful when price has already traded through the important levels inside both the 20 and 40-day ranges.
The trader then identifies the next premium or discount PD Array within the 60-day lookback.
This creates a hierarchy of potential objectives:
- Search the 20-day range first
- Extend into the 40-day range when necessary
- Use the 60-day range when the nearer ranges provide no suitable target
The nearest valid and unexhausted PD Array generally deserves the most attention.
Used and Exhausted PD Arrays
A PD Array may lose importance after price has already traded into it and reacted.
For example, price may trade into a bullish order block, reject it and expand higher.
That bullish order block has already delivered a reaction.
It may now be considered used or partially exhausted.
If price returns lower again, the trader should determine whether another discount PD Array exists beneath it.
This is why traders must continuously update their charts rather than treating every historical PD Array as equally valid.
PD Array Hierarchy
PD Arrays are not randomly selected.
They are studied in a specific order based on their position relative to market price.
When searching above price in premium, begin with the closest relevant bearish PD Array and work upward.
When searching below price in discount, begin with the closest relevant bullish PD Array and work downward.
The next liquidity objective may be:
- A mitigation block
- A breaker
- A liquidity void
- A fair value gap
- An order block
- A rejection block
- An old high or low
However, all of these do not need to exist on the same chart.
Price may move directly toward an order block because no valid fair value gap or mitigation block exists before it.
Using IPDA Ranges in a Bearish Market
In a bearish market, price is expected to move from premium toward discount.
The trader identifies premium PD Arrays above or around the current market price.
These premium arrays may provide:
- Resistance
- Short-entry locations
- Liquidity raids
- Bearish reversal zones
- Repricing opportunities
The trader then identifies discount PD Arrays below price.
These discount arrays become potential bearish objectives or profit targets.
The general model is:
- Price trades into premium
- Buy-side liquidity is taken
- Bearish order flow appears
- Price moves toward a discount PD Array
Using IPDA Ranges in a Bullish Market
In a bullish market, price is expected to move from discount toward premium.
The trader identifies discount PD Arrays below or around current market price.
These discount arrays may provide:
- Support
- Long-entry locations
- Sell-side liquidity raids
- Bullish reversal zones
- Repricing opportunities
The trader then identifies premium PD Arrays above price.
These premium arrays become potential bullish objectives or profit targets.
The general model is:
- Price trades into discount
- Sell-side liquidity is taken
- Bullish order flow appears
- Price moves toward a premium PD Array
Using Higher and Lower Time Frames
The daily chart provides the main IPDA range and higher-time-frame PD Arrays.
The four-hour and one-hour charts provide more detail.
A trader may identify a premium PD Array on the daily chart and use it to establish bearish context.
After price reacts from that daily premium area, the trader can move to the four-hour or one-hour chart.
The lower time frame can then be used to identify:
- Market structure shifts
- Liquidity runs
- Fair value gaps
- Breakers
- Mitigation blocks
- Lower-time-frame targets
The higher time frame provides the setup context.
The lower time frame provides execution and trade management.
Matching the Entry Time Frame With the Target Time Frame
When a liquidity pool is taken on a higher time frame, the trader can use a lower time frame to find the next opposing PD Array.
For example, price may raid a daily high inside a premium area.
After bearish displacement appears, the trader may move to the four-hour or one-hour chart.
The lower-time-frame discount PD Array can then become the target.
This creates a structured relationship:
- Higher-time-frame liquidity raid
- Shift in order flow
- Lower-time-frame PD Array target
The target does not always need to be another daily level.
A daily premium liquidity raid may deliver price into a four-hour liquidity void or fair value gap.
Failure in Analysis Can Provide Information
A major advantage of this framework is that a failed expectation can help reveal a change in market direction.
A trader may initially expect bullish continuation toward a premium target.
However, price may fail to continue higher, reject a liquidity pool and break lower.
That failure can indicate a shift from bullish to bearish order flow.
Instead of holding onto the original bias, the trader reassesses the available PD Arrays.
The trader may then begin looking for:
- Premium short-entry zones
- Bearish displacement
- Lower-time-frame mitigation blocks
- Discount liquidity objectives
Being wrong about the original direction does not make the framework useless.
The failure itself may become evidence supporting the opposite scenario.
Combining Weekly Profiles With IPDA Data Ranges
IPDA Data Ranges work well with weekly range profiles.
A trader may anticipate that Tuesday will form the high of the week.
The trader then checks whether Tuesday is reaching:
- A 20-day premium PD Array
- An old daily or weekly high
- A bearish order block
- A fair value gap
- A rejection block
- Buy-side liquidity
If Tuesday raids Monday’s high and rejects a premium array, it may support a bearish weekly profile.
The trader can then use a lower-time-frame discount PD Array as the downside objective.
This blends:
- Weekly profile
- Time-based IPDA range
- Premium or discount PD Array
- Liquidity raid
- Lower-time-frame target
Practical Example of Bearish Price Delivery
Suppose price is trading inside the premium portion of a 20-day range.
A previous daily high is resting above Monday’s price action.
On Tuesday, price trades slightly above Monday’s high and takes buy-side liquidity.
Price then fails to continue higher and produces bearish displacement.
This suggests that the daily liquidity pool has been raided.
The trader moves to the four-hour chart and identifies a liquidity void below price.
That four-hour liquidity void becomes the discount objective.
The complete narrative is:
- Price trades in premium
- Tuesday takes the daily high
- Bullish continuation fails
- Bearish order flow begins
- Price moves toward the lower-time-frame liquidity void
This is how time, price, liquidity and weekly structure work together.
How to Apply the Concept Step by Step
Begin with the daily chart.
Mark the last 20, 40 and 60 trading days.
Identify the highest high and lowest low inside each range.
Divide the relevant range into premium and discount.
Mark all valid PD Arrays above and below current market price.
Remove or reduce the importance of PD Arrays that have already been fully used.
Determine whether the market is expected to move from premium to discount or from discount to premium.
Study the current weekly profile.
Look for liquidity runs around Monday, Tuesday or Wednesday highs and lows.
Use the four-hour or one-hour chart to confirm the shift in order flow.
Select the next opposing PD Array as the target.
Short-Term Trading Checklist
Before taking a trade, confirm:
- What is the higher-time-frame directional bias?
- Where is price inside the 20-day range?
- Is price currently in premium or discount?
- Which PD Arrays exist above current price?
- Which PD Arrays exist below current price?
- Has the nearest PD Array already been used?
- Does the 20-day range contain a valid target?
- Is it necessary to examine the 40 or 60-day range?
- Has buy-side or sell-side liquidity been taken?
- Has order flow shifted?
- Does the weekly profile support the setup?
- Is there a lower-time-frame PD Array available as a target?
Common Mistakes
One common mistake is marking every possible PD Array without considering whether it is valid or already exhausted.
Another mistake is using the 60-day range immediately without first studying the more recent 20-day data.
Traders may also confuse a liquidity target with an entry signal.
A PD Array may attract price, but the trader still needs confirmation before entering.
Another mistake is remaining committed to the original bias after price clearly fails to behave as expected.
The framework should help the trader adapt when order flow changes.
Finally, traders often focus only on price while ignoring time. IPDA analysis becomes more effective when the 20, 40 and 60-day lookback periods are combined with premium and discount arrays.
Final Thoughts
Short Term Trading Blending IPDA Data Ranges & PD Arrays provides a structured method for combining time and price.
The IPDA lookback periods show where the algorithm may reference historical market data.
The PD Array Matrix identifies the specific price levels within those periods that may act as liquidity objectives, entry zones or reversal areas.
The trader begins with the 20-day range and extends into the 40 or 60-day range only when necessary.
Premium PD Arrays help frame bearish setups and resistance.
Discount PD Arrays help frame bullish setups and support.
When this analysis is combined with liquidity raids, weekly profiles and lower-time-frame confirmation, traders can build a clearer short-term trading narrative based on both time and price.