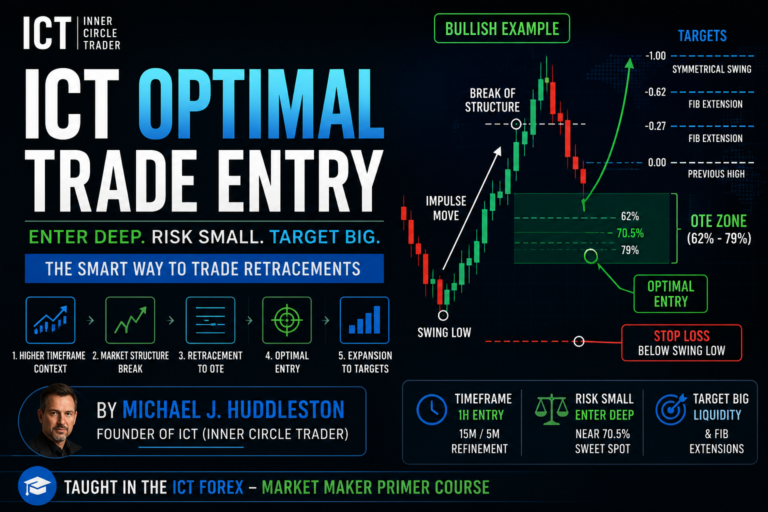
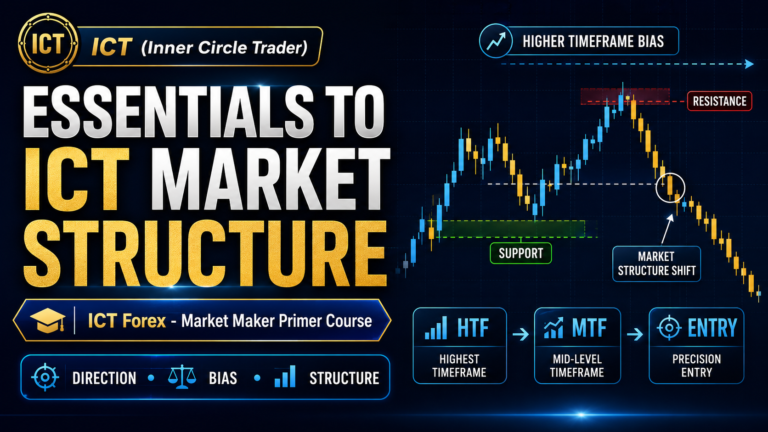
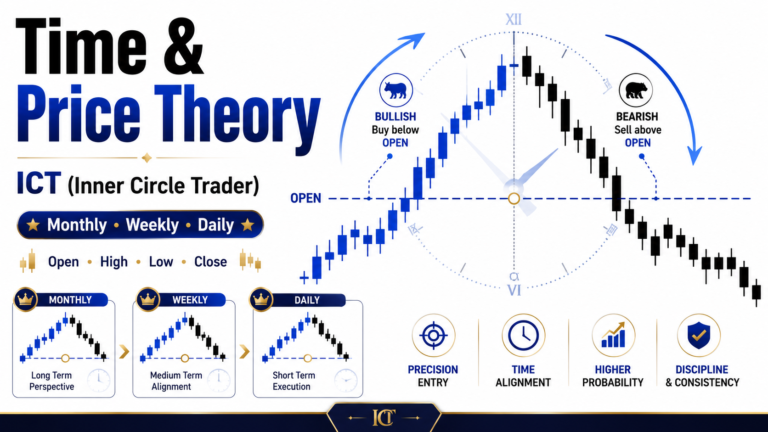
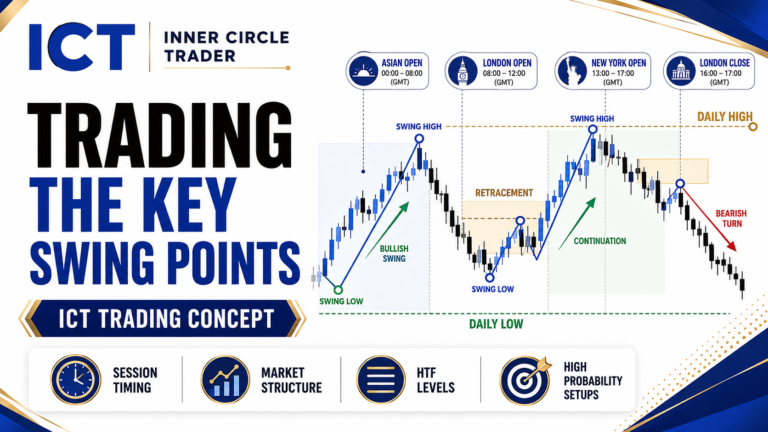
Higher Time Frame Concepts are used to identify major price levels, liquidity objectives, and probable areas of market rejection without depending heavily on intraday charts. Michael J. Huddleston, the founder of ICT (Inner Circle Trader) concepts, teaches this approach in the ICT Forex – Market Maker Primer Course, particularly for traders who cannot spend the entire trading day monitoring short-term price action.
The main idea is simple: price behaves fractally. The same liquidity sweeps, rejections, and institutional price-delivery concepts seen on lower time frames can also appear on daily and other higher-timeframe charts.
As Michael J. Huddleston explains:
“Those same price action concepts still apply because price is fractal.”
For traders using a higher-timeframe approach, the goal is to focus on obvious levels, determine where price recently collected liquidity, and identify where the next significant liquidity pool may be located.
What Are Higher Time Frame Concepts?
In ICT trading, Higher Time Frame Concepts focus on major reference levels that can influence long-term or intermediate-term price movement.
The primary levels include:
- Yearly highs and lows
- Quarterly highs and lows
- Monthly highs and lows
- Previous weekly highs and lows
- Old highs and old lows
- Relative equal highs
- Relative equal lows
These levels are important because they can represent areas where significant amounts of liquidity are resting.
Price may trade toward these levels, run through them, and then reject in the opposite direction.
The trader’s job is not to predict every candle.
The objective is to determine:
Where is price currently trading?
Where did price recently come from?
Where is the next obvious liquidity pool?
Understanding Yearly Highs and Lows
ICT uses a rolling 12-month period when studying yearly highs and lows.
This is not necessarily based on January through December.
Instead, begin from the current date and look back approximately 12 months.
Identify:
Highest high during the previous 12 months
Lowest low during the previous 12 months
These levels provide long-term reference points for higher-timeframe analysis.
A yearly high may represent a significant area of buy-side liquidity.
A yearly low may represent a significant area of sell-side liquidity.
Price approaching these areas can create opportunities to study a potential liquidity run or rejection.
Quarterly, Monthly, and Weekly Highs and Lows
After identifying the yearly range, traders can study progressively smaller higher-timeframe ranges.
Quarterly highs and lows help define significant price extremes that developed during broader three-month periods.
Monthly highs and lows provide more immediate reference points.
Previous weekly highs and lows can identify short-term higher-timeframe liquidity objectives.
The process can be viewed as:
Yearly range → Quarterly levels → Monthly levels → Weekly levels
The trader does not need to overcrowd the chart with every possible level.
Focus on levels that are relevant to the current location of price.
Michael J. Huddleston explains that these levels are useful because:
“They are specific. Previous week’s highs and lows, monthly highs and lows, quarterly highs and lows, yearly highs and lows.”
This creates an objective framework for studying price.
Start With the Current Market Condition
Before looking for a trade, identify the condition of the market.
Ask whether price is:
- Trending
- Consolidating
- Potentially reversing
- Trading near equilibrium
- Moving toward an obvious liquidity level
This step is extremely important.
A market that is trending provides a different opportunity than a market trapped in the middle of a large range.
For example, if price has been moving lower for several months and then begins consolidating after rejecting an old low, a potential reversal condition may be developing.
However, price could also remain inside the range.
You do not need to know the entire future direction of the market.
You only need to identify a probable price range.
For example:
Current price → Expected old low
That distance represents a potential opportunity.
Or:
Current price → Equal highs
That range may represent the next possible bullish price objective.
Focus on the Most Recent Liquidity Run
One of the most important Higher Time Frame Concepts is identifying the most recent run on liquidity.
Look at the daily chart and ask:
Did price recently trade above an old high?
Did price recently trade below an old low?
Were equal highs taken?
Were equal lows taken?
The most recent liquidity event can provide important context.
For example:
Price runs below an old low → Rejects lower prices → Trades back above the old low
This can indicate that sell-side liquidity has been collected.
The trader may then begin looking for liquidity above current price.
The opposite applies in bearish conditions.
Price runs above an old high → Rejects higher prices → Trades back below the old high
The market may then seek sell-side liquidity below previous lows.
Double Top Sweeps
A double top sweep occurs when price forms relatively equal highs and later trades above them.
Equal highs can indicate buy-side liquidity.
When price returns to the level, it may trade above the highs, collect liquidity, and then reject lower.
The basic model is:
Equal highs form → Price trades above equal highs → Buy-side liquidity is collected → Price rejects lower
ICT traders do not view the equal highs simply as resistance.
The important question is whether liquidity exists above those highs.
Michael J. Huddleston explains:
“We see price action creating very clean equal highs or relatively equal highs. We’re expecting that phenomenon to take place where price would drive above those equal highs, reject and trade lower.”
This is the concept of a double top sweep.
Double Bottom Sweeps
A double bottom sweep is the bearish-to-bullish equivalent of a double top sweep.
Price creates relatively equal lows.
Sell-side liquidity may be resting beneath those lows.
Price can trade below the equal lows, collect liquidity, and then reject higher.
The sequence is:
Equal lows form → Price trades below equal lows → Sell-side liquidity is collected → Price rejects higher
Higher-timeframe traders can study this behaviour on the daily chart.
The rejection may begin a move toward an old high or equal highs above the market.
Runs on Old Lows
Price does not require equal lows to create a meaningful liquidity level.
A single obvious old low can also become a higher-timeframe reference point.
When price trades below that old low, the trader waits to see whether price rejects the lower level.
A bullish rejection may look like:
Old low is traded through → Price returns above the old low → Bullish rejection develops
The important confirmation is that price trades back above the old low.
Michael J. Huddleston describes this concept clearly:
“What makes the rejection? It trades back above that old low.”
Once this happens, the trader can look for a liquidity objective above price.
This may be:
- An old high
- Relative equal highs
- A previous monthly high
- A previous weekly high
Runs on Old Highs
The opposite model applies to an old high.
Price trades above the previous high.
The move may appear to be a traditional breakout.
However, price then rejects and returns below the old high.
The sequence is:
Old high is traded through → Buy-side liquidity is collected → Price returns below the old high → Bearish rejection develops
The next potential objective may be an old low or equal lows below current price.
This is why ICT traders focus on liquidity rather than assuming every breakout will continue.
How to Identify Price Rejection
Price rejection is important in higher-timeframe trading.
Simply trading through a key level is not always enough.
The trader wants to see price move beyond the level and then return to the previous range.
For a bullish rejection:
Price trades below old low → Price returns above old low
For a bearish rejection:
Price trades above old high → Price returns below old high
The return through the level shows that price did not continue accepting prices beyond the liquidity pool.
This creates a potential directional idea.
Find the Opposite Side of the Marketplace
After a liquidity pool has been taken and price rejects, ICT traders begin looking toward the opposite side of the marketplace.
Suppose price runs equal lows.
Sell-side liquidity has been collected.
Price then rejects higher.
The trader asks:
Where is the next obvious buy-side liquidity?
This may be an old high.
It may be equal highs.
It may be a major monthly or quarterly high.
The basic process is:
Sell-side liquidity taken → Bullish rejection → Identify buy-side liquidity
Or:
Buy-side liquidity taken → Bearish rejection → Identify sell-side liquidity
Michael J. Huddleston explains the broader idea:
“The market goes right to them and then starts to look for the other side of the marketplace.”
This creates a logical framework for determining possible price objectives.
Avoid Trading in the Middle of a Higher-Timeframe Range
One of the most important lessons in Higher Time Frame Concepts is knowing when not to trade.
Suppose a range is defined by a major high and major low.
If price is trading near the middle of that range, directional clarity may be limited.
This is effectively an equilibrium condition.
Higher-timeframe traders should generally be cautious in these conditions.
For example:
Range high
↓
Middle of range or equilibrium
↓
Range low
Trading from the middle can create uncertainty because price has meaningful liquidity on both sides.
ICT traders prefer waiting for price to approach a major high or low.
Michael J. Huddleston explains:
“You don’t want to trade it in the middle of the range.”
Patience is especially important for traders using daily charts.
Not Every Forex Pair Offers a Clear Setup
Another important element of higher-timeframe analysis is pair selection.
Traders do not need to force analysis on every market.
Some pairs may show:
- Clear liquidity objectives
- Obvious equal highs
- Obvious equal lows
- Strong rejection
- Defined market structure
Other pairs may be:
- Consolidating
- Trading around equilibrium
- Showing unclear market structure
- Moving without an obvious liquidity objective
When the chart is unclear, the correct decision may be to remain on the sidelines.
For example, a pair trading directly in the middle of its higher-timeframe range may offer opportunities for day traders, but it may not provide a high-quality swing or position trading setup.
The trader should cycle through major markets and look for clarity.
Use the Dollar Index for Forex Analysis
For major Forex pairs, Michael J. Huddleston begins higher-timeframe analysis with the Dollar Index.
The Dollar Index can provide broader context regarding potential US dollar strength or weakness.
For example:
Bullish Dollar Index narrative → Potential USD strength
This may support:
- Higher USD/CAD
- Higher USD/JPY
- Lower EUR/USD
However, correlations and pair-specific conditions must still be considered.
The Dollar Index provides a broad directional framework.
The individual Forex pair must still display a valid liquidity narrative.
For example, bullish Dollar Index conditions combined with equal highs resting above USD/CAD may strengthen the idea of a potential upward liquidity run.
Price Is Fractal
Higher Time Frame Concepts work because the principles of price action are fractal.
A liquidity sweep visible on a 5-minute chart can also occur on the daily chart.
The difference is the duration of the move.
A lower-timeframe liquidity setup may complete in minutes or hours.
A daily setup may require weeks.
However, the underlying concepts remain similar:
Liquidity forms → Price trades toward liquidity → Liquidity is collected → Price rejects → Opposing liquidity becomes the objective
This makes higher-timeframe analysis particularly useful for traders with limited screen time.
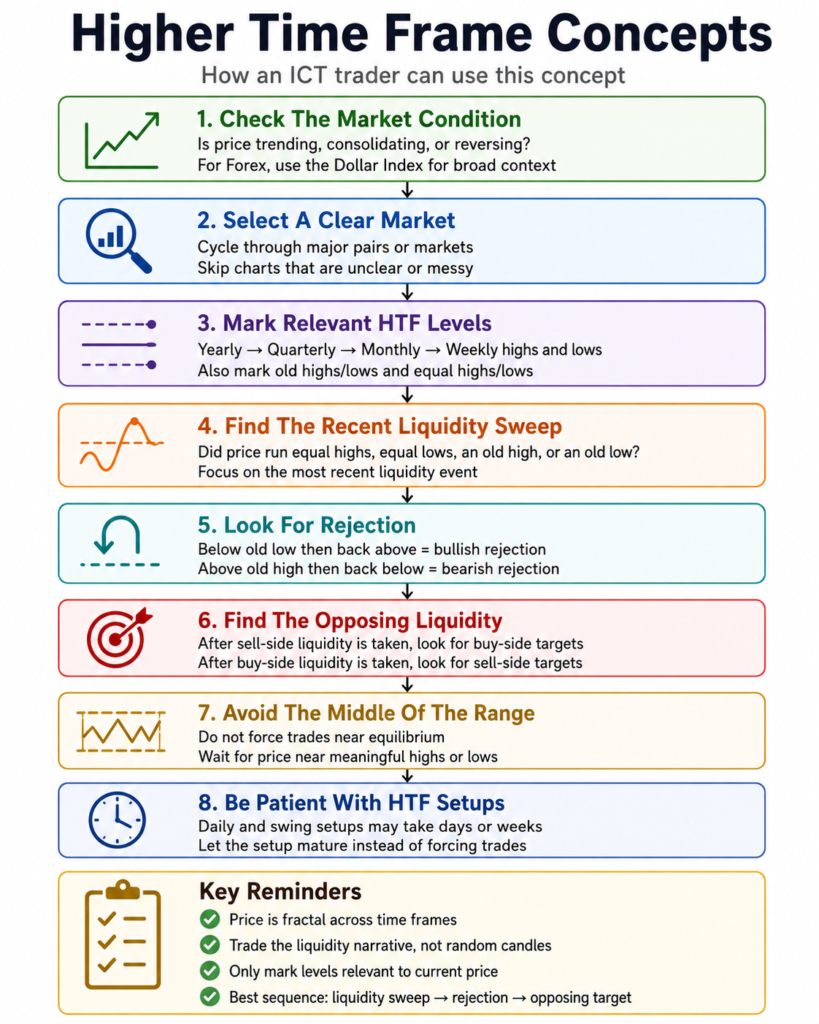
A Simple Higher Time Frame Trading Process
Traders can use the following process when analysing daily charts.
Step 1: Begin With the Dollar Index
For Forex analysis, determine whether the Dollar Index is:
- Trending
- Consolidating
- Potentially reversing
Study the most recent liquidity run.
Step 2: Cycle Through the Major Forex Pairs
Look for markets with clear price action.
Avoid forcing a bias on unclear charts.
Step 3: Mark Relevant Key Levels
Identify the nearest:
- Yearly high or low
- Quarterly high or low
- Monthly high or low
- Previous weekly high or low
- Old high or low
- Equal highs or lows
Only mark levels relevant to current price.
Step 4: Identify the Most Recent Liquidity Sweep
Ask whether price recently collected:
- Buy-side liquidity
- Sell-side liquidity
Step 5: Look for Rejection
Did price trade back through the key level?
For example:
Trade below old low → Return above old low
This may support a bullish idea.
Step 6: Find Opposing Liquidity
Identify the next obvious high or low that price may seek.
Step 7: Avoid the Middle of the Range
Wait when price is trapped near equilibrium and directional conditions are unclear.
Step 8: Allow Time for the Setup
Higher-timeframe setups may take many days or weeks to complete.
Do not force daily trading behaviour onto a daily-chart model.
Why Large Liquidity Pools Matter
ICT trading is based on the idea that significant liquidity is associated with large institutional market participants.
Retail traders often assume the market specifically targets individual retail stop losses.
Michael J. Huddleston argues that major liquidity pools are more important because large funds can transact enormous positions.
He explains:
“Large funds, they’re trading billions of dollars many times and that will have a large area of interest for buying and selling.”
This is why the market can gravitate toward obvious highs and lows.
Equal highs, equal lows, and old swing points can represent areas where significant orders are positioned.
The objective is to understand where meaningful liquidity is likely concentrated.
Common Mistakes With Higher Time Frame Concepts
A common mistake is marking too many levels.
The chart becomes overcrowded and the trader loses focus.
Only study levels relevant to current price.
Another mistake is trading in the middle of a range.
Higher-timeframe traders should generally wait for price to approach more meaningful liquidity areas.
Traders also make the mistake of forcing directional bias on unclear markets.
Not every currency pair will provide an obvious setup.
Finally, traders may become impatient.
Daily-chart setups can require several weeks to reach their objectives.
Higher-timeframe trading requires patience.
Final Thoughts
Higher Time Frame Concepts provide ICT traders with a simple framework for analysing price when lower-timeframe trading is not practical.
The process focuses on objective levels and liquidity.
Yearly levels → Quarterly levels → Monthly levels → Weekly levels → Old highs and lows → Equal highs and lows
Then study the most recent liquidity event.
Liquidity sweep → Price rejection → Opposing liquidity objective
As Michael J. Huddleston teaches, new traders can begin by focusing on obvious double tops, double bottoms, old highs, and old lows.
The purpose is not to analyse every price movement.
The objective is to identify high-probability higher-timeframe levels, wait for price to interact with those levels, and study how price moves from one major liquidity pool toward another.
For ICT traders with limited screen time, Higher Time Frame Concepts can provide a structured way to analyse daily price action while still applying the foundational principles of liquidity and institutional price delivery.