The ICT Implied FVG, also known as the Implied Fair Value Gap or IFVG, is an advanced price delivery concept taught within the ICT (Inner Circle Trader) methodology of Michael J. Huddleston. Unlike a normal ICT Fair Value Gap, an Implied FVG does not show a clear visible gap between the first and third candles.
The price chart may appear completely traded.
The candle wicks may overlap.
No traditional BISI or SIBI is clearly visible.
However, a large displacement candle can still show one-sided price delivery.
ICT uses the Consequent Encroachment or 50% level of the adjacent candle wicks to uncover this hidden inefficiency.
The price range between these wick midpoint levels becomes the ICT Implied FVG.
In simple words, the Implied Fair Value Gap is a hidden FVG inside price delivery.
What Is ICT Implied FVG?
An ICT Implied FVG is a hidden price imbalance formed around a large displacement candle when the wicks of the candle before and after the displacement overlap the middle candle.
In a regular Fair Value Gap, an obvious price range is visible between Candle 1 and Candle 3.
The candles do not completely overlap.
This creates a visible imbalance.
But an Implied Fair Value Gap is different.
The surrounding candle wicks overlap the displacement candle.
Therefore, no normal Fair Value Gap is visible.
The trader must study the wicks.
The midpoint or Consequent Encroachment of one wick is compared with the midpoint of the opposite wick.
The price range between these two CE levels becomes the Implied FVG zone.
The general formation contains three candles:
Candle 1 – Preceding candle
Candle 2 – Large displacement candle
Candle 3 – Following candle
The middle candle normally contains a large body and shows aggressive directional price delivery.
Why Is It Called an Implied Fair Value Gap?
The word implied is important.
A normal Fair Value Gap can be directly seen on the chart.
For example, in a bullish FVG, the high of the first candle remains below the low of the third candle.
A visible open range exists between them.
The gap is obvious.
In an ICT Implied FVG, this visual gap is absent.
The wicks of Candle 1 and Candle 3 may overlap the body of the large middle candle.
Therefore, the chart appears to show complete price overlap.
But ICT studies the individual wick ranges.
Each wick has a Consequent Encroachment level.
When the two wick midpoint levels leave a price range between them, a hidden inefficiency is implied.
Therefore:
Visible imbalance = Regular FVG
Hidden imbalance between wick CE levels = Implied FVG
The Fair Value Gap is not visually presented in the normal three-candle manner.
Its presence is implied by the structure of the surrounding candle wicks.
Why Does an ICT Implied FVG Form?
An ICT Implied FVG normally develops around strong displacement.
Price begins moving aggressively in one direction.
A large-bodied candle forms.
The body of this candle represents strong directional delivery.
However, the candle before the displacement may have a long wick extending into part of the middle candle’s range.
The candle after the displacement may also create an opposing wick.
These wicks visually cover the price range.
Therefore, a classic Fair Value Gap does not form.
But the complete wick does not necessarily represent equal price delivery through every part of its range.
ICT divides the wick and studies its 50% level or Consequent Encroachment.
The midpoint of the first wick and the midpoint of the third wick can expose a price range that is treated conceptually like a Fair Value Gap.
This becomes the Implied FVG.
Within the ICT model, it is studied as a hidden price delivery inefficiency that price may later reprice into. The commonly documented identification method uses a large displacement candle and the CE levels of the adjacent overlapping wicks.
Three-Candle Structure of ICT Implied FVG
The ICT Implied FVG uses a three-candle formation.
Candle 1 – Preceding Candle
This candle forms immediately before the large displacement candle.
Its wick is important.
For a bullish Implied FVG, the trader studies the upper wick of Candle 1.
For a bearish Implied FVG, the trader studies the lower wick of Candle 1.
The Consequent Encroachment of this wick must be calculated.
Candle 2 – Displacement Candle
The second candle is the main displacement candle.
It should have a comparatively large candle body.
For a bullish Implied FVG, Candle 2 is a strong bullish candle.
For a bearish Implied FVG, Candle 2 is a strong bearish candle.
The large body shows aggressive directional price delivery.
However, unlike a normal Fair Value Gap, the wicks of the first and third candles overlap portions of this middle candle.
Candle 3 – Following Candle
This candle forms immediately after the displacement candle.
Again, the wick is important.
For a bullish Implied FVG, study the lower wick of Candle 3.
For a bearish Implied FVG, study the upper wick of Candle 3.
The Consequent Encroachment of this wick is calculated.
The area between the two wick CE levels becomes the ICT Implied FVG.
What Is Consequent Encroachment in Implied FVG?
Consequent Encroachment or CE is the 50% midpoint of a price range.
In the ICT Implied FVG concept, the trader calculates the midpoint of specific candle wicks.
For an upper wick:
Upper Wick CE = Midpoint between the candle body top and wick high
For a lower wick:
Lower Wick CE = Midpoint between the candle body bottom and wick low
Suppose a candle’s upper wick extends from 100 to 110.
The Consequent Encroachment is:
(100 + 110) ÷ 2 = 105
The CE of the wick is 105.
The same process is applied to the relevant wick of the opposite candle.
These two CE levels frame the Implied Fair Value Gap.
This is one of the biggest differences between a regular FVG and ICT Implied FVG.
A regular Fair Value Gap uses the actual high and low boundaries of Candle 1 and Candle 3.
An Implied FVG uses the 50% midpoint of specific candle wicks.
Types of ICT Implied FVG
There are two directional types of ICT Implied FVG.
These are:
Bullish Implied Fair Value Gap
Bearish Implied Fair Value Gap
Both use the same basic three-candle concept.
The difference is the direction of displacement and the wicks used to calculate the hidden gap.
Bullish ICT Implied FVG
A Bullish ICT Implied FVG forms around strong bullish displacement.
Price moves aggressively higher.
A large bullish candle forms as Candle 2.
The surrounding candle wicks overlap the large bullish candle.
Therefore, a normal bullish Fair Value Gap may not be visible.
To identify the bullish Implied FVG:
Step 1: Find a large bullish displacement candle.
Step 2: Study the candle immediately before the displacement candle.
Step 3: Identify the upper wick of Candle 1.
Step 4: Calculate the Consequent Encroachment or 50% level of this upper wick.
Step 5: Study the candle immediately after the displacement candle.
Step 6: Identify the lower wick of Candle 3.
Step 7: Calculate the Consequent Encroachment of this lower wick.
Step 8: Mark the price range between the two CE levels.
This range is the Bullish ICT Implied FVG.
Bullish Implied FVG Structure
The structure can be remembered as:
Candle 1 Upper Wick CE
↓
Hidden Imbalance
↓
Candle 3 Lower Wick CE
The area between these levels becomes the bullish Implied Fair Value Gap.
Price may later retrace downward into this range.
In a bullish price delivery narrative, traders can study whether price respects the zone and continues higher.
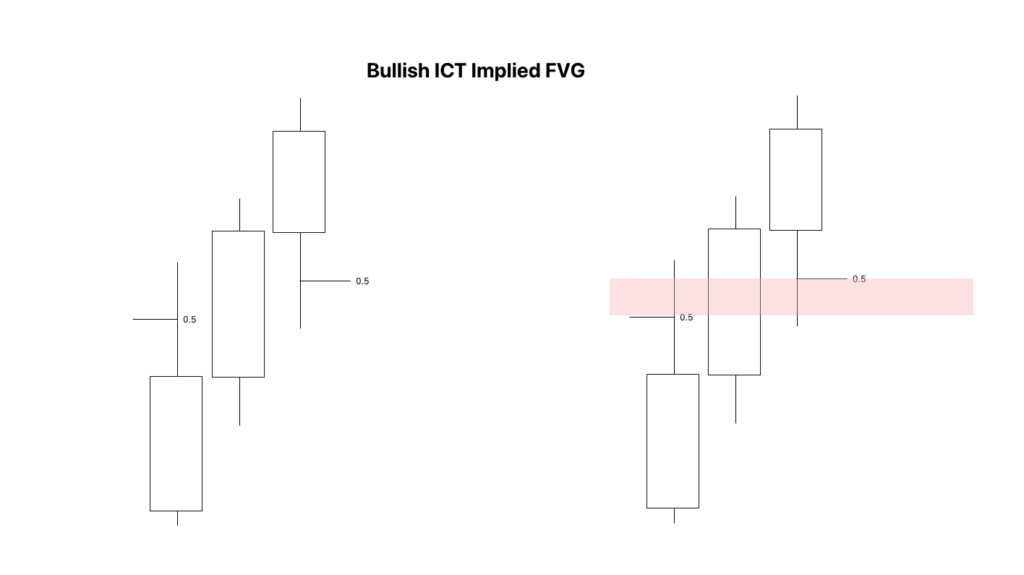
Example of a Bullish Implied FVG
Suppose price begins moving higher.
The first candle has an upper wick extending from 100 to 104.
The midpoint of the upper wick is:
(100 + 104) ÷ 2 = 102
Therefore:
Candle 1 Upper Wick CE = 102
A large bullish displacement candle then forms.
The third candle has a lower wick extending from 106 to 110.
The midpoint is:
(106 + 110) ÷ 2 = 108
Therefore:
Candle 3 Lower Wick CE = 108
The price range between 102 and 108 becomes the bullish ICT Implied FVG.
Bullish Implied FVG = 102 to 108
There may be no traditional FVG visible between the actual candle wicks.
But using Consequent Encroachment, a hidden gap is identified.
The trader can extend this range forward in time and monitor future price interaction.
Bearish ICT Implied FVG
A Bearish ICT Implied FVG forms around strong bearish displacement.
Price moves aggressively lower.
A large bearish candle forms as Candle 2.
The candle before and candle after the displacement have wicks overlapping the middle candle.
Therefore, no clear bearish SIBI may be visible.
To identify the bearish Implied FVG:
Step 1: Find a large bearish displacement candle.
Step 2: Study Candle 1 before the displacement.
Step 3: Identify its lower wick.
Step 4: Calculate the Consequent Encroachment or midpoint of the lower wick.
Step 5: Study Candle 3 after the displacement.
Step 6: Identify its upper wick.
Step 7: Calculate the Consequent Encroachment of the upper wick.
Step 8: Mark the price range between the two CE levels.
This range becomes the Bearish ICT Implied FVG.
Bearish Implied FVG Structure
The structure can be remembered as:
Candle 1 Lower Wick CE
↓
Hidden Imbalance
↓
Candle 3 Upper Wick CE
The range between these CE levels becomes the bearish Implied Fair Value Gap.
Price may later retrace upward into this range.
In a bearish market narrative, the trader studies whether price reacts from the Implied FVG and continues lower.
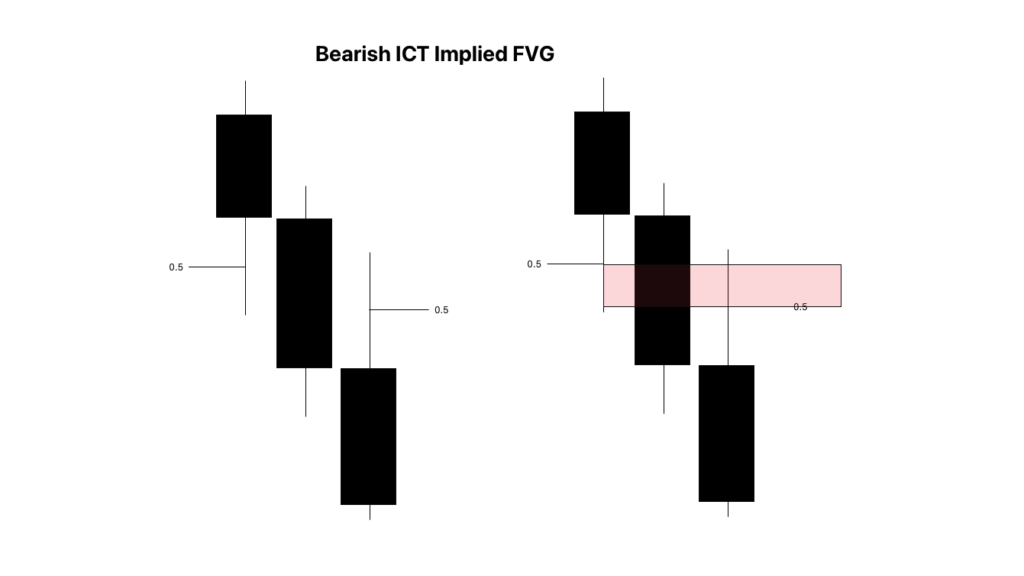
Example of a Bearish Implied FVG
Suppose price begins aggressively moving lower.
The first candle has a lower wick extending from 110 to 106.
The Consequent Encroachment of this wick is:
(110 + 106) ÷ 2 = 108
Therefore:
Candle 1 Lower Wick CE = 108
A large bearish displacement candle forms.
The third candle has an upper wick extending from 104 to 100.
The wick midpoint is:
(104 + 100) ÷ 2 = 102
Therefore:
Candle 3 Upper Wick CE = 102
The range between 102 and 108 becomes the bearish ICT Implied FVG.
Bearish Implied FVG = 102 to 108
The chart may not contain a classic Fair Value Gap.
But the wick CE levels expose the hidden imbalance range.
ICT Implied FVG vs Regular Fair Value Gap
A regular ICT Fair Value Gap is visually obvious.
Michael J. Huddleston describes a Fair Value Gap as:
“It is a range in price delivery where one side of the market liquidity is offered.”
A normal FVG is generally framed by a three-candle structure.
For a bullish FVG:
Candle 1 High < Candle 3 Low
The area between Candle 1 high and Candle 3 low is the bullish FVG.
For a bearish FVG:
Candle 1 Low > Candle 3 High
The range between Candle 3 high and Candle 1 low becomes the bearish FVG.
An ICT Implied FVG is different.
The wicks overlap.
No obvious open gap is visible.
Therefore, the trader uses wick Consequent Encroachment levels.
The difference can be understood as:
Regular FVG – Uses candle highs and lows
Implied FVG – Uses the CE or 50% levels of adjacent wicks
Regular FVG – Visible imbalance
Implied FVG – Hidden or implied imbalance
Both concepts study inefficient price delivery.
But the method used to identify their boundaries is different.
ICT Implied FVG vs Inversion FVG
This is a very important distinction.
Implied FVG and Inversion FVG are not the same concept.
The abbreviation IFVG is commonly used for both, which can create confusion.
An Implied Fair Value Gap is a hidden FVG identified from the Consequent Encroachment of adjacent candle wicks.
It normally forms around a large displacement candle where no traditional Fair Value Gap is visible.
An Inversion Fair Value Gap begins as a normal FVG.
Price later trades through or invalidates that FVG.
The failed gap can then be studied from the opposite direction.
Therefore:
Implied FVG = Hidden FVG based on wick CE levels
Inversion FVG = Previous FVG that fails and is used from the opposite side
These two concepts should not be mixed. This naming distinction is also explicitly noted in contemporary ICT study references because both terms are frequently abbreviated as IFVG.
Why Is ICT Implied FVG Important?
The ICT Implied FVG is important because not every aggressive price movement creates a textbook Fair Value Gap.
Sometimes price clearly displaces.
The middle candle has a large body.
The movement appears strongly one-sided.
But the first and third candle wicks overlap.
A trader who only searches for traditional FVGs may ignore the entire movement.
The Implied Fair Value Gap provides another way to study this type of displacement.
It allows the trader to identify a hidden price range inside the movement.
This range can then be extended forward and used as a price reference.
The concept is especially useful for understanding price delivery where displacement is visually obvious but no traditional FVG has been left behind.
How to Identify ICT Implied FVG on a Chart
Start by ignoring small, random candles.
Look for a noticeable displacement move.
The middle candle should have a large body compared with nearby candles.
Next, ask:
Did this movement create a normal Fair Value Gap?
If a clear regular FVG is already present, mark the normal FVG.
The Implied FVG concept becomes especially important when no normal FVG is visible.
Now study Candle 1 and Candle 3.
Do their wicks extend into the body range of the displacement candle?
If yes, study the correct wicks.
For bullish displacement:
Candle 1 upper wick
and
Candle 3 lower wick
For bearish displacement:
Candle 1 lower wick
and
Candle 3 upper wick
Measure the 50% level of both wicks.
Then mark the range between the two levels.
Extend the range forward.
This is the ICT Implied FVG.
How to Mark ICT Implied FVG Using Fibonacci Tool
A Fibonacci retracement tool can make the calculation easier.
The Fibonacci tool should be configured to show the 0.5 or 50% level.
For Bullish Implied FVG
First measure the upper wick of Candle 1.
Place the Fibonacci tool from the body boundary to the wick high or from the wick high to the body boundary.
The direction of the tool is not important if you only need the 50% midpoint.
Mark 0.5.
This is the CE of Candle 1 upper wick.
Next, measure the lower wick of Candle 3.
Again mark the 0.5 level.
This is the CE of Candle 3 lower wick.
Draw a rectangle between the two CE levels.
Extend the rectangle to the right.
This becomes the bullish Implied FVG.
For Bearish Implied FVG
Measure the lower wick of Candle 1.
Mark its 50% level.
Then measure the upper wick of Candle 3.
Mark its 50% level.
Draw the zone between these two CE levels.
Extend the zone forward.
This becomes the bearish Implied FVG.
How to Trade ICT Implied FVG
An ICT Implied FVG should not be traded as an isolated candle pattern.
The presence of three candles and overlapping wicks alone is not enough to create a complete trade narrative.
First determine the expected direction of price delivery.
Is the market expected to seek buy-side liquidity?
Or is price expected to seek sell-side liquidity?
Then identify the higher timeframe context.
Study:
Higher timeframe PD Arrays
Premium and discount
Buy-side liquidity
Sell-side liquidity
Daily bias
Market Structure Shift
Displacement
Once directional context is established, look for a relevant Implied FVG.
A commonly documented ICT-study workflow is to establish the directional context, observe a reaction from a higher-timeframe PD Array or structural shift, locate the displacement candle, mark the adjacent wick CE levels, and then monitor a retracement into the hidden gap.
Bullish ICT Implied FVG Trading Model
A basic bullish model may develop like this:
Step 1 – Sell-side liquidity is taken
Price trades below an old low or another sell-side liquidity pool.
Step 2 – Bullish reaction develops
Price stops moving lower and begins repricing higher.
Step 3 – Bullish Market Structure Shift appears
Price shows a bullish change in short-term delivery.
Step 4 – Bullish displacement forms
A large bullish candle moves price aggressively higher.
Step 5 – No normal bullish FVG is visible
Candle 1 and Candle 3 wicks overlap the displacement candle.
Step 6 – Bullish Implied FVG is marked
Measure Candle 1 upper wick CE.
Measure Candle 3 lower wick CE.
Mark the area between them.
Step 7 – Price retraces
Price returns downward toward the Implied FVG.
Step 8 – Study price reaction
The trader watches whether price respects the hidden gap.
Step 9 – Price seeks upside liquidity
If the bullish narrative remains valid, buy-side liquidity may remain the objective.
The Implied FVG provides a refined price reference inside the bullish delivery.
Bearish ICT Implied FVG Trading Model
The bearish model is reversed.
Step 1 – Buy-side liquidity is taken
Price trades above an old high or another buy-side liquidity pool.
Step 2 – Bearish reaction develops
Price begins moving lower.
Step 3 – Bearish Market Structure Shift forms
Short-term price delivery becomes bearish.
Step 4 – Bearish displacement appears
A large bearish candle delivers price rapidly lower.
Step 5 – No normal bearish FVG is present
The adjacent candle wicks overlap the displacement candle.
Step 6 – Bearish Implied FVG is marked
Measure Candle 1 lower wick CE.
Measure Candle 3 upper wick CE.
Mark the range between the CE levels.
Step 7 – Price retraces higher
Price returns toward the Implied FVG.
Step 8 – Study reaction inside the zone
Look for bearish price delivery.
Step 9 – Price seeks downside liquidity
If the bearish narrative remains valid, sell-side liquidity may become the objective.
Key Levels of an ICT Implied FVG
The ICT Implied FVG is a range.
Therefore, it contains several important price references.
Upper Boundary
The higher CE level forms the top of the Implied FVG.
It defines the upper limit of the hidden imbalance.
Lower Boundary
The lower CE level forms the bottom of the Implied FVG.
It defines the lower limit of the zone.
Implied FVG Consequent Encroachment
The complete Implied FVG itself also has a midpoint.
After finding the upper and lower boundary, calculate:
Implied FVG CE = (IFVG High + IFVG Low) ÷ 2
This gives the 50% level of the complete Implied FVG zone.
Therefore, two types of CE measurement are involved:
Wick CE – Used to construct the Implied FVG
IFVG CE – Midpoint of the completed Implied FVG range
Do not confuse these levels.
The wick CE levels create the zone.
The midpoint of the completed zone is an additional internal reference.
Does Price Always Return to an Implied FVG?
No.
An ICT Implied FVG is not a guarantee that price must immediately return to the zone.
Price may continue expanding.
It may seek an external liquidity objective first.
The Implied FVG may remain open for a longer period.
Price can also trade completely through the zone.
Therefore, traders should avoid the belief:
Implied FVG formed = Price must retrace immediately
The Implied FVG is a price reference.
Its importance depends on the overall market narrative.
Time, liquidity, higher timeframe bias and price delivery remain important.
Best Timeframe for ICT Implied FVG
The Implied Fair Value Gap is based on candle structure.
Therefore, the concept can be studied on different timeframes.
However, the timeframe should match the trader’s market model.
A higher timeframe Implied FVG may be used as a larger PD Array or price reference.
A lower timeframe Implied FVG may help refine execution after a liquidity event or price shift.
For example:
Higher timeframe identifies directional context.
Price reaches a higher timeframe PD Array.
Liquidity is taken.
The trader moves to a lower timeframe.
A Market Structure Shift occurs.
Displacement forms.
An Implied FVG is identified inside the lower timeframe displacement.
Price retraces into the hidden FVG.
The trader studies the reaction.
The timeframe alone does not make the Implied FVG strong.
Its location and price narrative are more important.
Common Mistakes When Trading ICT Implied FVG
One common mistake is confusing Implied FVG with Inversion FVG.
They are different concepts.
Another mistake is marking every large candle as an Implied Fair Value Gap.
The trader must study the adjacent wicks and calculate their CE levels.
Some traders also ignore displacement.
A random three-candle formation inside consolidation should not automatically be treated the same as a strong directional price delivery.
Another mistake is using the whole wicks as the Implied FVG.
The zone is based on the Consequent Encroachment of the relevant wicks, not simply the complete wick ranges.
Traders may also trade every IFVG without considering liquidity.
The trader should first understand why price is expected to move higher or lower.
Finally, do not assume price must react exactly from the first boundary of the zone.
Price can enter deeper into the Implied FVG.
It may reach its midpoint.
It may completely trade through the zone.
The complete price narrative must be monitored.
ICT Implied FVG Identification Checklist
Before marking an ICT Implied FVG, check the following:
Is there a clear large displacement candle?
Does the middle candle have a significant body?
Is a normal Fair Value Gap absent?
Does Candle 1 have a relevant wick overlapping the middle candle?
Does Candle 3 have an opposing wick overlapping the middle candle?
Have you identified the correct wick for the direction of displacement?
Have you calculated the 50% level of both wicks?
Is there a price range between these CE levels?
Have you extended this hidden range forward?
Does the Implied FVG agree with the expected direction of price delivery?
Is there a logical liquidity objective?
If these conditions are present, the price range can be studied as an ICT Implied FVG.
Final Thoughts on ICT Implied FVG
The ICT Implied FVG is a hidden price delivery concept used when strong displacement occurs without creating a classic Fair Value Gap.
A regular FVG is easy to see.
There is a clear imbalance between Candle 1 and Candle 3.
An Implied Fair Value Gap is different.
The candle wicks overlap.
The visible gap disappears.
However, the Consequent Encroachment of the relevant wicks can expose a hidden price range.
For a Bullish Implied FVG, use the CE of Candle 1’s upper wick and Candle 3’s lower wick.
For a Bearish Implied FVG, use the CE of Candle 1’s lower wick and Candle 3’s upper wick.
The range between these wick midpoint levels becomes the Implied Fair Value Gap.
The most important point is not to identify the pattern blindly.
Study the ICT Implied FVG with liquidity, displacement, Market Structure Shift, higher timeframe PD Arrays and directional price delivery.
The Implied FVG is not simply another rectangle to draw on a chart.
It is a way of studying hidden inefficiency when the market displaces but does not leave a traditional visible Fair Value Gap.