The ICT NWOG – New Week Opening Gap is a higher-time-frame price reference introduced by Michael J. Huddleston, the founder of ICT (Inner Circle Trader). He publicly taught this concept during the 2023 ICT Mentorship Lecture, explaining how the gap between one trading week’s closing price and the next week’s opening price can remain relevant for weeks or even months.
Most traders notice a weekend gap, wait for it to be filled, and then remove it from consideration. ICT takes a different approach. An NWOG is treated as a continuing fair-value reference that price may revisit, consolidate around, reject from, or use as a target.
As Huddleston explains:
“The gap is not a random event. It’s engineered, it’s designed.”
This is what makes the ICT NWOG different from the traditional idea of simply trading a weekend gap fill.
What Is the ICT NWOG?
The ICT New Week Opening Gap, commonly abbreviated as NWOG, is the price range between:
- The previous Friday’s closing price
- The following Sunday’s opening price
For futures markets, ICT uses:
- Friday closing price: 16:59 New York time
- Sunday opening price: 18:00 New York time
When the Sunday opening price differs from Friday’s closing price, the space between those two prices forms the New Week Opening Gap.
If Sunday opens below Friday’s close, Friday’s closing price becomes the NWOG high and Sunday’s opening price becomes the NWOG low.
If Sunday opens above Friday’s close, Sunday’s opening price becomes the NWOG high and Friday’s closing price becomes the NWOG low.
Unlike a Fair Value Gap, which forms through three consecutive candles, an NWOG is a genuine gap in trading activity. No transactions were recorded between the Friday close and Sunday open. For this reason, ICT describes it as a real liquidity void.
Why Is the New Week Opening Gap Important?
The ICT NWOG represents an area of what Huddleston calls large fund fair value.
Institutional price delivery may refer back to these levels when the market is searching for fair valuation. An NWOG can therefore behave as:
- Support
- Resistance
- A price magnet
- A retracement objective
- A continuation level
- A profit target
- A boundary within a consolidation
- A reference point for identifying a trending week
An old NWOG does not automatically become invalid after price trades through it or fills the original gap.
Huddleston states:
“Price will many times gravitate back to it.”
The market may revisit an NWOG formed several weeks earlier because the opening and closing prices that created it can remain active reference points within algorithmic price delivery.
How to Draw the ICT NWOG
The ICT New Week Opening Gap should be marked on a lower-time-frame chart. A one-minute or five-minute chart is generally suitable because it allows the trader to identify the exact closing and opening prices.
A daily chart should not be used to obtain these levels because the daily candle may use a settlement price that does not match the exact market close required for the model.
Follow this process:
- Open a one-minute or five-minute chart.
- Locate the final price printed at 16:59 New York time on Friday.
- Mark that closing price with a horizontal ray.
- Locate the first opening price at 18:00 New York time on Sunday.
- Mark the Sunday opening price with another horizontal ray.
- Extend both levels into future price action.
- Measure the range between the two prices.
- Mark the 50% level of the range.
The upper and lower boundaries form the complete NWOG. The midpoint becomes its Consequent Encroachment.
It is also helpful to label each NWOG using the date of the Sunday on which it formed. This makes it easier to manage several historical NWOGs on the same chart.
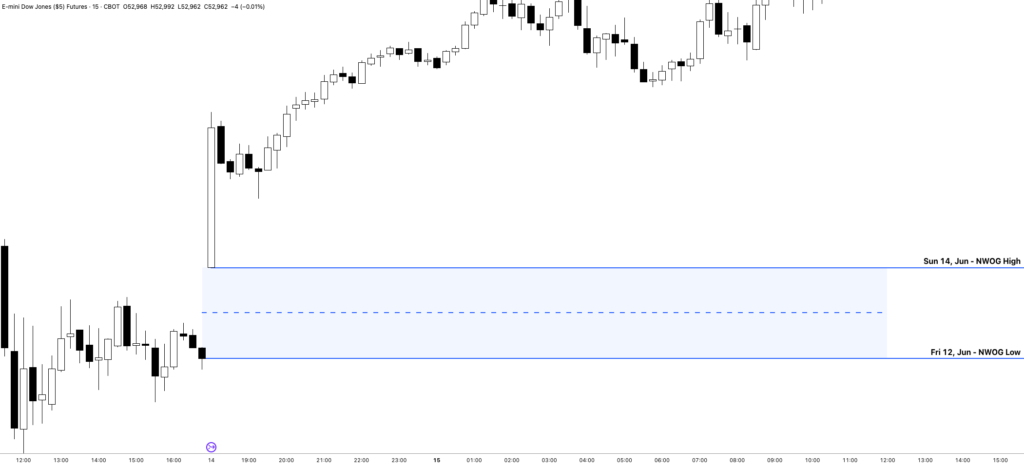
Consequent Encroachment of the NWOG
The 50% level of the ICT NWOG is known as Consequent Encroachment, commonly abbreviated as CE.
To find it, place a Fibonacci retracement tool between Friday’s closing price and Sunday’s opening price. The 0.50 level identifies the exact midpoint of the gap.
The correct terminology is important:
- The midpoint of an inefficiency or gap is Consequent Encroachment.
- The midpoint of an Order Block is Mean Threshold.
Consequent Encroachment can be highly sensitive. Price may reject from it, consolidate around it, use it as support or resistance, or trade through it before reaching the opposite boundary of the NWOG.
A trader may also divide the NWOG into four equal quadrants. This creates the following reference levels:
- NWOG high
- Upper quadrant
- Consequent Encroachment
- Lower quadrant
- NWOG low
The additional quadrants are optional. Traders who prefer clean charts can use only the high, low, and Consequent Encroachment.
Current and Old New Week Opening Gaps
The current NWOG is the gap created between the most recent Friday close and Sunday open.
An old NWOG is any New Week Opening Gap carried forward from a previous week.
Both can influence current price action. The current gap helps traders evaluate the developing condition of the week, while older NWOGs may function as external targets or areas of support and resistance.
ICT initially recommends keeping at least four NWOGs on the chart, although five is preferred. Five weeks of data provide a practical rolling view of approximately one month.
More experienced traders can use a 60-day lookback period. Every NWOG formed during the previous 60 calendar days can be extended into the current price action.
This does not mean every level will produce a reaction. It gives the trader a structured map of potential fair-value references that can be combined with directional bias, liquidity and other ICT PD Arrays.
Using the ICT NWOG to Identify Trending Conditions
The relationship between price and the current NWOG can help traders determine whether the market is preparing to trend.
A trending condition is more likely when price:
- Moves sharply away from the current NWOG
- Shows strong displacement
- Fails to return immediately
- Continues expanding in one direction
- Uses an old NWOG as the next objective
Huddleston explains the principle clearly:
“Range expansion or trending is when we leave the New Week Opening Gap and don’t return back to it.”
For example, suppose price begins the week near the current NWOG and then aggressively expands above it. If price does not retrace into the gap and continues reaching for liquidity or an old NWOG above, the market may be developing a bullish weekly trend.
The same logic applies in bearish conditions. A strong displacement below the current NWOG, followed by continued delivery toward lower liquidity and older NWOGs, can signal a bearish trending model.
The NWOG does not determine direction by itself. Direction should still be established through higher-time-frame analysis, liquidity objectives, market structure and the overall draw on price.
Using the ICT NWOG to Identify Consolidation
The current NWOG can also reveal when the market is likely to remain range-bound.
Consolidation is more likely when price:
- Repeatedly returns to the current NWOG
- Moves above and below its boundaries
- Spends significant time inside the gap
- Fails to create sustained displacement
- Trades around several nearby NWOGs
When multiple New Week Opening Gaps are clustered close together, the market may continue rotating between them rather than producing a clean directional expansion.
In this environment, traders should avoid expecting a one-sided move that continues for several days. Price may take nearby buy-side liquidity, return to the NWOG, trade toward sell-side liquidity, and then rotate back into the range again.
This condition may still provide short-term trading opportunities, but expectations should be adjusted. Smaller targets and quicker trade management are usually more appropriate than holding for an extended weekly trend.
NWOGs as Price Magnets and Targets
Old New Week Opening Gaps can act like magnets for price.
When price moves away from the current NWOG, the closest old NWOG in the direction of the higher-time-frame draw may become the first objective. The next NWOG can then become a secondary target.
These levels may be used as:
- Initial profit objectives
- Final profit objectives
- Partial-profit levels
- Potential reversal zones
- Mile markers during a larger price expansion
A mile marker is an intermediate level that helps the trader judge whether price is continuing toward a more distant objective.
ICT also teaches traders to observe the midpoint between two separate NWOGs. When price reaches approximately halfway from one NWOG toward the next, the probability of completing the move toward the next gap may increase.
This should not be treated as a mechanical rule. The level must agree with the market’s directional bias and surrounding liquidity narrative.
The Alternative Monday Opening NWOG
ICT also presents a second way to measure the New Week Opening Gap.
The standard or “actual” NWOG uses:
- Friday’s 16:59 closing price
- Sunday’s 18:00 opening price
The alternative version uses:
- Friday’s 16:59 closing price
- Monday’s 09:30 opening price
This second measurement ignores the Sunday evening and overnight trading session. It compares the previous Friday close directly with the Monday New York equity opening.
Traders can maintain two separate chart templates:
- NWOG Actual: Friday close to Sunday open
- NWOG: Friday close to Monday 09:30 open
The two measurements create different fair-value references. Studying both allows traders to observe which set of levels is being respected during the week.
Combining NWOG With Other ICT Concepts
The ICT NWOG should not be used as a standalone entry signal.
A trader should not assume that price must reverse simply because it reaches an old New Week Opening Gap. Price can stop at the level, consolidate inside it, pass directly through it, or use it as a temporary reference before continuing toward another objective.
NWOG analysis becomes more effective when combined with:
- Higher-time-frame directional bias
- Daily and weekly liquidity objectives
- Buy-side and sell-side liquidity
- Fair Value Gaps
- Order Blocks
- Breaker Blocks
- Market Structure Shifts
- Displacement
- Premium and discount arrays
- Time-of-day analysis
- Economic calendar events
For example, when the higher-time-frame bias is bullish and buy-side liquidity rests above the market, an old NWOG located near that liquidity may provide a logical upside target.
If price first trades into a discount PD Array, produces bullish displacement and confirms a Market Structure Shift, the NWOG above can be used as a profit objective rather than as the entry itself.
ICT NWOG Trading Checklist
Before using a New Week Opening Gap, confirm the following:
- The Friday closing price was taken from a lower-time-frame chart.
- The Sunday opening price was marked at 18:00 New York time.
- The high and low of the NWOG are correctly identified.
- Consequent Encroachment is marked at the 50% level.
- The NWOG has been extended into future price action.
- The gap is labeled with its formation date.
- At least five recent NWOGs are visible.
- The higher-time-frame directional bias is clear.
- Nearby liquidity objectives have been identified.
- The market is showing either trending or consolidation characteristics.
- The NWOG agrees with other ICT PD Arrays.
- Risk is based on the trade setup, not on the existence of the NWOG alone.
Final Thoughts on the ICT New Week Opening Gap
The ICT NWOG – New Week Opening Gap provides traders with a structured way to track fair-value references across several weeks of price action.
Instead of discarding a weekend gap after it has been filled, the ICT approach keeps its high, low and Consequent Encroachment projected into the future. These levels may later behave as support, resistance, price magnets, intermediate objectives or final targets.
The current NWOG can also provide information about market conditions. Strong displacement away from it may signal the beginning of a trending week, while repeated returns to it may suggest consolidation.
The most important principle is that the New Week Opening Gap is not a complete trading system. It is a framework for understanding where price may seek fair value. When combined with liquidity, directional bias, market structure and other ICT concepts, it can provide a clearer view of how price is likely to move from one important reference point to another.