

ICT Killzones are specific time windows during the trading day when traders anticipate important price delivery, liquidity runs and potential trade setups.
The concept is associated with Michael J. Huddleston, the Inner Circle Trader (ICT). Instead of watching the chart throughout the entire day, the ICT approach places strong importance on time and price.
A Fair Value Gap, Order Block or liquidity sweep appearing randomly during an inactive period may not carry the same context as a similar setup forming during an important trading session.
This is where ICT Killzones become important.
Simply:
Higher Timeframe Bias → Liquidity → Killzone Time → Displacement → Entry Model → Target
The Killzone does not tell the trader whether to buy or sell. It tells the trader when to pay closer attention to price.
What Are ICT Killzones?
An ICT Killzone is a predefined period of the trading day where a trader looks for the delivery of a planned market narrative.
During these periods, price may:
- Raid previous liquidity.
- Manipulate above or below a session range.
- Create the high or low of the day.
- Deliver strong displacement.
- Form Fair Value Gaps.
- Shift short-term market structure.
- Retrace into an ICT PD Array.
- Continue towards higher timeframe liquidity.
Killzones should not be confused with the complete trading session.
For example, the London trading session continues for several hours. However, the ICT London Killzone focuses on a smaller portion of the session.
The same concept applies to New York.
Trading Session = Broad market operating period
Killzone = Specific time window where the trader searches for a setup
ICT’s official course material separates the Asian range, New York Killzone and London Close into dedicated lessons, showing the importance of treating these periods as distinct parts of daily price delivery.
Why Are ICT Killzones Important?
The primary importance of ICT Killzones is timing.
Many traders only study price.
They identify:
- Fair Value Gaps.
- Order Blocks.
- Breaker Blocks.
- Liquidity.
- Market Structure Shifts.
But ICT trading also gives importance to when price reaches these areas.
Suppose EURUSD is trading inside a Daily bullish narrative.
Sell-side liquidity is resting below the Asian range.
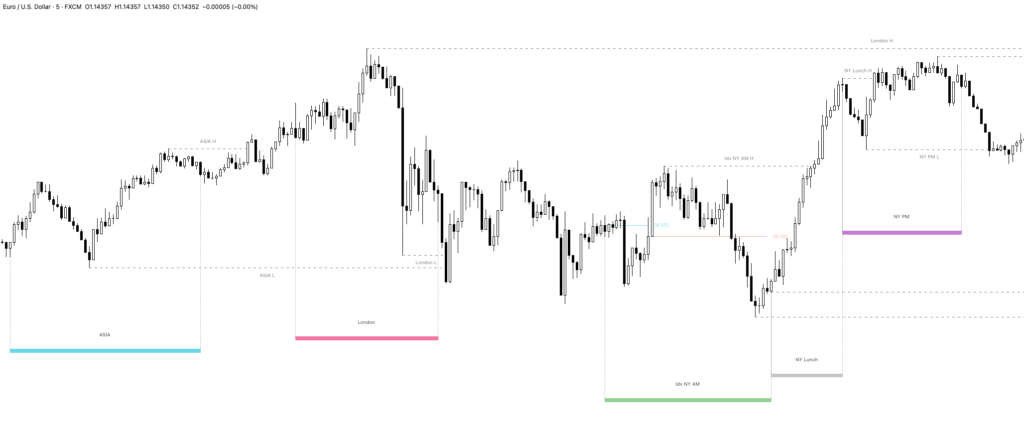
Price trades below the Asian low during the London Killzone and immediately creates bullish displacement.
This sequence is more meaningful than simply saying:
“Price touched a bullish FVG.”
The complete narrative is:
Bullish HTF Bias → Asian Sell-Side Liquidity → London Killzone Raid → Bullish Displacement → FVG Entry → Buy-Side Liquidity Target
The Killzone gives a time framework to the setup.
ICT Forex Killzone Times
The following times use New York local time.
Traders should set the chart or session indicator to the America/New_York timezone where possible. This allows the chart to automatically adjust between EST and EDT instead of manually changing the Killzone by one hour.
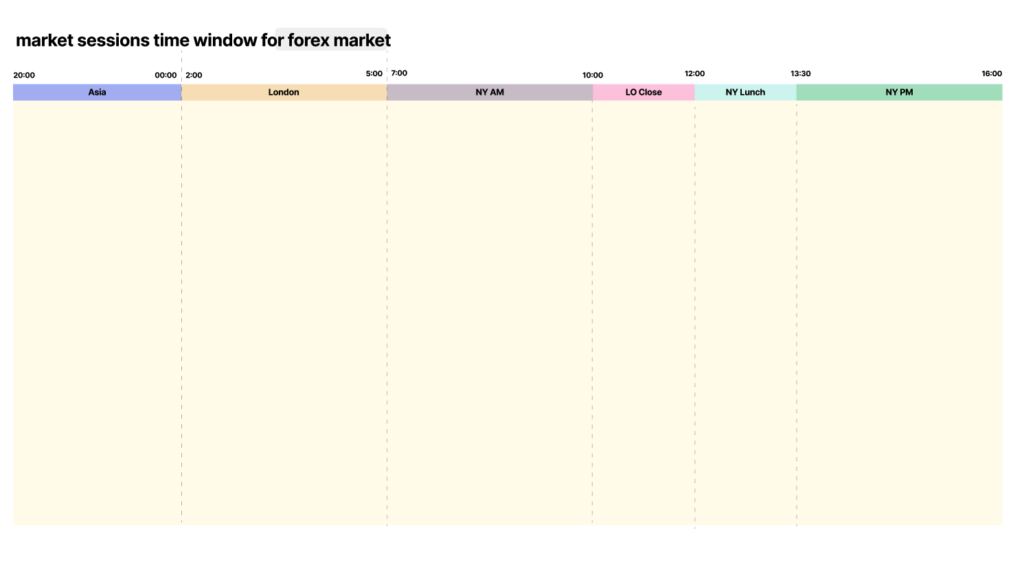
Forex Killzone Time Table
| ICT Killzone | New York Time | Main Focus |
|---|---|---|
| Asian Killzone | 20:00–22:00 | Asian currency activity and early range development |
| London Killzone | 02:00–05:00 | Asian liquidity raids and London expansion |
| New York Killzone | 07:00–10:00 | USD movement, news and London interaction |
| London Close Killzone | 10:00–12:00 | Daily range completion and retracement |
| New York Lunch Session | 12:00–13:30 | Ranging/Retracement |
| New York PM Killzone | 13:30–16:00 | Afternoon continuation or reversal |
An important distinction is that many ICT traders also mark a broader Asian Range, commonly extending beyond the narrower Asian execution window. The official ICT course itself contains material specifically focused on implementing the Asian range rather than treating every overnight candle as a Killzone entry signal.
ICT Killzone Times for Futures and Indices
Index futures should not always be traded with the exact same timing framework used for Forex.
CME products such as NQ and ES can trade nearly 24 hours per trading day, but the U.S. equity cash market has a core session from 09:30 to 16:00 New York time. Therefore, the New York morning and afternoon periods become particularly important when studying index futures.
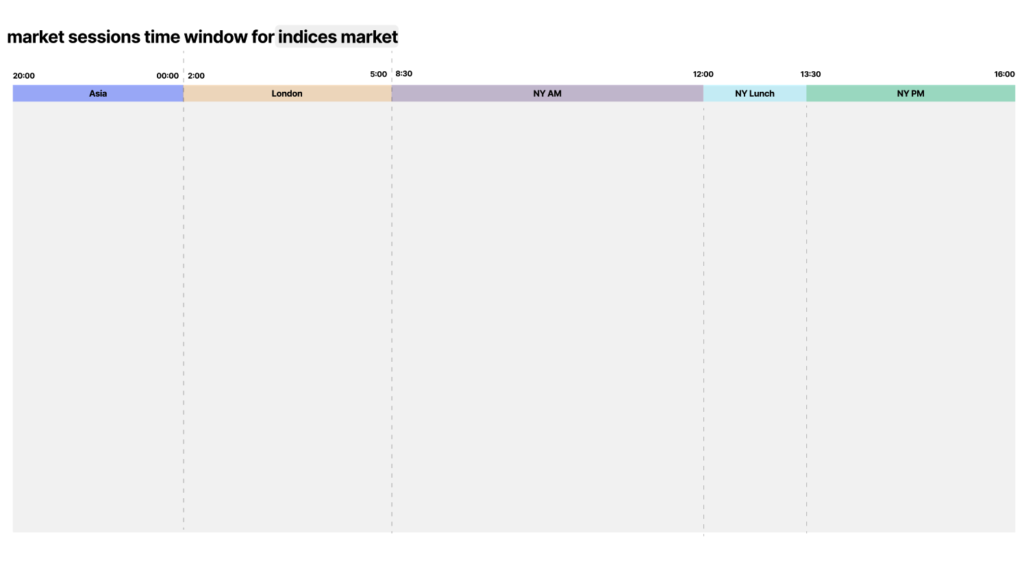
Futures and Indices Time Windows
| Trading Window | New York Time | Main Focus |
|---|---|---|
| Overnight/Asian Range | 20:00–00:00 | Overnight liquidity and range formation |
| London Window | 02:00–05:00 | Premarket structure and overnight liquidity |
| New York AM Killzone | 08:30–11:00 | Main index futures opportunity window |
| New York Lunch Session | 12:00–13:30 | Ranging/Retracement |
| New York PM Killzone | 13:30–16:00 | Afternoon continuation or reversal |
The 09:30 New York cash open falls inside the important New York morning period. NYSE identifies 09:30–16:00 ET as its core trading session.
For index futures traders, this means the most important period is generally:
08:30 → 09:30 → 10:00 → 11:00
Each time can represent a different stage of price delivery.
08:30 may introduce economic data volatility.
09:30 introduces the U.S. equity cash open.
10:00 can bring another important stage of morning price delivery.
The trader should not assume every one of these times will produce a reversal. They are times to observe how price interacts with the planned liquidity narrative.

Types of ICT Killzones
1. ICT Asian Killzone
Time: 20:00–22:00 New York Time
The Asian Killzone occurs during the early part of the Forex trading day.
Price action is often more contained compared with London or New York. However, the Asian period can establish important liquidity that becomes relevant later.
The trader should observe:
- Asian High.
- Asian Low.
- Equal Highs.
- Equal Lows.
- Short-term consolidation.
- Overnight Fair Value Gaps.
- Previous day liquidity.
The primary value of the Asian period is frequently the range it creates.
Suppose GBPUSD consolidates during Asia.
The market creates:
Asian High → Range → Asian Low
When London begins, price may raid one side of this range before delivering towards the opposite side.
Example
Higher timeframe bias is bullish.
During Asia:
Price creates a narrow range.
Sell-side liquidity forms below the Asian Low.
During London:
Asian Low Raid → Bullish Displacement → FVG → Long Entry
The Asian range gave the trader the liquidity reference.
Best Pairs for the Asian Killzone
Pairs involving Asian-Pacific currencies are generally more relevant:
- USDJPY.
- AUDUSD.
- NZDUSD.
- AUDJPY.
- NZDJPY.
- AUDNZD.
The Asian period is usually less important as an execution window for pairs such as EURGBP.
For many ICT traders, the better use of Asia is simply:
Mark the High → Mark the Low → Wait for London
2. ICT London Killzone
Time: 02:00–05:00 New York Time
The ICT London Killzone is one of the most important time windows for Forex traders.
The London period can produce a significant directional move and may establish an important daily high or daily low.
The trader should closely monitor:
- Asian High.
- Asian Low.
- Previous Day High.
- Previous Day Low.
- Previous session liquidity.
- Higher timeframe PD Arrays.
- Premium and Discount.
- Daily bias.
A common London narrative is:
Asian Consolidation → Liquidity Raid → Displacement → Directional Expansion
Bullish London Example
Daily bias is bullish.
Price trades near a higher timeframe discount PD Array.
During the London Killzone:
Asian Low Taken → Sell-Side Liquidity Raided → Bullish MSS → Bullish FVG Created
The trader can search for a long entry during the retracement.
Target:
- Asian High.
- Previous Day High.
- Relative Equal Highs.
- Higher timeframe buy-side liquidity.
Bearish London Example
Daily bias is bearish.
Price trades into premium.
During London:
Asian High Taken → Buy-Side Liquidity Raid → Bearish Displacement → Bearish FVG
The trader searches for a short entry.
Best Pairs for the London Killzone
The main pairs to monitor are:
- EURUSD.
- GBPUSD.
- EURGBP.
- GBPJPY.
- EURJPY.
For a beginner, EURUSD and GBPUSD are generally easier instruments to study because the connection between London activity and the currencies involved is more direct.
Do not open five charts and search for five trades.
Select one or two pairs.
Study the same Killzone repeatedly.
3. ICT New York Killzone for Forex
Time: 07:00–10:00 New York Time
The ICT New York Killzone is particularly important for Forex pairs involving the U.S. Dollar.
The official Inner Circle Trader channel includes a dedicated lesson specifically for the ICT New York Killzone.
During New York, the trader asks an important question:
Will New York continue the London move or reverse it?
New York Continuation
Suppose:
Daily bias is bullish.
London raids sell-side liquidity.
London creates bullish displacement.
Price begins retracing before New York.
New York may provide another bullish entry.
Sequence:
London Expansion Higher → New York Retracement → Discount PD Array → Bullish Continuation
The target may remain higher timeframe buy-side liquidity.
New York Reversal
Suppose London has already produced a large bullish expansion.
Price reaches a major Daily premium PD Array.
Buy-side liquidity is taken.
During New York:
London High Raid → Bearish Displacement → MSS → Bearish FVG
New York may reverse part of the London move.
However, traders should not automatically fade London.
A reversal requires context and confirmation.
Important Levels for the New York Killzone
Mark:
- London High.
- London Low.
- Asian High.
- Asian Low.
- Previous Day High.
- Previous Day Low.
- New York Midnight Open.
- Higher timeframe FVG.
- Higher timeframe Order Block.
- Daily liquidity objective.
Best Pairs for the Forex New York Killzone
Common instruments include:
- EURUSD.
- GBPUSD.
- USDJPY.
- USDCAD.
- XAUUSD.
For USD-based Forex trading, EURUSD and GBPUSD remain important pairs to study.
Gold traders may also focus on XAUUSD, but gold can react aggressively around major U.S. data. Lower position risk may be required because fast price delivery can significantly increase execution risk.
4. ICT London Close Killzone
Time: 10:00–12:00 New York Time
The London Close Killzone occurs as the London trading day approaches its later stage.
The official ICT material also treats the London Close Killzone as a separate lesson.
This period is different from the London Open.
The early London session may help establish a directional expansion.
London Close may participate in:
- Profit taking.
- Retracement.
- Daily range completion.
- Movement away from the daily extreme.
- Short-term reversal.
Suppose the market is bullish.
London creates the low of the day.
Price expands higher through New York.
Buy-side liquidity is reached.
During London Close, price may retrace lower.
This does not automatically mean the Daily trend has turned bearish.
It may simply be a retracement from the completed daily expansion.
Best Pairs for London Close
Focus on liquid major pairs:
- EURUSD.
- GBPUSD.
- USDJPY.
London Close trading requires experience.
Beginners should avoid automatically entering against the day’s move simply because the London Close Killzone has started.
5. ICT New York AM Killzone for Index Futures
Time: 08:30–11:00 New York Time
For traders studying NQ, ES and YM, the New York AM window is one of the most important periods of the trading day.
The core NYSE cash session opens at 09:30 New York time, while CME equity-index futures are available for nearly continuous trading across the broader trading day.
This creates several important references:
- Overnight High.
- Overnight Low.
- London High.
- London Low.
- Previous Day High.
- Previous Day Low.
- 08:30 Open.
- 09:30 Cash Open.
- New York Midnight Open.
Basic Index Futures Narrative
Suppose NQ has a bullish Daily bias.
Sell-side liquidity exists below the London Low.
During New York AM:
London Low Raid → Bullish Displacement → MSS → Bullish FVG
Price retraces into the FVG.
The trader enters long.
Target:
Internal Liquidity → Overnight High → Previous Day High
The Killzone did not create the bullish bias.
The Killzone gave the trader a time window to wait for confirmation of the bullish narrative.
Best Futures and Indices for New York AM
The main markets include:
- NQ or MNQ.
- ES or MES.
- YM or MYM.
- RTY or M2K.
NQ
Nasdaq futures generally attract traders looking for stronger intraday movement.
Price can move rapidly.
Good for:
- Displacement study.
- FVG setups.
- Liquidity raids.
- Experienced short-term traders.
ES
S&P 500 futures may suit traders who prefer to study a broader U.S. equity benchmark.
Good for:
- Market structure.
- Index SMT comparison.
- Liquidity analysis.
- ES and NQ comparative analysis.
YM
Dow futures can also be used in ICT analysis.
YM is particularly useful when studying SMT Divergence between correlated U.S. indices.
Example:
NQ Takes Previous High
ES Takes Previous High
YM Fails to Take Previous High
This relative divergence can become part of the broader narrative.
No individual index is universally the “best.” The trader should select the market whose price delivery and volatility match the model being studied.
6. ICT New York Lunch Session
Broader Lunch Period: 12:00–13:30 New York Time
ICT New York Lunch Macro: 11:50–12:10 New York Time
The New York Lunch period is an important part of the intraday session structure, particularly for traders studying NQ, ES and YM.
However, New York Lunch should not automatically be treated as another major Killzone where the trader must search for a new trade.
The morning session has already had several opportunities to deliver price.
By the time New York Lunch begins, price may have already:
- Raided overnight liquidity.
- Taken the London High or Low.
- Reacted to 08:30 economic news.
- Delivered through the 09:30 cash open.
- Expanded towards the Daily objective.
- Reached Previous Day High or Previous Day Low.
- Completed a large part of the expected Daily range.
Therefore, the first question during New York Lunch is not:
Where can I enter a trade?
The better question is:
What has the New York AM session already accomplished?
New York Lunch Period vs ICT Lunch Macro
Traders should understand the difference between the broader lunch period and the specific ICT Lunch Macro.
The broader New York Lunch phase can be viewed as:
12:00 → 13:30 New York Time
This is the period between the main New York AM delivery and the beginning of the New York PM session framework.
Inside this phase, ICT specifically identifies the 11:50–12:10 New York Lunch Macro.
Michael J. Huddleston has directly referred to 11:50–12:10 as the NQ Nasdaq Lunch Macro.
Therefore:
New York Lunch Period = Broader session phase
11:50–12:10 = Specific ICT Lunch Macro
Do not treat the complete lunch period as one continuous entry window.
Why Traders Generally Avoid New York Lunch Trading
For many intraday traders, the broader New York Lunch period is a lower-priority period for initiating random new positions.
The main reason is that the AM session may have already completed the primary price delivery.
Suppose the Daily bias is bullish.
During New York AM:
Overnight Low Raid → Bullish Displacement → Previous Day High Taken
The expected buy-side objective has already been reached.
Now price moves into the New York Lunch period.
A trader sees a small bullish FVG and enters long.
But the trader fails to ask:
What is price still drawing towards?
The original target has already been delivered.
The market may now:
- Consolidate.
- Retrace.
- Rebalance an inefficiency.
- Trade through short-term internal liquidity.
- Prepare a range for the PM session.
This can create poor conditions for traders who continue chasing the AM direction.
Lower Quality Displacement
During a strong New York AM move, displacement can be obvious.
Price aggressively reprices from one liquidity pool towards another.
During lunch, price may become less directional.
The trader may see:
Small Move Higher → Small Move Lower → Small FVG → FVG Failure → Another MSS
This can create repeated false confirmation.
A trader using every Market Structure Shift or Fair Value Gap as an entry signal may become trapped inside short-term consolidation.
Internal Liquidity Can Dominate Price
During the lunch period, price may trade between nearby intraday highs and lows.
For example:
Short-Term High
↓
Lunch Consolidation
↓
Short-Term Low
Price may raid both sides of this small range without beginning a meaningful directional expansion.
The trader buys after sell-side liquidity is taken.
Price moves slightly higher.
Then buy-side liquidity is taken.
Price moves lower again.
This is why a simple liquidity sweep is not enough.
The trader still needs:
Narrative + Draw on Liquidity + Time + Displacement
Poor Risk-to-Reward Conditions
Suppose NQ has already expanded strongly higher during New York AM.
Price is now close to the planned Daily buy-side objective.
During Lunch, a bullish setup appears.
Entry:
Near the top of the morning range.
Target:
Only a small amount of buy-side liquidity remains above.
Stop:
Below the recent protected low.
The trade may have poor risk-to-reward.
The setup may technically contain:
- MSS.
- FVG.
- Displacement.
But the location and remaining liquidity objective are poor.
This is another reason to avoid forcing trades during New York Lunch.
How to Use the New York Lunch Period
The best use of New York Lunch is often analysis and preparation.
Use this period to study what the AM session has already delivered.
Ask the following questions.
What Liquidity Did AM Take?
Mark whether price has taken:
- Overnight High.
- Overnight Low.
- London High.
- London Low.
- Previous Day High.
- Previous Day Low.
- Relative Equal Highs.
- Relative Equal Lows.
This helps determine whether the morning narrative is complete.
Did Price Reach the Higher Timeframe Objective?
Suppose the Daily chart showed a bearish draw towards Previous Day Low.
During New York AM, Previous Day Low is taken.
The trader must recognize:
The planned Daily objective may already be complete.
Do not continue shorting simply because the morning trend was bearish.
The lunch period can be used to determine whether price is now preparing:
- A retracement.
- A reversal.
- A consolidation.
- Another continuation towards a larger liquidity objective.
Study the AM Range
Mark:
AM High
and
AM Low
These levels may become important during the PM session.
The PM session may:
- Raid the AM High.
- Raid the AM Low.
- Continue through one side of the AM range.
- Use the AM range as consolidation before another expansion.
Therefore:
New York AM Creates Information → Lunch Organizes the Information → PM May Deliver the Next Move
Watch for PM Session Preparation
Suppose the Daily bias is bearish.
New York AM delivers lower.
However, the main Daily sell-side liquidity remains untouched.
During Lunch, price slowly retraces into premium.
Price reaches:
- Bearish FVG.
- Bearish Order Block.
- Breaker.
- Premium portion of the AM range.
The trader should not necessarily short immediately during the middle of lunch.
Instead, the trader can use the lunch retracement to prepare for the PM session.
The sequence becomes:
AM Bearish Displacement → Lunch Retracement → Premium PD Array → PM Bearish Confirmation → Continuation Lower
In this situation, Lunch helped create the setup.
The actual execution may occur during the PM session.
Can You Trade the ICT New York Lunch Macro?
Yes.
New York Lunch does not mean trading is completely prohibited.
ICT has specifically discussed the New York Lunch Macro, and in an official NQ example he identified the 11:50–12:10 window while discussing a buy-side liquidity draw, one-minute SMT divergence and inefficiency-based price delivery.
However, this should be distinguished from randomly trading throughout the entire 12:00–13:30 lunch period.
A Lunch Macro setup should still have a clear narrative.
For example:
HTF Bullish Bias
↓
Buy-Side Liquidity Remains Untouched
↓
AM Fails to Complete the Objective
↓
11:50–12:10 Lunch Macro
↓
Sell-Side Liquidity Raid
↓
SMT Divergence
↓
Bullish Displacement
↓
FVG or IFVG Entry
↓
Buy-Side Liquidity Target
The important point is:
The Lunch Macro is not valid simply because the clock reaches 11:50.
There still needs to be a reason for price to deliver.
Example of a New York Lunch Continuation Setup
Suppose NQ has a bullish Daily narrative.
Previous Day High remains untouched.
During New York AM, NQ trades higher but fails to reach Previous Day High.
Price begins retracing before lunch.
During the 11:50–12:10 Lunch Macro:
Short-Term Sell-Side Liquidity Taken → NQ/ES SMT Divergence → Bullish Displacement → Bullish FVG
Price retraces into the bullish FVG.
The remaining draw is Previous Day High.
The trader may consider a bullish continuation model.
Complete narrative:
Daily Bullish Bias → Previous Day High Draw → AM Fails to Complete Objective → Lunch Sell-Side Raid → SMT → Bullish Displacement → FVG → Previous Day High
The most important part is:
The liquidity objective remained unfinished.
The trader is not trading simply because it is lunchtime.
Example of When to Avoid the Lunch Macro
Suppose NQ has a bullish Daily narrative.
During New York AM:
Overnight Low Taken → Bullish MSS → Strong Expansion → Previous Day High Taken → Daily FVG Reached
The planned objective is complete.
During 11:50–12:10:
Price creates a small bullish FVG.
A trader enters long simply because the Lunch Macro is active.
This is a weak narrative.
Ask:
What is the remaining draw on liquidity?
If there is no clear answer, avoid the trade.
The correct decision may be:
AM Objective Complete → No Clear Draw → Avoid Lunch Entry → Observe PM Session
Not trading is also a trading decision.
When to Avoid New York Lunch Trading
Avoid Lunch trading when:
- The AM session has already completed the Daily objective.
- Price is consolidating inside the AM range.
- There is no clear draw on liquidity.
- Price is repeatedly taking short-term internal highs and lows.
- Displacement is weak.
- MSS repeatedly fails.
- Price is in the middle of a range.
- The remaining target offers poor risk-to-reward.
- You are trying to recover an AM trading loss.
- You are entering only because the Lunch Macro has started.
The worst approach is:
Lost During AM → Force Lunch Trade → Lose Again → Force PM Trade
Each session window should be treated independently.
A previous loss does not create a better setup during Lunch.
When the New York Lunch Period Becomes Useful
The New York Lunch period becomes particularly useful when:
- The AM objective remains incomplete.
- Obvious external liquidity remains untouched.
- Lunch creates a retracement into a major PD Array.
- SMT Divergence appears between NQ, ES or YM.
- The 11:50–12:10 Macro aligns with the Daily narrative.
- Lunch establishes a clear range for the PM session.
- Price is preparing to continue the AM directional move.
- A higher timeframe liquidity objective remains open.
The trader should always ask:
Has AM completed the move, or is price preparing for another delivery?
That question helps determine whether New York Lunch should be traded, observed or completely avoided.
Simple New York Lunch Framework
Use this process:
Review New York AM
↓
Mark AM High and AM Low
↓
Identify Liquidity Already Taken
↓
Check Whether Daily Objective Is Complete
↓
Identify Remaining Draw on Liquidity
↓
Observe 11:50–12:10 Lunch Macro
↓
No Clear Narrative → Avoid Trading
or
Clear Narrative + Liquidity Event + SMT/Displacement → Evaluate Setup
↓
Use Lunch Structure to Prepare for 13:30 PM Session
The main rule is simple:
Do not trade New York Lunch because you missed the AM move.
Use Lunch to understand whether the market has completed its morning delivery or is preparing the next phase of the trading day.
7. ICT New York PM Killzone for Index Futures
Time: 13:30–16:00 New York Time
The New York PM Killzone focuses on the later portion of the U.S. trading day.
The NYSE core cash session ends at 16:00 ET.
The PM session may produce:
- Morning trend continuation.
- Afternoon reversal.
- Liquidity raid.
- Delivery into the Daily objective.
- Repricing into the close.
Before trading the PM Killzone, study the AM session.
Ask:
What did AM already accomplish?
Did New York AM:
- Take Previous Day High?
- Take Previous Day Low?
- Reach Daily FVG?
- Reach a major Order Block?
- Complete the expected Daily range?
- Leave obvious liquidity untouched?
PM Continuation Example
Daily bias is bearish.
AM creates bearish displacement.
Price retraces during lunch.
The Daily sell-side objective remains untouched.
During PM:
Retracement into Premium → Bearish PD Array → Displacement Lower → Sell-Side Liquidity
PM Reversal Example
AM produces a large bearish expansion.
Major Daily sell-side liquidity is taken.
Price enters a higher timeframe discount array.
During PM:
Sell-Side Raid → Bullish MSS → Bullish Displacement → FVG
A short-term afternoon reversal may develop.
The mistake is assuming:
PM Killzone = Reversal
It does not.
The trader must first understand what price has already delivered during the AM session.
Best Pair or Instrument for Each ICT Killzone
| ICT Killzone | Preferred Markets |
|---|---|
| Asian | USDJPY, AUDUSD, NZDUSD |
| London | EURUSD, GBPUSD |
| Forex New York | EURUSD, GBPUSD, USDJPY, USDCAD |
| London Close | EURUSD, GBPUSD |
| New York AM Futures | NQ, ES, YM |
| New York PM Futures | NQ, ES, YM |
For a beginner, a simple selection can be:
London Killzone → EURUSD or GBPUSD
New York Forex → EURUSD
New York Index Futures → NQ or ES
Do not select an instrument only because someone says it is the “best pair.”
Backtest the same market during the same Killzone.
A trader studying EURUSD during London for six months will generally understand its session behavior better than a trader changing between ten currency pairs every day.
How to Use ICT Killzones Step by Step
Step 1: Determine Higher Timeframe Bias
Start with:
- Monthly.
- Weekly.
- Daily.
- 4 Hour.
You do not need every timeframe for every trade.
The objective is to answer:
Where should price draw towards?
Identify:
- Buy-Side Liquidity.
- Sell-Side Liquidity.
- FVG.
- Order Block.
- Breaker.
- Previous High.
- Previous Low.
Example:
Daily price is bullish.
Previous Day High remains untouched.
Your higher timeframe narrative may be:
Price is likely to seek buy-side liquidity.
Now move to the intraday chart.
Step 2: Mark Session Liquidity
Before the Killzone begins, mark important levels.
For London:
Asian High + Asian Low
For New York Forex:
London High + London Low
For index futures:
Overnight High + Overnight Low + London High + London Low
Also mark:
Previous Day High + Previous Day Low
Do not fill the chart with twenty random horizontal lines.
Mark liquidity that is directly connected to the current narrative.
Step 3: Wait for the Killzone
This is where patience becomes important.
Do not enter only because price is close to liquidity at 01:15.
If your model is based on the London Killzone, wait for your time window.
The logic is:
Price Level + Time
Not:
Price Level Alone
Step 4: Look for a Liquidity Raid
During the Killzone, observe whether price trades through a meaningful high or low.
Example:
Bullish bias.
Asian Low is taken during London.
This means sell-side liquidity has been raided.
Do not immediately buy.
A liquidity sweep alone is not sufficient confirmation.
Step 5: Wait for Displacement
After the liquidity event, look for aggressive price delivery in the expected direction.
For a bullish setup:
Sell-Side Raid → Strong Bullish Expansion
For a bearish setup:
Buy-Side Raid → Strong Bearish Expansion
The displacement may create:
- Fair Value Gap.
- Market Structure Shift.
- Breaker.
- Rejection Block.
- Order Block narrative.
Displacement helps show that price is moving away from the liquidity event with purpose.
Step 6: Select the Entry PD Array
After displacement, identify the retracement area.
Possible entry arrays include:
- Fair Value Gap.
- Order Block.
- Breaker Block.
- Balanced Price Range.
- Reclaimed Order Block.
Example:
Sell-Side Raid → Bullish MSS → Bullish FVG
Wait for price to retrace into the bullish FVG.
The trader is not chasing the displacement candle.
Step 7: Target Opposing Liquidity
Your target should connect with the original market narrative.
Bullish trade targets may include:
- Asian High.
- London High.
- Previous Day High.
- Equal Highs.
- Higher timeframe buy-side liquidity.
Bearish targets may include:
- Asian Low.
- London Low.
- Previous Day Low.
- Equal Lows.
- Higher timeframe sell-side liquidity.
The complete model becomes:
HTF Bias → Killzone → Liquidity Raid → Displacement → PD Array Entry → Opposing Liquidity
Practical ICT Killzone Trading Example
Suppose the Daily chart of EURUSD is bullish.
The Previous Day High remains untouched.
During Asia, price forms a narrow range.
The Asian High and Asian Low are marked.
London Killzone begins.
Price trades below the Asian Low.
Sell-side liquidity is taken.
On the 5-minute chart, price creates strong bullish displacement.
A bullish FVG forms.
Price retraces into the FVG.
The trader enters long.
Stop is placed according to the trade model below the protected low or invalidation level.
Target is the Asian High first.
The larger objective is the Previous Day High.
The complete sequence:
Daily Bullish Bias → Previous Day High Draw → Asian Range → Asian Low Raid During London → Bullish Displacement → Bullish FVG → Long → Asian High → Previous Day High
This is how ICT Killzones should be used.
The Killzone is only one part of the complete model.
When to Avoid ICT Killzone Trading
Killzones occur every trading day.
High-quality setups do not.
This distinction is extremely important.
Avoid Trading Without a Clear Narrative
Do not trade because:
“It is 02:00, so I need a London trade.”
First determine:
- Bias.
- Draw on liquidity.
- Important PD Array.
- Session liquidity.
No narrative means no trade.
Avoid Entering Only Because Liquidity Was Swept
A sweep is not an automatic entry signal.
Price can take the Asian Low and continue lower.
Wait for:
Liquidity Raid → Displacement → Confirmation
The confirmation model depends on your personal ICT trading model.
Avoid Chasing Large Displacement
Suppose NQ creates a massive bullish candle at 09:30.
Do not enter at the top simply because the candle looks strong.
Price may retrace into:
- FVG.
- Order Block.
- Breaker.
- Discount array.
Wait for a planned entry.
Avoid Trading Directly Into Major Opposing Liquidity
Suppose you want to buy.
Previous Day High is only a few points above the proposed entry.
The potential target is limited.
Your setup may have poor risk-to-reward.
Always identify the draw and opposing liquidity before entering.
Avoid Trading After the Expected Move Is Already Complete
Suppose London has already created a large expansion.
Price reaches the Daily objective.
Previous Day High is taken.
Higher timeframe premium is reached.
Do not force another bullish trade during New York only because a small bullish FVG appears.
Ask:
Has the market already completed the expected delivery?
Avoid Random Killzone Reversals
Do not use this logic:
London Killzone Started → Buy
New York Started → Sell
PM Session Started → Reverse AM
Killzones are not automatic reversal windows.
Time must align with price.
Be Careful Around High-Impact Economic Events
U.S. economic releases can create rapid price movement, widened spreads and difficult execution.
Do not predict the news candle simply because the release falls inside a Killzone.
A more structured approach is:
Know the News Time → Wait for Price Delivery → Observe Liquidity → Wait for Displacement → Evaluate the Setup
The Killzone does not remove event risk.
Avoid Trading During Unusual Market Conditions
Be careful during:
- Major holidays.
- Abnormally thin liquidity.
- Early market closes.
- Unexpected geopolitical events.
- Platform or data-feed problems.
Exchange schedules can change for holidays, so traders should check the relevant market calendar before applying normal session expectations.
Common ICT Killzone Mistakes
The first mistake is trading every Killzone.
A Killzone is a window of opportunity, not a guaranteed signal.
The second mistake is ignoring higher timeframe bias.
A trader sees a liquidity sweep and immediately enters against a strong higher timeframe narrative.
The third mistake is mixing Forex and index timings.
The classic Forex New York Killzone should not be blindly copied onto NQ or ES without considering the New York index-futures AM session and the 09:30 U.S. cash-market open.
The fourth mistake is using Killzones as a standalone strategy.
The time window needs context from:
- Liquidity.
- Market structure.
- PD Arrays.
- Displacement.
- Higher timeframe narrative.
The fifth mistake is watching too many instruments.
A trader monitors:
EURUSD + GBPUSD + USDJPY + XAUUSD + NQ + ES + YM.
When a setup appears, the trader cannot correctly read the narrative.
Focus on one market first.
Simple ICT Killzone Trading Model
A beginner can use this framework:
Step 1 → Determine Daily Bias
↓
Step 2 → Identify Draw on Liquidity
↓
Step 3 → Mark Session High and Low
↓
Step 4 → Wait for the Correct ICT Killzone
↓
Step 5 → Wait for Liquidity Raid
↓
Step 6 → Look for Displacement
↓
Step 7 → Identify MSS and FVG
↓
Step 8 → Wait for Retracement
↓
Step 9 → Enter From the PD Array
↓
Step 10 → Target Opposing Liquidity
For Forex:
Asian Range → London Killzone → New York Killzone → London Close
For index futures:
Overnight Range → London Structure → New York AM → Lunch → New York PM
Final Thoughts
The ICT Killzones concept teaches traders that market analysis should consider both price and time.
A trader should not search for entries throughout the entire 24-hour trading day.
Instead, establish the higher timeframe narrative, identify liquidity and wait for an important session window.
The basic idea is:
Know Where Price May Go → Know When Price May Deliver → Wait for Confirmation
For Forex traders, the London and New York Killzones are particularly important.
For NQ, ES and YM traders, the New York AM and New York PM windows are generally more relevant to the U.S. index-futures narrative.
However, a Killzone alone is never a complete trading strategy.
The higher probability idea appears when:
Higher Timeframe Bias + Draw on Liquidity + Killzone Timing + Liquidity Raid + Displacement + ICT Entry Model
all support the same market narrative.
That is the real importance of ICT Killzones in Inner Circle Trader analysis.


