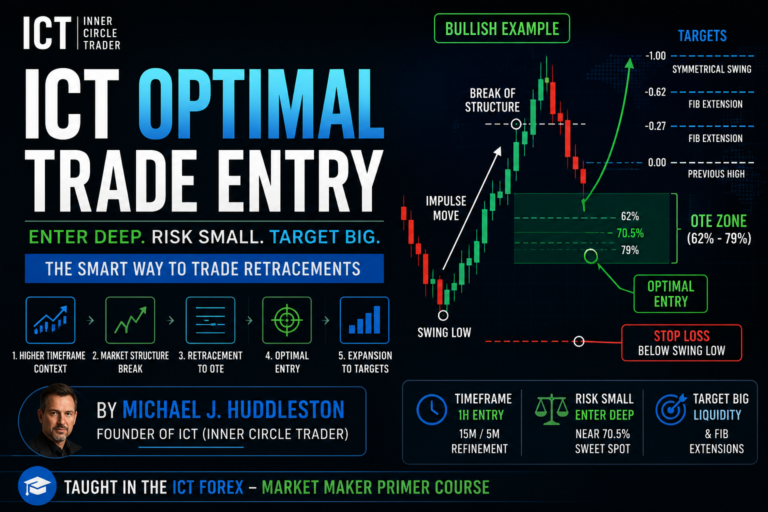
The ICT London Close Killzone is the final major intraday Killzone used to study the development of the Forex daily range. In the ICT Forex – Market Maker Primer Course, Michael J. Huddleston, founder of the ICT (Inner Circle Trader) concepts, teaches that London Close can help traders anticipate the completion of a daily high or low, a short-term retracement, or a continuation pattern into the New York afternoon.
Unlike the London Open and New York Open, London Close setups are generally short-term in nature.
Michael J. Huddleston explains:
“The key times to monitor are 10 a.m. to noon New York time.”
The trader is not normally looking for another large London-style expansion. Instead, the focus is on understanding where the market is within the completed daily range and whether price is preparing to retrace, continue, or establish an important reversal point.
What Is The ICT London Close Killzone?
The ICT London Close Killzone is a specific time window between:
10:00–12:00 New York time
ICT studies this period because the market may be approaching the opposite end of the daily range after price has already moved through the Asian, London, and New York sessions.
For example, on a bullish trading day:
Asian, London, and New York price action may progressively move higher.
By London Close, the market may create or approach the High of the Day.
On a bearish trading day:
Price may progressively decline.
During London Close, the market may create or approach the Low of the Day.
The basic framework is:
Daily directional movement
↓
London and New York expansion
↓
10:00–12:00 New York time
↓
Potential daily extreme
↓
Short-term retracement or continuation
London Close helps complete the intraday price delivery narrative.
ICT London Close Killzone Time Window
The exact Killzone taught in this concept is:
10:00–12:00 New York time
This is the ICT London Close Killzone.
Traders should always use New York time as the primary reference.
The daily session sequence can be viewed as:
Asian Session
↓
London Open
↓
New York Open
↓
London Close Killzone: 10:00–12:00 NY time
By the time London Close arrives, a significant portion of the daily range may already have formed.
This is why traders must study what price has done earlier in the day before attempting a London Close entry.
Why Is The ICT London Close Killzone Important?
The London Close can mark an important stage in the development of the daily candle.
Price has already had several opportunities to establish directional movement.
The trader can study:
- Asian Session price action
- London High and Low
- New York price delivery
- High of the Day
- Low of the Day
- Daily directional expansion
- Existing liquidity pools
The London Close may then provide one of three broad scenarios:
Completion of the daily extreme
Short-term retracement from the daily extreme
Continuation into the New York afternoon
Huddleston describes the London Close as a time that can form the opposite end of the daily range.
The trader is therefore studying how the day’s price movement may be completing.
Key Characteristics of The ICT London Close Killzone
The ICT London Close Killzone has several characteristics that separate it from the London Open and New York Open. Understanding these characteristics can help traders avoid expecting a large move when the market has already delivered most of its daily range.
1. The London Close Often Forms the Opposite End of the Daily Range
One of the most important characteristics of London Close is its relationship with the daily high and low.
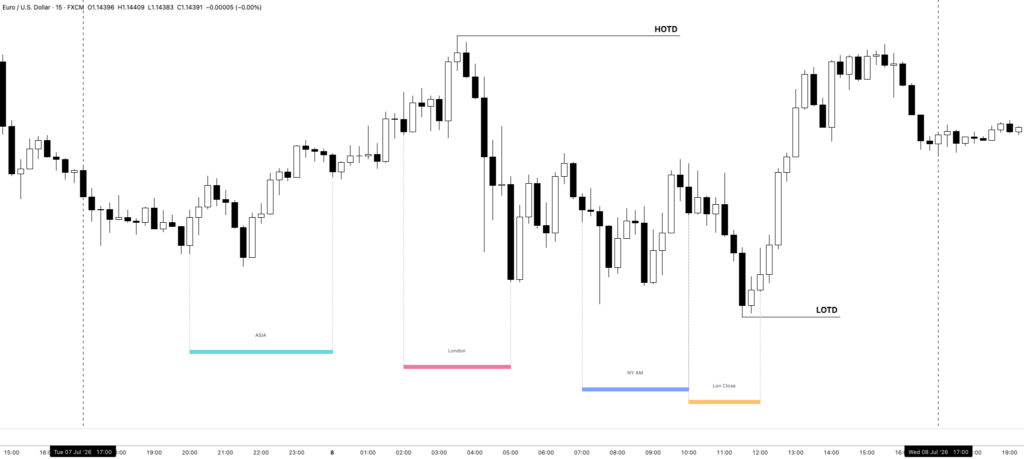
If the market has been bullish throughout the trading day, London Close may establish the High of the Day.
If the market has been bearish, London Close may establish the Low of the Day.
The general expectation is:
Bullish Daily Range → London Close may form the High of the Day
Bearish Daily Range → London Close may form the Low of the Day
This helps traders understand where price may be approaching exhaustion within the intraday move.
2. The London Close Can Produce a Retracement From the Daily Extreme
Price action around London Close may retrace away from the High or Low of the Day.
On a bullish day:
High of the Day forms → London Close retracement lower
On a bearish day:
Low of the Day forms → London Close retracement higher
Huddleston explains:
“Price action seen at London Close typically sees a retracement off the high of the day on bullish days and off the low of the day on bearish days.”
This retracement is generally short-term.
Traders should not automatically expect a complete daily reversal.
3. London Close Setups Are Usually Short-Term
London Close trading is different from the London Open.
The London Open can provide significant directional expansion.
The New York Open may continue the Daily Bias and create another meaningful move.
The London Close setup is typically much smaller.
Huddleston describes expected movements of approximately:
10 pips
15 pips
or occasionally:
20 pips
A move beyond approximately 20 pips is less common within the specific short-term London Close scalp model.
The trader should manage expectations accordingly.
4. The 5-Minute Chart Is Important for London Close Setups
ICT specifically focuses on the 5-minute timeframe when studying London Close entries.
Huddleston explains:
“Whenever we’re studying the London Close you have to be looking at it from a 5-minute.”
The reason is simple.
London Close setups are short-term and require greater price detail.
A higher timeframe may hide the precise retracement needed to identify an entry.
The framework is:
Understand daily price delivery
↓
Wait for 10:00–12:00 NY time
↓
Move to the 5-minute chart
↓
Study the short-term price swing
↓
Look for an ICT entry model
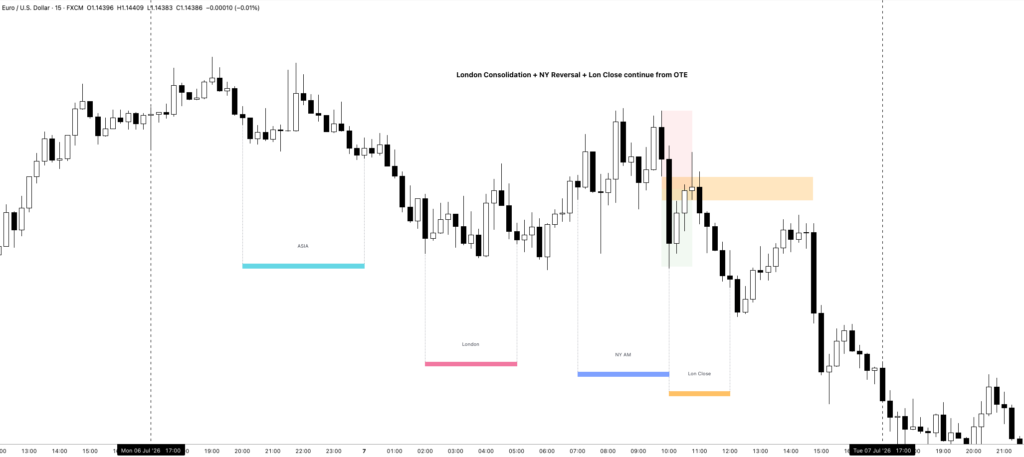
5. A 5-Minute ICT Optimal Trade Entry Can Form
The London Close frequently presents a short-term ICT Optimal Trade Entry or OTE.
For example, suppose price has created the Low of the Day during the London Close.
Price begins moving higher.
The trader identifies the relevant short-term price swing.
Price retraces into the 5-minute OTE area.
The sequence becomes:
Low of the Day
↓
Initial bullish movement
↓
5-minute retracement
↓
Bullish OTE
↓
10–20 pip scalp opportunity
The bearish model works in reverse.
OTE should be used within the existing daily range narrative.
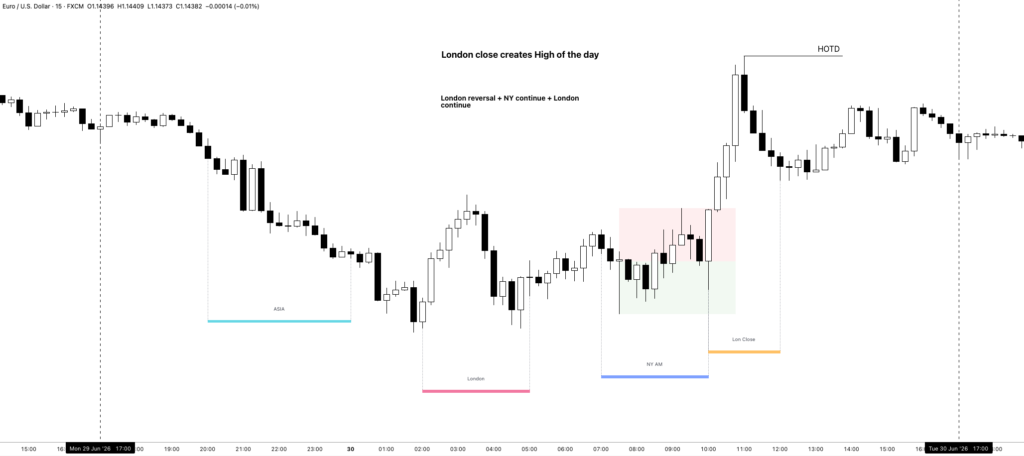
6. The London Close Can Create a Continuation Pattern
The London Close does not always create the final daily extreme and reverse.
Sometimes it acts as a continuation point.
Suppose the market has been bullish throughout the day.
Price trades higher and then consolidates.
Inside the London Close Killzone, a bullish 5-minute OTE develops.
Price may continue higher into the New York afternoon.
The structure becomes:
Bullish Daily Bias
↓
Bullish London and New York price delivery
↓
London Close consolidation
↓
5-minute bullish OTE
↓
Continuation higher
Huddleston explains that the London Close can create continuation points for swings that trade into the New York afternoon hours.
7. The Direction of the Day or Week Can Sometimes Change at London Close
In some situations, London Close can become more than a short-term scalp window.
It may establish an important reversal point.
Suppose price reaches a clear liquidity pool during the London Close.
For example:
Double Top
↓
Buy-side liquidity above price
↓
London Close reaches the liquidity pool
↓
High of the Day forms
↓
Price reverses
↓
Bearish movement continues into the following trading period
In this situation, London Close may create an important high or low that influences price beyond the current day.
However, traders should not assume every London Close is a major reversal.
The larger market structure must support the idea.
8. London and New York Price Action Provide the Context
The London Close cannot be properly studied in isolation.
Before 10:00 New York time, ask:
What did London do?
What did New York do?
If London and New York have both traded bullishly, London Close may be expected to create the High of the Day or a bullish continuation setup.
If London and New York have both traded bearishly, London Close may be expected to create the Low of the Day or a bearish continuation setup.
The simplified model is:
London bullish + New York bullish → Study London Close for a high or continuation
London bearish + New York bearish → Study London Close for a low or continuation
The previous sessions create the storyline.
London Close completes or extends it.
9. Major US Dollar Pairs Are Important During London Close
Michael J. Huddleston highlights major currency pairs coupled with the US Dollar as suitable markets for studying London Close.
Examples include:
- EUR/USD
- GBP/USD
- AUD/USD
- NZD/USD
- USD/CAD
- USD/JPY
- USD/CHF
Traders should focus on liquid major Forex pairs rather than attempting to monitor every currency pair.
The objective is to identify a market that has already demonstrated clear intraday price delivery.
10. London Close Helps Complete the ICT Daily Range Model
The London Close is the final Killzone discussed in the intraday session sequence.
ICT studies:
Asian Session
↓
London Open
↓
New York Open
↓
London Close
Together, these sessions help traders study how the four reference points of a daily candle form:
Open
High
Low
Close
Huddleston describes this framework as understanding the “DNA” of the daily candle.
London Close may help explain where the final high or low forms and how price begins moving toward the Daily Close.
The ICT London Close Killzone on Bullish Days
Suppose the Daily Bias is bullish.
Price may begin the trading day with consolidation.
The Asian Session may form an important low.
London begins moving higher.
New York continues the bullish expansion.
As price enters the London Close Killzone, it may approach the High of the Day.
The model becomes:
Daily Bias bullish
↓
Asian or London Low forms
↓
London expands higher
↓
New York continues higher
↓
10:00–12:00 NY time
↓
High of the Day forms
↓
Short-term retracement lower
The London Close trader may study the retracement.
However, remember that this is generally a short-term trade.
The objective is not necessarily to capture a complete bearish reversal.
The ICT London Close Killzone on Bearish Days
The bearish model is reversed.
Suppose the Daily Bias is bearish.
London establishes a high.
Price moves lower.
New York continues the decline.
During London Close, the Low of the Day may form.
The sequence becomes:
Daily Bias bearish
↓
London High forms
↓
Price expands lower
↓
New York continues bearish
↓
London Close Killzone
↓
Low of the Day forms
↓
Short-term retracement higher
A bullish 5-minute OTE may sometimes develop after the Low of the Day forms.
This can provide a small countertrend scalp.
Again, the trader should remember that the setup is short-term in nature.
London Close Retracement vs Daily Reversal
One of the biggest mistakes traders can make is confusing a London Close retracement with a complete reversal in Daily Bias.
Suppose price has been bullish all day.
The High of the Day forms during London Close.
Price declines 15 pips.
This does not automatically mean the market has become bearish.
The movement may simply be:
Profit taking
Short-term retracement
Movement away from the daily extreme
The trader must separate:
Short-term London Close reaction
from
Higher timeframe directional reversal
The timeframe and trade objective matter.
A London Close scalp may be correct even if the larger Daily Bias remains bullish.
The 10–20 Pip London Close Scalp
Huddleston teaches that London Close may produce approximately 10 to 20 pips for a scalp.
The trader should not expect the same magnitude offered by London Open.
A simple bearish retracement model is:
Bullish daily expansion
↓
High of the Day forms during 10:00–12:00
↓
5-minute bearish setup
↓
Short-term retracement
↓
10–20 pip objective
A bullish retracement model is:
Bearish daily expansion
↓
Low of the Day forms during 10:00–12:00
↓
5-minute bullish setup
↓
Short-term retracement
↓
10–20 pip objective
Huddleston states:
“They’re very, very short-term in nature.”
This should guide both profit expectations and trade management.
Using the 5-Minute OTE During London Close
The ICT Optimal Trade Entry is one of the main entry models discussed for London Close.
Suppose the market has been bearish.
The Low of the Day forms between 10:00 and 12:00.
Price begins moving higher.
The trader identifies the short-term 5-minute price swing.
Price retraces.
A bullish OTE forms.
The trader may study the setup for a short-term long.
The process is:
Identify daily price delivery
↓
Wait for the daily extreme
↓
Use the 5-minute chart
↓
Identify the short-term price swing
↓
Wait for OTE
↓
Enter with a short-term objective
The setup should be managed as a scalp unless a larger continuation narrative is present.
London Close Continuation Into New York Afternoon
Sometimes price does not reverse from the daily extreme.
Instead, London Close creates a new continuation point.
Suppose price is strongly bullish.
London trades bullishly.
New York also trades bullishly.
Price consolidates during London Close.
A bullish OTE forms on the 5-minute chart.
The market may then continue higher into the afternoon.
The process becomes:
Strong bullish daily direction
↓
London confirms
↓
New York confirms
↓
London Close consolidation
↓
Bullish 5-minute OTE
↓
Continuation into New York afternoon
The same model can appear in bearish conditions.
Therefore, traders should not automatically fade the daily move during London Close.
Study the existing price direction first.
London Close and Liquidity Pools
Liquidity can help identify a possible London Close reversal point.
Suppose price has been bullish.
A double top forms near an important price level.
Buy-side liquidity rests above the equal highs.
During London Close:
Price reaches equal highs
↓
Buy-side liquidity is taken
↓
High of the Day forms
↓
Price begins moving lower
This may become a short-term reversal or, in some cases, a more important change in directional price delivery.
The trader must study the surrounding market structure.
The presence of liquidity gives price a reason to reach a specific level.
The London Close time window helps identify when the reaction may occur.
The ICT London Close Killzone and Power of Three
The London Close completes the broader ICT study of the daily range.
A daily candle contains four reference points:
Open
High
Low
Close
Inside these price points, ICT studies:
Accumulation
↓
Manipulation
↓
Distribution
This is the Power of Three framework.
For example, on a bullish day:
Accumulation → Early consolidation
↓
Manipulation → Price moves lower and creates the daily low
↓
Distribution → Price expands higher
↓
London Close → High of the Day or final continuation
For a bearish day:
Accumulation → Early consolidation
↓
Manipulation → Price moves higher and creates the daily high
↓
Distribution → Price expands lower
↓
London Close → Low of the Day or final continuation
The London Close helps traders understand the final stage of daily price delivery.
When The ICT London Close Killzone May Be Less Effective
Huddleston explains that this framework may be less useful during certain types of trading days.
Z Day
Price may move up and down inside a quiet consolidation.
There is no meaningful directional expansion.
The expected daily range profile may not develop clearly.
Seek and Destroy Day
Price may become highly choppy.
The market repeatedly moves above and below short-term highs and lows.
Stops are taken on both sides.
A clearer directional move may not appear until later in the day.
During these conditions, a setup that appears valid may fail to produce the expected move.
The trader must accept that no time-based model works perfectly every day.
A Simple ICT London Close Killzone Trading Framework
Use this process to study The ICT London Close Killzone:
Step 1: Determine the Daily Bias
Bullish or bearish
↓
Step 2: Study the Asian Session
Identify the early daily range
↓
Step 3: Study London
Did London create a High or Low of the Day?
↓
Step 4: Study New York
Did New York continue the daily direction?
↓
Step 5: Mark the current High and Low of the Day
Know which end of the range price is approaching
↓
Step 6: Wait for 10:00 New York time
The London Close Killzone begins
↓
Step 7: Use the 5-minute chart
Look for the detailed short-term structure
↓
Step 8: Determine the expected scenario
Daily extreme → Retracement
or
Consolidation → Continuation
↓
Step 9: Look for an ICT entry setup
5-minute OTE or another contextual setup
↓
Step 10: Keep the objective realistic
Approximately 10–20 pips for the short-term scalp model
When to Avoid The ICT London Close Killzone
Avoid forcing a London Close trade when:
- The Daily Bias is unclear
- Price is inside a quiet Z Day
- The session is showing Seek and Destroy behavior
- No clear High or Low of the Day can be identified
- The daily range narrative is unclear
- No valid 5-minute setup forms
- You are expecting a London Open-sized movement
- The 10–20 pip range is not realistically available
- Price has already moved significantly away from the entry
- You are entering simply because it is between 10:00 and 12:00
Remember:
London Close Killzone = Time to study price
It does not mean:
London Close Killzone = Automatic trade
Final Thoughts on The ICT London Close Killzone
The ICT London Close Killzone, taught by Michael J. Huddleston in the ICT Forex – Market Maker Primer Course, focuses on the time between:
10:00–12:00 New York time
The London Close often occurs near the completion of the daily range.
On bullish days, traders may see the High of the Day form before a short-term retracement.
On bearish days, the Low of the Day may form before price retraces higher.
A simple model is:
Daily directional move
↓
London and New York expansion
↓
10:00–12:00 London Close Killzone
↓
High or Low of the Day
↓
5-minute OTE
↓
10–20 pip short-term scalp
However, London Close can also create a continuation setup that extends into the New York afternoon. In some cases, an important liquidity pool reached during London Close may establish a reversal point that influences the rest of the day or the following trading day.
The key is to study the complete daily price narrative.
As Huddleston teaches, the Asian Session, London Open, New York Open, and London Close together provide a framework for understanding how the Open, High, Low, and Close of the daily candle are engineered.
Do not study London Close as an isolated two-hour window.
Study where price has already been, which end of the daily range is being reached, and whether the 5-minute chart offers a short-term retracement or continuation setup that fits the ICT price delivery model.