Projecting Daily Highs & Lows is an advanced part of the ICT day trading model developed by Michael J. Huddleston, the founder of ICT (Inner Circle Trader). This concept is taught in the 2017 ICT Private Mentorship Core Content Month 08.
The purpose of this model is to estimate where the daily high or daily low may form by combining the Central Bank Dealers Range, standard-deviation projections, PD Arrays, directional bias, and time of day.
It is not a mechanical indicator that should be applied every day. It works best when several elements of time and price support the same market narrative.
“The precision really is on the entry side of the low on the buy days and the high on the sell days.”
— Michael J. Huddleston
What Does Projecting Daily Highs & Lows Mean?
Projecting Daily Highs & Lows means estimating the price area where the market may complete its daily expansion.
On a bearish day, traders attempt to identify:
- Where the daily high may form
- How far price may decline afterward
- Where the daily low may be reached
On a bullish day, traders attempt to identify:
- Where the daily low may form
- How far price may rally afterward
- Where the daily high may be reached
The projection is developed from a specific overnight range known as the Central Bank Dealers Range.
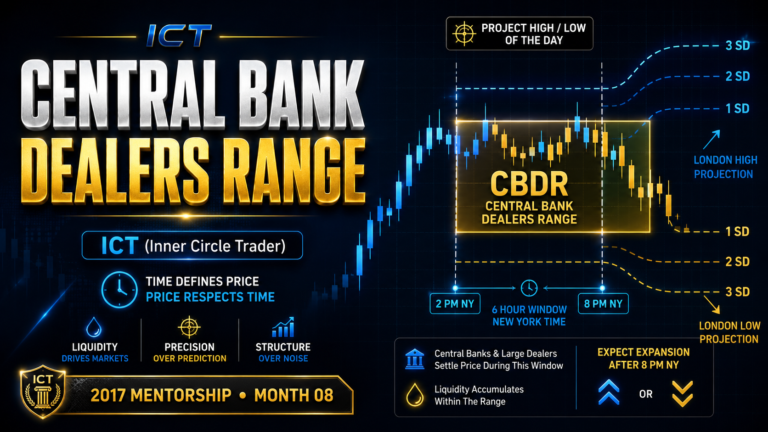
Central Bank Dealers Range
The Central Bank Dealers Range is measured from:
- 14:00 New York time
- To 20:00 New York time
This range represents an important institutional reference for the following trading day.
To calculate it, mark the highest and lowest prices formed between 14:00 and 20:00 New York time.
Michael J. Huddleston generally begins with the candle bodies:
- Highest open or close
- Lowest open or close
He also studies the full wick-to-wick range as a secondary measurement.
The body-based range is usually the first reference used for projections.
Ideal Size of the Central Bank Dealers Range
The size of the Central Bank Dealers Range determines whether the projection model is suitable.
The preferred range is:
- 20 to 30 pips
The range should generally remain:
- Below 40 pips
When the range is greater than 40 pips, the trader should normally avoid using it for standard-deviation projections.
An excessively wide range can interfere with the normal synchronization of the London session and reduce the reliability of the projected levels.
Therefore, this is not a setup that appears every trading day.
Standard-Deviation Projections
Once the Central Bank Dealers Range has been measured, that same range can be projected above and below its boundaries.
The projections may be marked as:
- One standard deviation
- Two standard deviations
- Three standard deviations
- In rare cases, four standard deviations
These levels are not calculated with Fibonacci extensions.
The measured Central Bank Dealers Range itself becomes the projection unit.
For example, if the Central Bank Dealers Range is 25 pips, each projected standard-deviation block will also measure 25 pips.
The Protractionary Move
Before the main directional move begins, price often moves temporarily in the opposite direction.
ICT refers to this as the protractionary state.
It is closely related to the Judas Swing.
On a bearish day:
- Price may first move higher
- Buy-side liquidity may be taken
- Price may reach a premium PD Array
- The daily high may form
- Price may then expand lower
On a bullish day:
- Price may first move lower
- Sell-side liquidity may be taken
- Price may reach a discount PD Array
- The daily low may form
- Price may then expand higher
The number of standard deviations used in this initial move becomes important when projecting the opposing side of the daily range.
Projecting the Daily Low on a Bearish Day
Suppose the market is expected to have a bearish daily profile.
Price may rally above the Central Bank Dealers Range during London and form the daily high.
If the high forms two standard deviations above the range, the total projection unit includes:
- The Central Bank Dealers Range
- First standard deviation
- Second standard deviation
This combined measurement can then be projected downward from the lower boundary of the Central Bank Dealers Range.
The projection may identify potential areas for the daily low.
The trader should then compare these levels with:
- Bullish Order Blocks
- Fair Value Gaps
- Rejection Blocks
- Old lows
- Sell-side liquidity
- Discount PD Arrays
- London Close timing
The standard-deviation level provides the projected distance, but the PD Array determines where price is most likely to react.
Projecting the Daily High on a Bullish Day
On a bullish day, price may first decline below the Central Bank Dealers Range.
If the market forms the daily low one or two standard deviations below the range, that measured movement can be projected upward.
The projected levels may indicate where the daily high could form.
The trader should look for alignment with:
- Bearish Order Blocks
- Fair Value Gaps
- Previous highs
- Buy-side liquidity
- Premium PD Arrays
- Daily or weekly reference levels
- New York or London Close timing
The target should not be selected from the projection alone.
The strongest objective is usually where a projected standard-deviation level overlaps with a logical PD Array.
Why PD Arrays Are Important
Standard-deviation projections do not control price by themselves.
They help traders locate potential areas where institutional price delivery may complete.
A projected level becomes more meaningful when it aligns with a PD Array.
Examples include:
- Order Block
- Fair Value Gap
- Breaker Block
- Rejection Block
- Liquidity Void
- Previous high or low
- Premium or discount zone
If a projected level is located inside a Fair Value Gap or near an Order Block, that overlapping area may become a strong objective.
Michael J. Huddleston emphasizes that the PD Arrays “call the shot.” The projections help traders anticipate where those reactions may occur.
The Role of Directional Bias
The Central Bank Dealers Range should never be used without a directional bias.
Before projecting the daily high or low, determine whether the market is likely to trade higher or lower.
Directional bias may be developed from:
- Higher-timeframe market structure
- Institutional order flow
- Daily and weekly PD Arrays
- Premium and discount
- Draw on liquidity
- Interest-rate or intermarket analysis
- Previous daily or weekly highs and lows
For example, if price is trading inside a daily premium and approaching a bearish Order Block, the market may be more likely to form a high and expand lower.
If price is trading inside a daily discount and reacting from a bullish Order Block, the market may be more likely to form a low and expand higher.
Without this directional framework, the trader may project levels in both directions and create unnecessary confusion.
One, Two, and Three Standard Deviations
Most high-probability daily highs and lows form within one to three standard deviations.
One Standard Deviation
A one-standard-deviation move may occur when:
- The manipulation is shallow
- Price quickly reaches a nearby PD Array
- The market already has strong directional momentum
- Liquidity is positioned close to the range
Two Standard Deviations
Two standard deviations are commonly used as a general expectation.
This is often enough to reach:
- A Fair Value Gap
- An Order Block
- A previous high or low
- A liquidity pool
- A premium or discount objective
Three Standard Deviations
Three standard deviations may occur during a larger daily expansion.
However, traders should not automatically expect price to reach the third projection.
Time of day, available liquidity, average daily range, and nearby PD Arrays must support the extended move.
The Role of Time of Day
Price projections become more useful when combined with ICT time windows.
Important periods include:
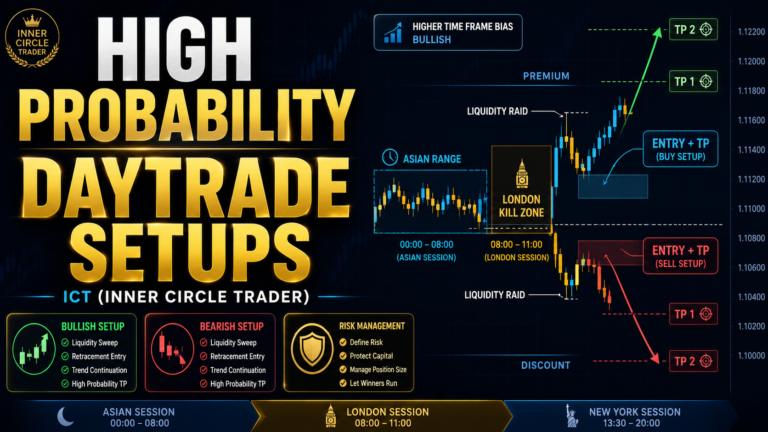
- London Kill Zone
- New York Kill Zone
- London Close Kill Zone
- 14:00 New York time
The daily high or low frequently forms during London or New York.
If the market continues trending beyond the London Close Kill Zone, the move may continue toward 14:00 New York time.
Michael J. Huddleston explains that even on a long trending day, the market will often establish or complete the daily extreme by approximately 14:00.
Time helps the trader determine whether there is still enough of the trading day remaining for another standard-deviation objective to be reached.
London Close and Daily Range Completion
The ICT London Close Kill Zone runs from:
- 10:00 to 12:00 New York time
This is an important period for taking profits.
By London Close, price may have already delivered:
- Two standard deviations
- A Fair Value Gap fill
- A major liquidity objective
- A higher-timeframe PD Array
- Most of the expected daily range
Even when another projected level remains available, the trader should consider taking partial or full profits if the market has reached a logical target during London Close.
The objective is not to capture every pip of the daily range.
Using Average Daily Range
Average Daily Range provides additional context.
A currency pair may average approximately 100 pips per day, although this will vary between markets and changing volatility conditions.
If price has already completed most of its average daily range, a distant projection becomes less likely.
The trader should consider:
- How much price has already moved
- How much range remains
- Whether the target is realistic
- Whether time remains for delivery
- Whether a major PD Array has already been reached
Standard-deviation projections should remain consistent with the expected daily range.
Fair Value Gaps as Daily Targets
Fair Value Gaps can provide clear objectives for projected highs and lows.
Suppose a bullish projection extends into an old Fair Value Gap.
Price may rally into the imbalance, close part or all of it, and then form the daily high.
Similarly, a bearish projection may align with a bullish Fair Value Gap or Order Block below the market.
When a projected level, Fair Value Gap, and time window overlap, the area becomes more significant.
The trader can use this confluence to:
- Take partial profits
- Close the position
- Reduce risk
- Watch for reversal confirmation
Accuracy of Daily High and Low Projections
The projected level will not always identify the exact pip.
Price may:
- Reach the level exactly
- Stop one or two pips short
- Trade slightly through the level
- Reverse from a nearby PD Array
- Fail to reach the level before the session ends
A target that misses the exact high or low by a few pips may still be considered highly accurate.
Traders should not hold a profitable position simply because price has not touched the exact projected price.
The purpose is to identify a high-probability area, not to demand perfect precision every day.
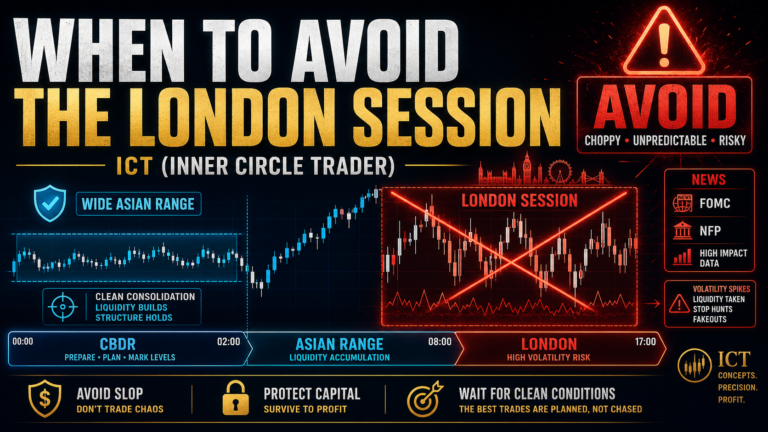
When Not to Use the Model
Avoid using Projecting Daily Highs & Lows when:
- The Central Bank Dealers Range exceeds 40 pips
- There is no clear directional bias
- Price is not near a meaningful PD Array
- Higher-timeframe structure is unclear
- The market has already completed its daily range
- The projection conflicts with a major liquidity objective
- The setup occurs outside useful trading hours
- Price action is highly erratic or news-driven
- The trader is forcing a setup
The model is designed to filter trading opportunities, not create a reason to trade every day.
Common Mistakes
Applying It Every Day
Not every Central Bank Dealers Range is suitable.
The range must be properly sized and supported by directional bias.
Ignoring PD Arrays
A standard-deviation level without a PD Array is only a mathematical projection.
The most useful levels contain time and price confluence.
Projecting in Both Directions
The trader should first establish whether the day is expected to be bullish or bearish.
Projecting both sides without bias can lead to poor decisions.
Chasing the Exact Pip
The market may miss a projected target by a small amount.
Take profits around logical areas instead of demanding perfect delivery.
Ignoring Time
A target may be technically available but unlikely to be reached late in the day.
Always consider London Close and the 14:00 New York reference.
Ignoring the Central Bank Range Size
A range wider than 40 pips should generally not be used for this model.
This is one of the most important filters.
Step-by-Step Process
Step 1: Determine the Higher-Timeframe Bias
Decide whether the market is more likely to trade higher or lower.
Step 2: Mark the Central Bank Dealers Range
Measure price between 14:00 and 20:00 New York time.
Step 3: Check the Range Size
Prefer a range between 20 and 30 pips.
Avoid the setup if the range exceeds 40 pips.
Step 4: Mark Standard Deviations
Project the measured range above and below its boundaries.
Step 5: Identify the Protractionary Move
Watch for price to move against the expected daily direction during London or New York.
Step 6: Locate the Daily High or Low Setup
Look for a liquidity sweep and reaction from a premium or discount PD Array.
Step 7: Measure the Protractionary Range
Determine how many standard deviations were used to form the initial daily extreme.
Step 8: Project the Opposing Daily Objective
Use that total measurement to estimate the daily high or low.
Step 9: Compare the Projection With PD Arrays
Look for Order Blocks, Fair Value Gaps, liquidity, or previous highs and lows.
Step 10: Consider Time and Daily Range
Take profits when price reaches a logical target during New York or London Close.
Projecting Daily Highs & Lows Checklist
Before using the model, confirm:
- Is the chart set to New York time?
- Have I marked 14:00 to 20:00 correctly?
- Is the Central Bank Dealers Range below 40 pips?
- Is the range close to the ideal 20-to-30-pip size?
- Do I have a clear bullish or bearish bias?
- Is price trading in premium or discount?
- Is there a valid higher-timeframe PD Array?
- Did price make a protractionary move?
- How many standard deviations were used?
- Does the projected target align with liquidity?
- Does the target overlap a Fair Value Gap or Order Block?
- Has price already completed most of its daily range?
- Is the market approaching London Close?
- Is the target realistic for the remaining time of day?
Final Thoughts
Projecting Daily Highs & Lows gives ICT traders a structured way to estimate where the daily range may terminate.
The Central Bank Dealers Range provides the measurement. Standard deviations provide the projected distance. Directional bias identifies the likely side of expansion. PD Arrays explain why price may react at a specific level. Time of day indicates when the move may complete.
The strongest setup forms when all of these elements agree.
This model should not be treated as a standalone indicator or used every trading day. It is a precision tool that works best when the Central Bank Dealers Range is properly sized, the higher-timeframe bias is clear, and the projected objective aligns with institutional price delivery.
The goal is not to predict every daily high and low perfectly. The goal is to identify high-probability price areas where the market is likely to complete its daily objective.