The Central Bank Dealers Range is an ICT day trading concept taught by Michael J. Huddleston, the founder of ICT (Inner Circle Trader), in the 2017 ICT Private Mentorship Core Content Month 08.
It is used to estimate where the high or low of the trading day may form, especially during the London session.
The concept combines a specific time-based price range with standard deviation projections. When used with directional bias, PD Arrays, institutional order flow and the daily profile, it can help a trader anticipate the likely area where price may reverse.
What Is the Central Bank Dealers Range?
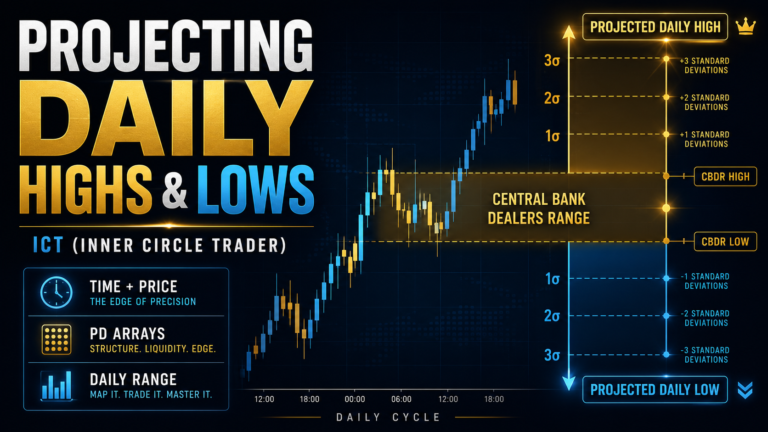
The Central Bank Dealers Range is the price range formed between:
- 14:00 New York time
- 20:00 New York time
The trader marks the highest price and the lowest price formed during this six-hour period.
The distance between these two levels becomes the Central Bank Dealers Range.
This range is then projected above and below its original location in equal measurements. These repeated measurements are called standard deviations.
The purpose is not simply to draw a range on the chart. Its primary purpose is to estimate where price may form the daily high on a bearish day or the daily low on a bullish day.
Why the Central Bank Dealers Range Matters
One of the most difficult parts of day trading is identifying where the daily high or low may form.
A bullish directional bias tells the trader to look for a buying opportunity, but it does not automatically reveal how far price may decline before expanding higher.
A bearish directional bias tells the trader to look for a selling opportunity, but it does not automatically reveal how high price may rally before reversing.
The Central Bank Dealers Range provides a projected price framework for answering that question.
Michael J. Huddleston explains that its main purpose is:
“To help you find the high or low of the day.”
When the broader market context is bullish, the trader can use downward standard deviations to estimate the possible London low.
When the broader context is bearish, upward standard deviations can help estimate the possible London high.
Ideal Size of the Central Bank Dealers Range
The size of the range is extremely important.
The total range from high to low should ideally be:
- 20 to 30 pips
- Less than 40 pips
A range larger than 30 pips becomes less favourable for accurate projections.
When the range exceeds 40 pips, it is generally unsuitable for this day trading model.
A very large Central Bank Dealers Range may produce projections that are too wide to be practical. It may also indicate that price has already delivered too much volatility before the main London setup develops.
Michael J. Huddleston states:
“The ideal range is less than 40 pips, preferably the range should be no more than 20 to 30 pips.”
This does not mean every range between 20 and 30 pips will produce a valid trade. Directional bias and higher-timeframe context are still required.
Why 20 to 30 Pips Is Preferred
The preferred range is connected to the expected daily range.
For example, suppose a currency pair normally moves around 100 pips per day. One-third of that range is approximately 33 pips.
In a bullish Power of Three profile, price may open, decline approximately 20 to 30 pips, form the low of the day and then expand higher.
In a bearish profile, price may open, rally approximately 20 to 30 pips, form the high of the day and then expand lower.
This is why a Central Bank Dealers Range of approximately 20 to 30 pips often provides practical standard deviation projections.
How to Draw the Central Bank Dealers Range
First, ensure that your chart is correctly aligned with New York time.
Your broker’s platform may display a different time zone, so you must convert:
- 14:00 New York time
- 20:00 New York time
Mark both times with vertical lines.
Next, identify the highest and lowest price between those two times.
You can calculate the range in two ways:
- Using the highest wick and lowest wick
- Using the highest candle body and lowest candle body
The distance between the selected high and low becomes the Central Bank Dealers Range.
Candle Bodies or Wicks?
Both methods can be studied, but Michael J. Huddleston generally prefers using candle bodies.
Broker spreads can cause differences in wick highs and lows. One broker may display a slightly higher wick or lower wick than another.
Candle bodies often provide a clearer view of where the majority of trading activity occurred.
Michael J. Huddleston explains:
“If we focus primarily on the bodies of the candles, we’re going to get more closer to what smart money is doing.”
This does not mean traders should completely ignore wicks.
Wicks can still show useful information about volatility, stop runs and rejection. However, candle bodies may provide more consistent measurements when defining the Central Bank Dealers Range.
A practical trader can calculate the body-based range first, then check whether the wick-based range creates a meaningful difference.
Understanding Standard Deviations
Once the Central Bank Dealers Range is identified, its total pip size is duplicated above and below the range.
Suppose the range is 20 pips.
The projections would be:
- One standard deviation above the range high is 20 pips higher.
- Two standard deviations above are another 20 pips higher.
- Three standard deviations above are another 20 pips higher.
- One standard deviation below the range low is 20 pips lower.
- Two standard deviations below are another 20 pips lower.
- Three standard deviations below are another 20 pips lower.
The same range measurement is continuously repeated.
The Central Bank Dealers Range acts as the original reference point, while the standard deviations provide possible expansion and reversal zones.
Standard Deviations on Sell Days
On a bearish day, the trader expects price to form the high of the day before expanding lower.
The projected high may form:
- Inside the Central Bank Dealers Range
- At one standard deviation above
- At two standard deviations above
- At three standard deviations above
Most bearish days create the daily high somewhere between the range itself and the third standard deviation above it.
The ideal bearish condition often forms the high at:
- One standard deviation above
- Two standard deviations above
Michael J. Huddleston explains:
“Ideally sell days create the high of a day no more than two standard deviations above the Central Bank Dealers Range.”
The trader should not automatically sell simply because price reaches one of these levels.
The projection should overlap with:
- A premium PD Array
- Buy-side liquidity
- A Fair Value Gap
- A bearish Order Block
- A rejection area
- A London Kill Zone setup
- Bearish higher-timeframe institutional order flow
The standard deviation acts as a projected location. It is not an entry signal by itself.
Standard Deviations on Buy Days
On a bullish day, the trader expects price to form the low of the day before expanding higher.
The projected low may form:
- Inside the Central Bank Dealers Range
- At one standard deviation below
- At two standard deviations below
- At three standard deviations below
Most bullish days form their low between the range itself and the third standard deviation below it.
The ideal bullish condition often forms the low at:
- One standard deviation below
- Two standard deviations below
Michael J. Huddleston states:
“Ideal buy days will create the low of the day no less than two standard deviations below the Central Bank Dealers Range.”
The wording should not be interpreted as a mechanical rule that price must always reach the second deviation.
Many strong bullish days form the low near the first deviation and then expand aggressively higher.
The trader should look for the projected deviation to overlap with:
- A discount PD Array
- Sell-side liquidity
- A bullish Fair Value Gap
- A bullish Order Block
- An old low
- A London Kill Zone setup
- Bullish higher-timeframe institutional order flow
The Third Standard Deviation
The third standard deviation can still produce the high or low of the day, but it represents a deeper price movement.
On bearish days, price may rally to the third standard deviation before forming the London high.
On bullish days, price may decline to the third standard deviation before forming the London low.
A movement to the third deviation may occur when:
- The manipulation is larger than usual
- A significant liquidity pool is positioned there
- The market is delivering increased volatility
- A higher-impact economic release is scheduled
- A deeper PD Array must be reached before expansion
The trader should be cautious when price reaches the third deviation because the setup may involve wider volatility and greater risk.
The Fourth Standard Deviation
The fourth standard deviation is less common.
Price usually reaches this level during:
- A very high-impact London news event
- An unusually volatile session
- A New York session reversal profile
- A significant liquidity sweep
When price moves to the fourth standard deviation, traders should avoid assuming that normal daily conditions are still present.
The move may be news-driven or may indicate that the expected London profile has changed.
A fourth-deviation movement can also create a New York reversal when the London expansion becomes excessively extended.
Directional Bias Is Required
The Central Bank Dealers Range is not a standalone trading strategy.
Before using the standard deviations, the trader must determine whether price is more likely to move higher or lower.
Directional bias may be formed from:
- Weekly candle expectations
- Daily institutional order flow
- Monthly, weekly and daily PD Arrays
- Seasonal tendencies
- Quarterly shifts
- One Shot One Kill analysis
- Premium and discount conditions
- Unmet higher-timeframe liquidity
When the market is bullish, the trader focuses on standard deviations below the range.
When the market is bearish, the trader focuses on standard deviations above the range.
Without directional bias, both sets of projections may appear tradable, creating confusion and unnecessary losses.
Using the Central Bank Dealers Range With PD Arrays
The strongest projections occur when a standard deviation overlaps with a logical PD Array.
For example, suppose the market is bullish and the first standard deviation below the range overlaps with:
- A bullish Order Block
- A Fair Value Gap
- Sell-side liquidity
That area becomes a potential location for the London low.
If price trades slightly deeper into the second deviation and reaches another discount PD Array, that may offer a second possible reversal zone.
In a bearish condition, the first or second deviation above the range may overlap with:
- A bearish Order Block
- Buy-side liquidity
- A bearish Fair Value Gap
- An old high
This overlap creates a stronger location for the daily high.
The standard deviation tells the trader how far price may expand. The PD Array explains why price may reverse at that level.
Using It With the London Session
The Central Bank Dealers Range is primarily used to project the high or low that may form during London.
For a bullish day, the trader looks for:
- A decline during London
- A move into one or two standard deviations below
- A discount PD Array
- A possible sell-side liquidity sweep
- Bullish displacement away from the level
For a bearish day, the trader looks for:
- A rally during London
- A move into one or two standard deviations above
- A premium PD Array
- A possible buy-side liquidity sweep
- Bearish displacement away from the level
The projection gives the trader a ballpark area. Price may reverse slightly before the exact level or trade marginally through it.
It should not be treated as an exact price that must be reached to the pip.
When the Range Should Be Avoided
The Central Bank Dealers Range should generally be avoided when:
- The range is larger than 40 pips.
- Directional bias is unclear.
- Price is consolidating between opposing higher-timeframe PD Arrays.
- The daily range is already mostly completed.
- A major economic release creates abnormal volatility.
- The projected deviation does not overlap with a logical price level.
- Price reaches the projected area outside the expected session timing.
- The market has already reached its weekly objective.
A range may look perfect mathematically but still fail because the broader market context does not support the setup.
Example of a Bullish Projection
Suppose the Central Bank Dealers Range is 20 pips.
The market is bullish based on the weekly and daily charts.
The trader identifies:
- One standard deviation below the range
- Two standard deviations below the range
- A bullish Fair Value Gap near the second deviation
- Sell-side liquidity below an Asian low
During London, price trades below the Asian low and reaches the bullish Fair Value Gap near the second deviation.
Price then delivers bullish displacement.
This provides a logical model for the low of the day.
The trader may then target:
- The Central Bank Dealers Range high
- Asian session highs
- Buy-side liquidity
- A premium intraday PD Array
Example of a Bearish Projection
Suppose the Central Bank Dealers Range is 25 pips.
The market is bearish based on higher-timeframe institutional order flow.
The trader identifies:
- One standard deviation above the range
- Two standard deviations above the range
- A bearish Order Block near the second deviation
- Buy-side liquidity above the Asian high
During London, price trades above the Asian high and reaches the bearish Order Block near the second deviation.
Price then delivers bearish displacement.
This creates a potential model for the high of the day.
The trader may then target:
- The Central Bank Dealers Range low
- Asian session lows
- Sell-side liquidity
- A discount intraday PD Array
Central Bank Dealers Range Trading Checklist
Before using the range, confirm the following:
- Mark 14:00 to 20:00 New York time.
- Calculate the highest and lowest price in that period.
- Prefer a total range of 20 to 30 pips.
- Avoid ranges larger than 40 pips.
- Compare candle-body and wick measurements.
- Determine the weekly and daily directional bias.
- Mark one to four standard deviations.
- Focus below the range on bullish days.
- Focus above the range on bearish days.
- Look for overlap with a premium or discount PD Array.
- Check the Asian range and nearby liquidity.
- Wait for the appropriate London session timing.
- Look for displacement before entering.
- Do not treat a standard deviation as an automatic entry.
- Avoid forcing a trade when the conditions are unclear.
Common Mistakes
A common mistake is projecting the range without first determining directional bias.
Another mistake is using a range that is too large. A 50 or 60-pip range can create impractical projections and reduce the model’s usefulness.
Some traders also enter immediately when price touches a standard deviation. A deviation is only a projected location. The trader should still look for liquidity, PD Array confluence and a clear price reaction.
Another error is expecting the projection to identify the exact high or low to the pip. Price may stop slightly before the level or trade marginally beyond it.
The objective is to identify a probable area, not a guaranteed price.
Final Thoughts
The Central Bank Dealers Range is a projection tool used within the ICT day trading model to estimate where the London high or low of the day may form.
Its effectiveness depends on four main elements:
- A properly defined 14:00 to 20:00 New York range
- An ideal range size of approximately 20 to 30 pips
- Correct bullish or bearish directional bias
- Confluence with institutional PD Arrays and liquidity
On bullish days, the trader studies standard deviations below the range to locate the possible daily low.
On bearish days, the trader studies standard deviations above the range to locate the possible daily high.
The model becomes more useful when combined with the Asian range, London Kill Zone, seasonal tendencies, quarterly shifts and higher-timeframe institutional order flow.
The Central Bank Dealers Range should not be used as a mechanical buy-or-sell signal. It is a framework for narrowing the area where a high-probability intraday reversal may occur.