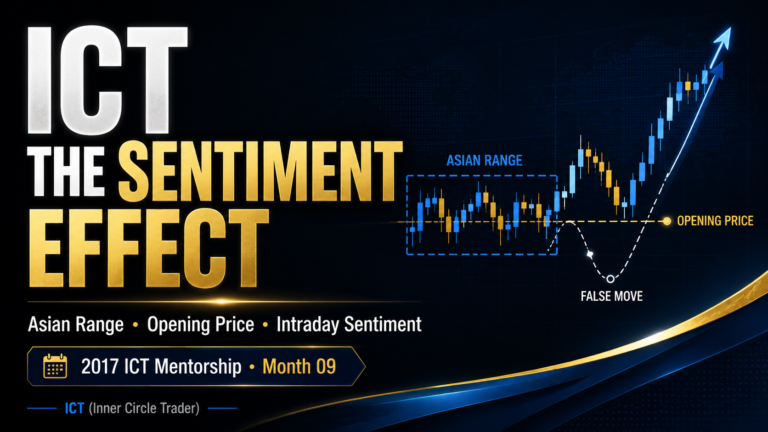
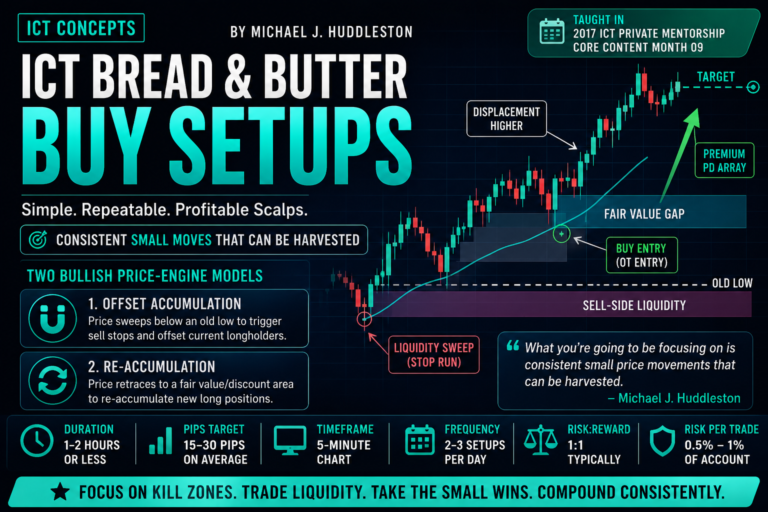
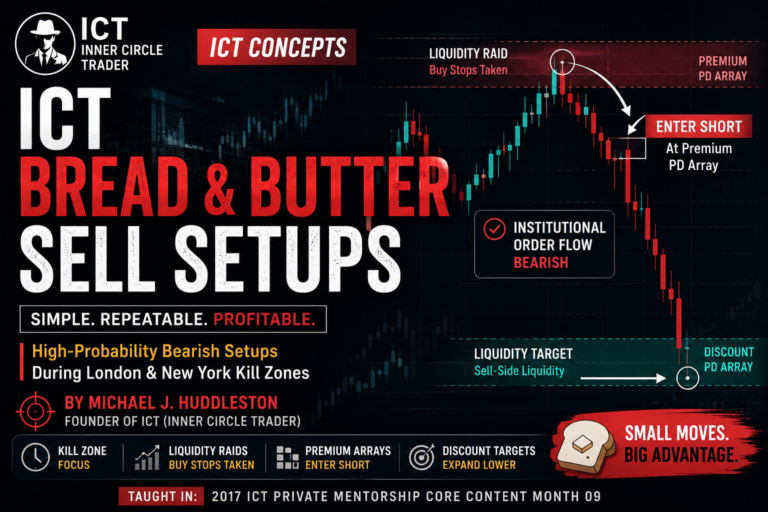
The ICT Day Trade Routine is a structured intraday analysis process taught by Michael J. Huddleston, the founder of ICT (Inner Circle Trader). This concept is taught in the 2017 ICT Private Mentorship Core Content Month 09 as part of the ICT Amplified Day Trading and Scalping material.
The routine explains how a trader can move from broad market analysis to a specific intraday setup.
It combines:
- Economic calendar analysis
- Higher-timeframe institutional order flow
- IPDA data ranges
- Premium and discount PD arrays
- Weekly templates
- Daily profiles
- Kill Zones
- Opening prices
- Standard deviations
- Average Daily Range
- Lower-timeframe execution
The goal is not to predict every market movement.
The goal is to create a logical framework that helps the trader identify the most probable direction, time and price area for a day trade.
Michael J. Huddleston explains:
“We operate inside of probabilities.”
This is the foundation of the ICT Day Trade Routine.
What Is the ICT Day Trade Routine?
The ICT Day Trade Routine is a top-down process used to prepare for London and New York trading sessions.
The trader starts with macro information and gradually moves toward lower-timeframe execution.
The routine generally follows this order:
- Review the economic calendar.
- Identify the active trading session.
- Analyze the Dollar Index.
- Mark the IPDA data ranges.
- Identify higher-timeframe PD arrays.
- Determine institutional order flow.
- Analyze the selected currency pair.
- Study the weekly profile.
- Build bullish and bearish scenarios.
- Move to the 15-minute and five-minute charts for entry.
Every step narrows the trader’s focus.
Step 1: Review the Economic Calendar
The first task is to review the economic calendar for the next trading day.
The trader should identify:
- High-impact news
- Medium-impact news
- The currency affected
- The exact release time
- Whether the event falls inside a Kill Zone
Economic events may provide the volatility needed to create:
- Liquidity raids
- Judas Swings
- Daily highs
- Daily lows
- Market reversals
- Session expansions
The purpose is not to trade every news release.
The purpose is to understand when the market may receive a volatility injection.
Focus on London and New York News
The most important economic events are often those that occur during:
- London Open
- New York Open
These sessions contain greater institutional participation and volume.
For example, if a medium- or high-impact euro event occurs during the London Kill Zone, EURUSD may become a primary market to study.
This allows the trader to narrow the watchlist before opening the charts.
Why News Timing Matters
A news release may support the manipulation phase of the daily range.
During London, price may use the event to form the daily high or low.
During New York, the event may produce:
- Continuation of London’s direction
- A New York Judas Swing
- A session reversal
- Expansion toward the daily objective
The news event is not the trade setup.
It is a timing catalyst within the broader price framework.
Step 2: Select the Market to Study
Once the calendar has been reviewed, the trader chooses the market most likely to provide opportunity.
The selection may be based on:
- A medium- or high-impact news event
- Strong higher-timeframe structure
- Clear liquidity objectives
- A major Kill Zone event
- Relationship with the Dollar Index
Instead of monitoring many random markets, the trader focuses on a small number of relevant pairs.
This helps reduce distraction and overtrading.
Step 3: Begin With the Dollar Index
When trading major forex pairs, the ICT Day Trade Routine starts with the Dollar Index.
The Dollar Index provides context for the likely direction of USD-related currency pairs.
The trader studies:
- Daily institutional order flow
- Premium and discount
- Recent highs and lows
- IPDA data ranges
- Higher-timeframe PD arrays
- Liquidity objectives
For example:
- A bullish Dollar Index may support bearish EURUSD conditions.
- A bearish Dollar Index may support bullish EURUSD conditions.
The relationship is not always perfectly inverse, but it provides an important analytical baseline.
Step 4: Mark the IPDA Data Ranges
The ICT Day Trade Routine uses three primary IPDA lookback periods:
- 20 trading days
- 40 trading days
- 60 trading days
These ranges help the trader understand where price is located within recent historical order flow.
The trader counts backward from the previous completed trading day.
If the platform displays Sunday candles, those candles should be excluded when calculating the trading-day ranges.
The 20-Day IPDA Range
For day trading and scalping, the 20-day range is usually the most important.
The trader marks:
- The highest high of the last 20 trading days
- The lowest low of the last 20 trading days
This creates a working dealing range.
The trader then asks:
- Is price in premium?
- Is price in discount?
- Is price near equilibrium?
- Which PD arrays remain unfilled?
Most day-trading analysis begins inside this range.
When to Use the 40-Day Range
The 40-day range becomes relevant when:
- The 20-day PD arrays have already been traded through
- Price is near the edge of the 20-day range
- A larger liquidity objective is needed
- The market is expanding beyond recent structure
This gives the trader a broader view without immediately moving to an extremely long-term chart.
When to Use the 60-Day Range
The 60-day range provides the longest primary IPDA reference in this routine.
It may be useful when:
- Price has exhausted the 20- and 40-day ranges
- A major historical high or low is nearby
- The trader needs a macro context
- A quarterly shift may be developing
However, the daily trader will still spend most of the time working with the 20-day range.
Keep the IPDA Ranges Dynamic
The IPDA ranges move forward each trading day.
A new completed daily candle is added, and the oldest candle drops out of the range.
The trader can maintain three moving boxes for:
- 20 days
- 40 days
- 60 days
This keeps the framework current.
Step 5: Mark Premium and Discount
After defining the IPDA range, the trader determines whether the market is in premium or discount.
Premium
Price is trading in the upper half of the selected range.
This may favor:
- Selling opportunities
- Profit-taking on longs
- Reactions from bearish PD arrays
Discount
Price is trading in the lower half of the selected range.
This may favor:
- Buying opportunities
- Profit-taking on shorts
- Reactions from bullish PD arrays
Premium and discount do not create a trade by themselves.
They provide context for the trader’s directional argument.
Step 6: Identify Higher-Timeframe PD Arrays
The trader then marks important PD arrays on the daily chart.
These may include:
- Order blocks
- Fair value gaps
- Breaker blocks
- Rejection blocks
- Propulsion blocks
- Liquidity voids
- Old highs
- Old lows
- Equal highs
- Equal lows
The trader identifies arrays above and below the current market price.
This creates a map of potential:
- Entry areas
- Reaction zones
- Liquidity objectives
- Invalidation levels
Premium PD Arrays
Premium arrays may include:
- Bearish order block
- Bearish fair value gap
- Breaker block
- Previous high
- Equal highs
- Rejection block
These levels may attract price during a retracement and provide potential selling conditions.
Discount PD Arrays
Discount arrays may include:
- Bullish order block
- Bullish fair value gap
- Previous low
- Equal lows
- Breaker block
- Rejection block
These levels may support bullish reactions or act as downside objectives.
Mark Only Relevant Arrays
The chart should not become overloaded.
The trader should prioritize the PD arrays that are:
- Inside the current IPDA range
- Closest to current price
- Aligned with institutional order flow
- Connected to clear liquidity
- Relevant to the current week
A clean chart improves decision-making.
Step 7: Determine Institutional Order Flow
Institutional order flow provides the primary directional bias.
The trader studies whether price is respecting bullish or bearish PD arrays.
Bullish Institutional Order Flow
Possible signs include:
- Bullish order blocks being respected
- Price making higher highs
- Sell-side liquidity being taken before rallies
- Discount arrays producing displacement
- Bullish fair value gaps supporting price
Bearish Institutional Order Flow
Possible signs include:
- Bearish order blocks being respected
- Price making lower lows
- Buy-side liquidity being taken before declines
- Premium arrays producing bearish displacement
- Bearish fair value gaps acting as resistance
The best day trades usually align with the higher-timeframe institutional order flow.
Directional Bias Is Not Absolute
A bullish daily bias does not mean price will rise without retracing.
A bearish daily bias does not mean price will decline in a straight line.
Price may first move against the higher-timeframe direction to:
- Raid liquidity
- Enter a PD array
- Create better institutional pricing
- Form the daily high or low
- Complete a weekly template
The trader must build scenarios rather than assume a straight-line move.
Step 8: Analyze the Selected Pair
After studying the Dollar Index, the trader applies the same process to the selected currency pair.
For example, on EURUSD the trader may mark:
- 20-day high and low
- Premium and discount
- Daily PD arrays
- Four-hour PD arrays
- Current institutional order flow
- Historical highs and lows
- Liquidity pools
The pair’s structure is then compared with the Dollar Index.
Example of Relative Context
Suppose:
- The Dollar Index is in discount
- The Dollar Index has upside PD arrays
- EURUSD is in premium
- EURUSD has downside discount arrays
This may support a short-term EURUSD decline and Dollar Index rally.
However, the trader must still study each market independently.
The relationship provides confirmation, not certainty.
Step 9: Move to the Four-Hour Chart
The four-hour chart helps refine the daily analysis.
The trader looks for:
- Intermediate PD arrays
- Short-term premium and discount
- Equal highs and lows
- Fair value gaps
- Order blocks
- Potential liquidity raids
- Changes in market structure
The four-hour chart bridges the gap between the daily bias and the intraday setup.
Building the Bullish Argument
When the daily order flow is bullish, the trader asks:
- Where could price retrace to accumulate new long positions?
- Which sell-side liquidity could be taken?
- Is there a four-hour discount array below?
- Is an old high or fair value gap available as support?
- Could the retracement form the weekly low?
The trader should be able to explain why price may decline before moving higher.
Building the Bearish Argument
When the daily order flow is bearish, the trader asks:
- Where could price retrace to create premium pricing?
- Which buy-side liquidity could be taken?
- Is there a four-hour premium array above?
- Is an old low available as a target?
- Could the retracement form the weekly high?
A good plan includes both the expected move and the manipulation that may precede it.
Step 10: Move to the 60-Minute Chart
The 60-minute chart provides more precise intraday reference points.
The trader may identify:
- Hourly fair value gaps
- Hourly order blocks
- Equal highs
- Equal lows
- Session liquidity
- Intermediate dealing ranges
- Intraday support and resistance arrays
The trader looks for confluence between the 60-minute chart and the daily or four-hour arrays.
Confluence of PD Arrays
A higher-probability setup may form when multiple PD arrays overlap.
For example:
- Equal lows
- A 60-minute bullish order block
- A 60-minute fair value gap
- A daily discount array
- A projected standard deviation
This creates a more meaningful reaction zone than a single isolated level.
Step 11: Study the Weekly Template
The weekly template helps the trader understand how the current week may develop.
Possible bullish weekly ideas include:
- Monday low of the week
- Tuesday low of the week
- Wednesday reversal
- Midweek expansion
- Thursday weekly high
- Friday profit-taking
Possible bearish weekly ideas include:
- Monday high of the week
- Tuesday high of the week
- Wednesday reversal lower
- Midweek bearish expansion
- Thursday weekly low
- Friday retracement
The trader does not know in advance which template will unfold.
The templates provide possible scenarios.
Adjust for Holidays
A market holiday may change the normal weekly rhythm.
For example, if Monday is a US bank holiday:
- Monday may remain quiet
- Tuesday may behave like a normal Monday
- Wednesday may become the more likely reversal day
- The main weekly expansion may occur later
The trader should account for the actual trading environment rather than rigidly applying a template.
Step 12: Create Bullish and Bearish Scenarios
The ICT Day Trade Routine does not rely on one fixed prediction.
The trader builds conditional scenarios.
Bullish Scenario
- Price trades into a discount PD array
- Sell-side liquidity is taken
- Price rejects the lower level
- London or New York forms the low
- Bullish displacement appears
- Price expands toward premium
Bearish Scenario
- Price trades into a premium PD array
- Buy-side liquidity is taken
- Price rejects the higher level
- London or New York forms the high
- Bearish displacement appears
- Price expands toward discount
The trader then waits to see which scenario price confirms.
Use Failure as Information
If an expected PD array fails, the failure provides information.
For example:
- A bullish order block fails
- Price trades through the level
- Sell-side liquidity below becomes a likely target
- The trader changes from a buying idea to a bearish expansion idea
Michael J. Huddleston explains that a losing idea can provide greater insight into what price is likely to do next.
The trader should not treat every invalidated setup as a personal defeat.
Step 13: Mark the Opening Prices
The ICT Day Trade Routine uses two important opening prices:
- 00:00 GMT opening price
- New York midnight opening price
Michael J. Huddleston places particular emphasis on the New York midnight opening price for daily trading.
The opening price helps the trader identify:
- Protraction above or below the open
- Judas Swing conditions
- Premium or discount relative to the day
- Potential formation of the daily high or low
Bullish Opening-Price Model
On a bullish day, the trader may expect:
- Price opens
- Price trades below the opening price
- Price reaches a discount array
- Sell-side liquidity is taken
- Price reverses higher
- The day closes above the opening price
This creates an open-low-high-close type profile.
Bearish Opening-Price Model
On a bearish day, the trader may expect:
- Price opens
- Price trades above the opening price
- Price reaches a premium array
- Buy-side liquidity is taken
- Price reverses lower
- The day closes below the opening price
This creates an open-high-low-close type profile.
Do Not Trade Every Opening Price
Trading every 00:00 GMT or New York midnight opening can lead to overtrading.
The opening price must align with:
- Higher-timeframe order flow
- Weekly template
- PD arrays
- Standard deviations
- Session timing
- Liquidity
The trader should not enter simply because price moved above or below the open.
Step 14: Add Standard Deviations
On the 15-minute chart, the trader may project standard deviations from:
- Asian range
- Central Bank Dealers Range
- Flout
- Opening price
These projections help estimate possible daily highs and lows.
They may provide:
- Entry areas
- Liquidity objectives
- Expansion targets
- Reversal zones
The standard deviation becomes more useful when it overlaps with a higher-timeframe PD array.
The 33-Pip Reference
In a classic 100-pip daily-range environment, price may move approximately one-third of the expected range away from the opening price before reversing.
This may create a framework of approximately 33 pips.
However, this is not a fixed rule.
The trader should use the actual range, market conditions and PD array confluence.
Step 15: Use the Average Daily Range
The Average Daily Range helps estimate the likely magnitude of the daily move.
The trader marks:
- ADR high
- ADR low
- Remaining daily range
- Whether ADR has already been reached
ADR should be combined with:
- Standard deviations
- PD arrays
- Liquidity levels
- Session timing
ADR as a Target
On a bullish day, the ADR high may become an upside objective.
On a bearish day, the ADR low may become a downside objective.
The trader should not assume price must reach the exact level.
Price may:
- Stop before ADR
- Reach ADR
- Exceed ADR
- Double ADR during a large expansion
When ADR Is Below 60 Pips
When the recent ADR is below approximately 60 pips, the market may eventually produce a larger expansion day.
If institutional order flow is clear and ADR is reached early, the trader may consider holding a portion of the trade for extended range.
This may be especially relevant when:
- ADR is reached before New York
- High-impact news remains scheduled
- The weekly objective is still open
- Price has strong displacement
Step 16: Define the Expected Daily Profile
The trader determines which daily profile is most likely.
Possible profiles include:
Bullish London Low
- Price declines during London
- London forms the low
- Price rallies
- New York continues higher
Bullish New York Reversal
- London trades lower
- Price reaches a discount PD array during New York
- New York forms the low
- Price reverses higher
Bearish London High
- Price rallies during London
- London forms the high
- Price declines
- New York continues lower
Bearish New York Reversal
- London trades higher
- Price reaches a premium PD array during New York
- New York forms the high
- Price reverses lower
The trader should know which profile is being anticipated before entering.
Step 17: Wait for a Kill Zone
The best setups should form during a meaningful trading window.
Primary Kill Zones include:
- London Open
- New York Open
These periods provide:
- Greater liquidity
- Higher volume
- News-driven volatility
- Institutional participation
- Daily high and low formation
The trader should avoid searching for random entries throughout the entire day.
Step 18: Drop to the 15-Minute Chart
The 15-minute chart is used to refine the expected area.
The trader studies:
- Opening price
- Standard deviations
- Session highs and lows
- Fair value gaps
- Order blocks
- Liquidity raids
- Market structure
The 15-minute chart helps confirm whether price is reacting properly at the higher-timeframe level.
Step 19: Use the Five-Minute Chart for Execution
The five-minute chart may provide the final entry.
Possible entry models include:
- Market Structure Shift
- Fair Value Gap
- Order block
- Breaker block
- Turtle Soup
- Liquidity raid
- Judas Swing
- Optimal Trade Entry
The five-minute chart should not create the bias.
It should only execute the higher-timeframe idea.
Example of a Bullish Day Trade Routine
Assume the daily institutional order flow is bullish.
The routine may develop as follows:
- Economic calendar shows euro news during London
- Dollar Index is near premium and may decline
- EURUSD is retracing into daily discount
- Sell-side liquidity rests below equal lows
- A 60-minute bullish fair value gap overlaps a bullish order block
- Tuesday or Wednesday may form the weekly low
- Price trades below the New York midnight opening
- London raids the equal lows
- Price reaches the discount array
- Bullish displacement appears on the five-minute chart
- The trader enters on a retracement
- Targets include the opening price, London high and ADR high
This is a complete scenario based on time and price.
Example of a Bearish Day Trade Routine
Assume the daily institutional order flow is bearish.
The process may look like this:
- Economic calendar shows USD news during New York
- Dollar Index is in discount and may rally
- EURUSD is in premium
- Buy-side liquidity rests above an intraday high
- A four-hour bearish fair value gap is nearby
- Tuesday may form the weekly high
- Price trades above the midnight opening
- New York raids the short-term high
- Price enters the premium PD array
- Bearish displacement forms
- The trader enters short
- Targets include the London low, previous day’s low and ADR low
Again, every step supports the final entry.
The Importance of Monday, Tuesday and Wednesday
Michael J. Huddleston gives particular importance to Monday, Tuesday and Wednesday for directional day trading.
When institutional order flow is bullish, these days may provide better long opportunities.
When institutional order flow is bearish, they may provide better short opportunities.
These are often the days when:
- Weekly high or low is formed
- Manipulation occurs
- The main weekly expansion begins
- Institutional sponsorship becomes clear
The trader should still evaluate actual conditions rather than trade automatically.
Avoiding Friday Trades
Friday may produce:
- Profit-taking
- Reduced follow-through
- Weekly range completion
- Reversals
- Consolidation
If the weekly objective has already been reached, entering a new trend-following trade on Friday may offer limited reward.
Friday trades should be selected carefully.
Day Trading Is Not Everyday Trading
A major lesson within the ICT Day Trade Routine is selectivity.
Michael J. Huddleston states:
“Day trading is not everyday trading, and scalping is not every move.”
Some days will not provide a valid setup.
The market may be:
- Consolidating
- Retracing
- Between PD arrays
- Waiting for news
- Completing a weekly transition
- Lacking sufficient volatility
No trade is a valid decision when the routine does not produce alignment.
Why Higher-Timeframe Analysis Comes First
The lower-timeframe chart contains many apparent setups.
Without higher-timeframe context, the trader may take:
- A bullish setup inside a major premium array
- A bearish setup inside a major discount array
- A reversal against institutional order flow
- A scalp after the daily objective is complete
This is why the ICT Day Trade Routine starts with the daily chart rather than the five-minute chart.
Plan the Trade, Then Trade the Plan
Within ICT methodology, planning the trade means defining:
- Higher-timeframe direction
- Weekly scenario
- Daily profile
- Session timing
- Entry area
- Liquidity target
- Invalidation point
- Alternate scenario
The plan is not a rigid prediction.
It is a set of conditions.
The trader acts only when price confirms one of the prepared scenarios.
How to Respond When the Analysis Is Wrong
An invalidated setup should trigger a reassessment.
The trader asks:
- Which PD array failed?
- Which liquidity pool is now exposed?
- Has institutional order flow changed?
- Is the market targeting a deeper array?
- Should the trader wait for another session?
- Has the opposite scenario become more likely?
Losses should be controlled and studied.
Michael J. Huddleston explains:
“Smart money investors do not view a loss as a defeat. It’s a premium paid for greater insight.”
Flexibility Without Randomness
Day traders must be flexible, but flexibility does not mean changing bias every few minutes.
A valid shift should be based on:
- PD array failure
- Strong displacement
- Market structure change
- Liquidity being cleared
- Failure of the expected session profile
- A new higher-timeframe objective
The trader should respond to evidence, not emotion.
How Long the Routine Takes
A new trader may need 30 to 40 minutes to complete the routine.
With experience, the process becomes faster.
Over time, the trader begins to recognize:
- IPDA ranges
- Major PD arrays
- Institutional order flow
- Weekly templates
- Session profiles
- Likely objectives
The goal is not to rush.
The goal is to become systematic.
Use Historical Study to Improve the Routine
Traders should review historical charts and record how the routine would have applied.
A useful study process includes:
- Mark the economic news
- Define the 20-day range
- Identify premium and discount
- Mark PD arrays
- Determine institutional order flow
- Select the weekly template
- Identify the daily profile
- Review the Kill Zone
- Study the lower-timeframe entry
- Record the final delivery
This creates experience without risking capital.
Watching Intraday Price Action
Michael J. Huddleston recommends studying intraday price delivery, even for traders who do not intend to day trade.
Watching price unfold helps the trader understand:
- How liquidity is engineered
- How PD arrays react
- How session highs and lows form
- How displacement develops
- How a setup fails
- How price transitions between objectives
Recorded intraday charts can be reviewed at higher playback speed for study.
ICT Day Trade Routine Checklist
Economic Calendar
- What medium- and high-impact events are scheduled?
- Which currencies are affected?
- Do the events occur during London or New York?
- Could the event produce manipulation or expansion?
Market Selection
- Which pair has the clearest catalyst?
- Is the pair aligned with the Dollar Index?
- Is sufficient volatility expected?
- Is there a clear liquidity objective?
Higher-Timeframe Analysis
- What are the 20-, 40- and 60-day IPDA ranges?
- Is price in premium or discount?
- What is the daily institutional order flow?
- Which PD arrays are above and below price?
- What is the main draw on liquidity?
Four-Hour and 60-Minute Analysis
- Are equal highs or lows present?
- Is there a fair value gap?
- Is there an order block?
- Where is short-term premium or discount?
- Which level should hold if the bias is correct?
Weekly Framework
- Which weekly templates are possible?
- What day may form the weekly high or low?
- Is there a holiday affecting the weekly profile?
- Has the weekly objective already been completed?
Daily Profile
- Should London form the high or low?
- Is New York expected to continue or reverse?
- Is price likely to move above or below the opening price first?
- Which session should deliver the main expansion?
Intraday Tools
- Where is the New York midnight opening price?
- Where are the Asian range deviations?
- Where are the Central Bank Dealers Range deviations?
- Where are the ADR high and low?
- Do these levels overlap with PD arrays?
Entry
- Has liquidity been raided?
- Has price reached the expected PD array?
- Is the setup inside a Kill Zone?
- Has displacement appeared?
- Is the entry aligned with institutional order flow?
Risk and Targets
- Where is the trade invalidated?
- Is the stop logically placed?
- Is the position size controlled?
- What is the first liquidity target?
- Has the daily range already been completed?
Common Mistakes
Common mistakes with the ICT Day Trade Routine include:
- Starting on the five-minute chart
- Ignoring the economic calendar
- Watching too many markets
- Failing to define IPDA ranges
- Trading against institutional order flow
- Marking too many PD arrays
- Treating weekly templates as guarantees
- Trading every opening-price movement
- Entering outside the Kill Zones
- Ignoring ADR
- Refusing to change the scenario after invalidation
- Trading every day
- Forcing a setup after the main move has completed
Final Thoughts
The ICT Day Trade Routine is a complete top-down framework for preparing and executing intraday trades.
The process begins with:
- Economic calendar analysis
- Market selection
- Dollar Index analysis
- IPDA data ranges
- Premium and discount
- Higher-timeframe PD arrays
- Institutional order flow
It then moves into:
- Weekly templates
- Daily profiles
- Opening prices
- Kill Zones
- Standard deviations
- Average Daily Range
- Lower-timeframe execution
The routine does not remove uncertainty.
It organizes uncertainty into a set of probable scenarios.
The trader’s job is to identify the higher-timeframe bias, wait for price to reach the correct area and execute only when time and price align.
Consistency comes from repeating the same analytical process every day, not from taking a trade every day.