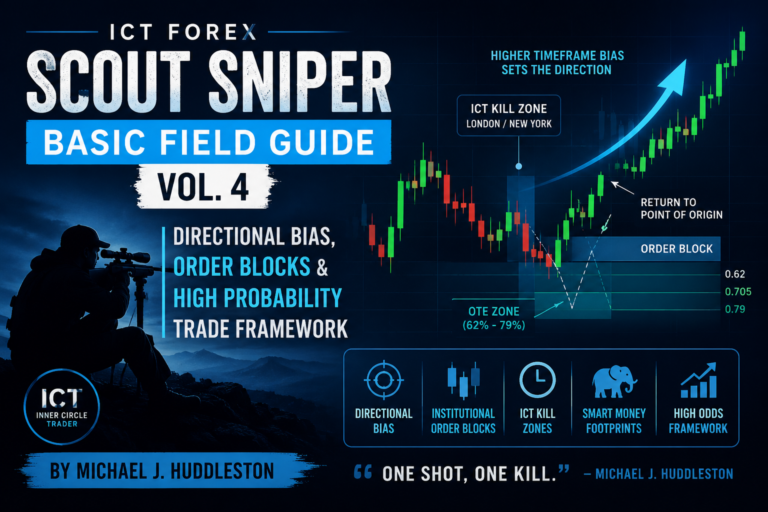
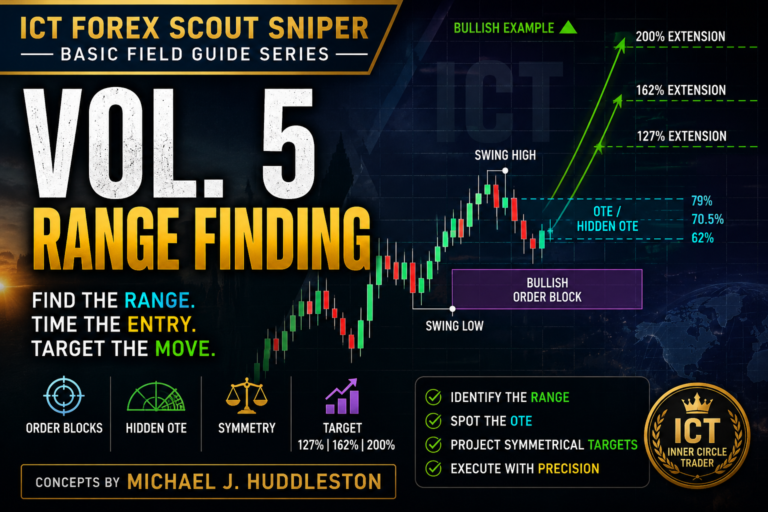
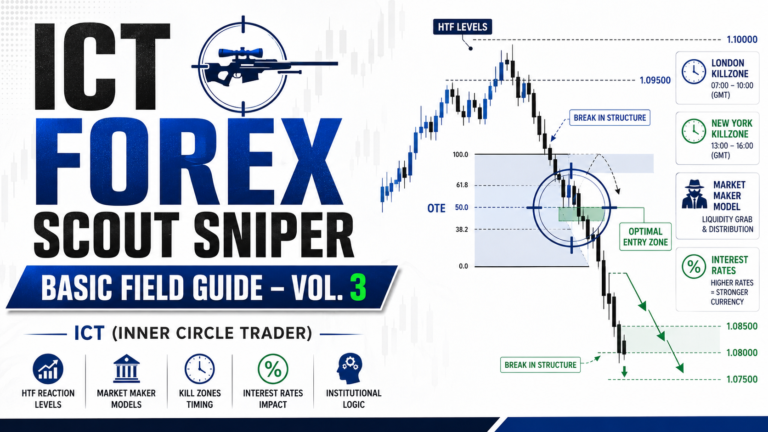
The ICT Forex Scout Sniper Basic Field Guide – Vol. 2, developed and taught by Michael J. Huddleston, introduces traders to the foundational principles behind institutional price delivery. This concept is taught in the ICT Forex Scout Sniper Basic Field Guide Series, where traders learn to approach the market like disciplined marksmen rather than impulsive participants.
The primary lesson of Volume 2 is that successful trading does not begin with searching for entries on lower time frames. It begins by understanding higher-time-frame price levels, directional bias, institutional order flow, time of day, day-of-week tendencies, and the recurring structure of price movements.
Instead of attempting to predict every market swing, traders are encouraged to identify areas where institutional activity is likely to influence price and then patiently wait for a high-quality opportunity.
As Michael J. Huddleston explains:
“It’s not about how many trades you take; it’s the quality of the trades that you take.”
What Is the ICT Scout Sniper Approach?
The ICT scout sniper approach is based on precision, patience, observation, and preparation.
A sniper does not continuously fire in every direction. The sniper studies the environment, identifies a suitable target, waits for the correct conditions, and acts only when the opportunity is properly aligned.
The same mindset applies to ICT trading.
A trader should not open the chart and immediately look for a position. Instead, the trader should first determine:
- The higher-time-frame directional bias
- The major support and resistance levels
- The likely institutional price objective
- The current stage of the weekly price range
- The trading session in which price is operating
- The location of liquidity above highs or below lows
- Whether institutional sponsorship is visible
This process reduces random trading and helps the trader focus on setups that are supported by multiple conditions.
Start With the Higher-Time-Frame Narrative
One of the strongest principles in the ICT Forex Scout Sniper Basic Field Guide – Vol. 2 is that analysis should begin on higher time frames.
The daily and four-hour charts provide the broader market narrative. The one-hour chart may then be used when additional clarification is required.
These higher time frames help traders identify:
- Significant swing highs and swing lows
- Institutional support and resistance
- Major round-number levels
- Areas where price previously accelerated
- Potential liquidity targets
- The probable direction of the next price expansion
Lower-time-frame charts should only be used after the higher-time-frame context has been established.
Michael J. Huddleston warns:
“If you don’t have the higher time frame premise in mind, you are gambling.”
A lower-time-frame pattern may look convincing, but without higher-time-frame support, it has no meaningful institutional context.
How to Identify Institutional Price Levels
Institutional traders frequently conduct business around significant price levels. These levels are often visible through repeated reactions involving candle bodies, wicks, swing points, consolidations, and round numbers.
Important institutional price levels may include:
- Previous daily highs and lows
- Old swing highs and swing lows
- Major support and resistance
- Large round numbers
- Mid-figure levels
- Areas of repeated candle-body interaction
- Levels where price previously displaced aggressively
For example, a price such as 1.3060 may be simplified into a meaningful institutional reference rather than focusing on an irregular level such as 1.3058 or 1.3063.
Large institutions manage substantial order sizes. They are generally more concerned with building an average position around a meaningful price zone than achieving the exact precision expected by a small retail trader.
Therefore, institutional levels should usually be treated as areas rather than single, perfectly precise lines.
Support and Resistance Role Reversal
Support and resistance do not remain permanently fixed in one role.
When price breaks above a resistance level, the same level may later act as support. Similarly, when price breaks below support, that level may become resistance during a retracement.
This is known as an inversion level or support-and-resistance role reversal.
A bullish example follows this sequence:
Resistance → Price breaks higher → Retracement → Former resistance becomes support → Price continues higher
A bearish example follows the opposite sequence:
Support → Price breaks lower → Retracement → Former support becomes resistance → Price continues lower
These inversion levels are especially useful when they align with:
- Higher-time-frame directional bias
- Institutional round numbers
- Fibonacci retracement levels
- Previous session highs or lows
- A favorable time of day
The greater the alignment, the stronger the potential trading location becomes.
Understanding Institutional Order Accumulation
Institutional traders cannot normally enter their entire position with one order. Their position size may be too large for the available liquidity at a single price.
Instead, they gradually build positions.
For example, when institutions intend to establish a large short position, they may sell smaller portions every time price trades into a resistance zone. Price may repeatedly move above and below that level while the larger position is being accumulated.
This behavior can produce:
- Repeated failures above a resistance level
- Multiple wicks through the same price
- Short rallies followed by aggressive declines
- Consolidation near an institutional level
- Sudden displacement after order accumulation is complete
Once the required selling orders have been established and buying liquidity becomes insufficient, price may fall aggressively.
The same process can occur in reverse when institutions are accumulating long positions near support.
Institutional Footprints and Price Displacement
Retail traders generally do not possess enough capital to create major market movements. Large banks, funds, dealers, and institutional participants are responsible for meaningful price displacement.
ICT describes institutional involvement through the analogy of an elephant entering a swimming pool. A small participant creates only a minor disturbance, but the elephant displaces a large amount of water.
Institutional activity creates a similar effect in price.
Its footprints may appear as:
- Large impulsive candles
- Rapid movement away from a price level
- A break of several short-term highs or lows
- Limited retracement during the expansion
- Repeated rejection from an institutional level
- A clear shift in short-term market structure
Traders do not need to know the identity of the institution involved. They only need to recognize that significant participation has entered the market.

Time of Day and Price Delivery
Price does not move with equal significance throughout the entire trading day.
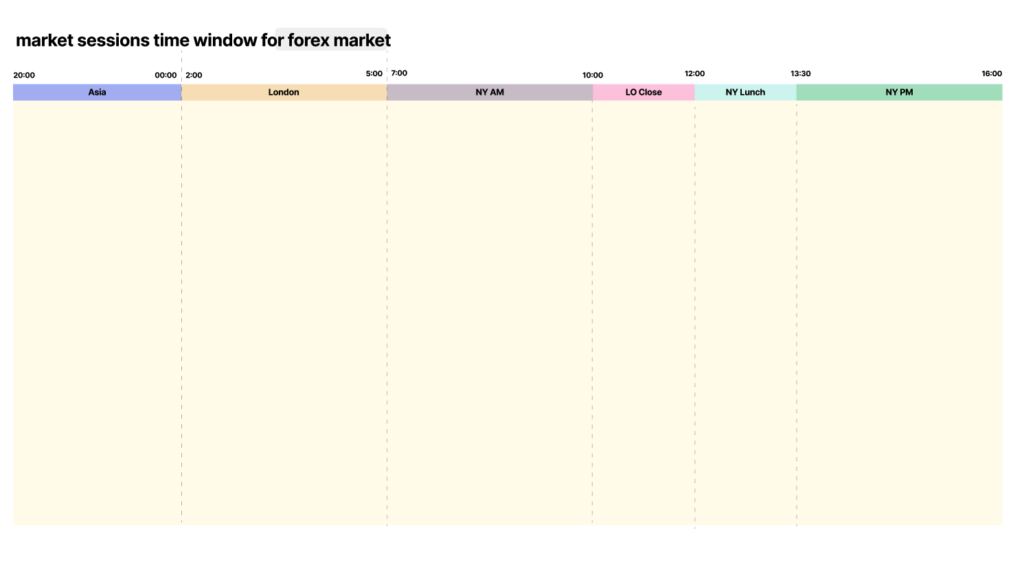
Important market highs and lows frequently form around major session openings and closings. The ICT methodology organizes these time windows into specific periods commonly called ICT Kill Zones.
The three primary sessions are:
- Asian session
- London session
- New York session
Traders should study the highest and lowest price formed during each session. These session extremes may later become liquidity targets, support, resistance, or reference points for Fibonacci measurements.
Important turning points frequently occur around:
- Frankfurt open
- London open
- New York open
- London close
- Asian session activity
The goal is not to trade every session. The objective is to understand when institutional participation is most likely to create a meaningful expansion or reversal.
Day-of-Week Tendencies
The day of the week can also influence how the weekly range develops.
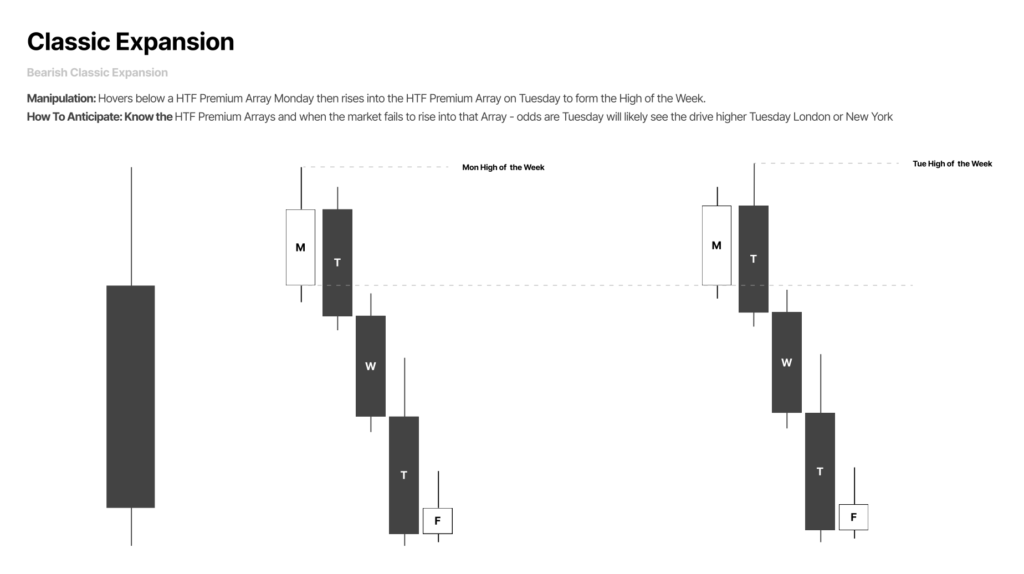
Bearish Weekly Conditions
When the daily chart suggests that price is likely to move lower, the high of the week will frequently form between Monday and Tuesday’s London open.
In some cases, the high may form by Wednesday’s London open, particularly when important economic events influence the weekly range.
A simplified bearish weekly model is:
Monday or Tuesday high → Institutional selling → Midweek expansion lower → Lower liquidity objective
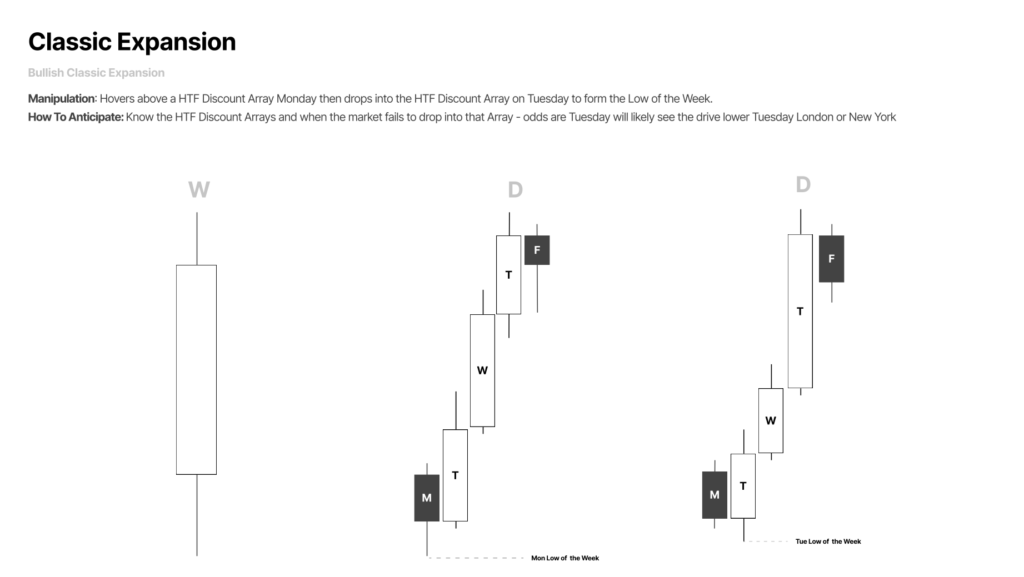
Bullish Weekly Conditions
When the daily chart suggests higher prices, the low of the week will frequently form on Monday or Tuesday.
A simplified bullish weekly model is:
Monday or Tuesday low → Institutional buying → Midweek expansion higher → Higher liquidity objective
These tendencies are not guarantees. They should be combined with higher-time-frame levels, market structure, liquidity, and time-of-day analysis.
Large-Range Candle Characteristics
A large-range candle generally does not trade extensively on both sides of its opening price.
For example, when a bullish weekly expansion is expected, price may trade slightly below the opening price before aggressively moving higher. The initial decline may create the low of the day or week.
Similarly, during bearish conditions, price may trade modestly above the opening before expanding lower.
This principle helps traders recognize that a small move against the expected direction does not always invalidate the bias. It may be the manipulation phase that occurs before institutional expansion.
However, the move must still react from a meaningful support or resistance level. Traders should not assume that every small decline is automatically a buying opportunity or that every rally is a selling opportunity.
Liquidity and the Pairing of Orders
Every market transaction requires both a buyer and a seller.
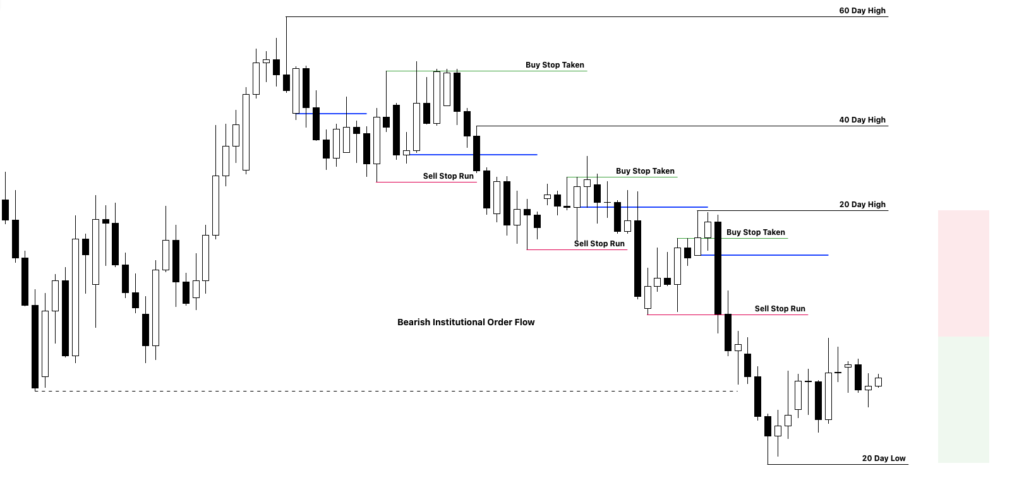
When retail traders place stop-loss orders, those stops become potential liquidity for institutional traders.
For example, when retail traders sell below a declining trendline, they may place buy stops above a recent swing high. If price later moves above that high, those buy stops become market buy orders.
Institutional sellers can use those market buy orders to establish or add to short positions.
The bearish process may look like this:
Retail traders sell → Stops accumulate above a swing high → Price trades above the high → Buy stops are activated → Institutions sell into the buying liquidity → Price moves lower
The bullish process works in reverse:
Retail traders buy → Stops accumulate below a swing low → Price trades below the low → Sell stops are activated → Institutions buy from the selling liquidity → Price moves higher
This explains why price frequently trades above an obvious high before falling or below an obvious low before rallying.
Why Conventional Chart Patterns Can Be Misleading
Traditional chart patterns often encourage traders to enter positions at obvious technical locations.
For example, a bull flag may attract retail buyers because price appears to be respecting support. However, when the higher-time-frame bias is bearish, the apparent bull flag may simply be a mechanism for attracting buying orders.
Those buying orders provide liquidity for institutional sellers.
The same problem may occur with:
- Trendline support
- Trendline resistance
- Double tops
- Double bottoms
- Head-and-shoulders patterns
- Breakout formations
- Conventional continuation patterns
The pattern itself is not necessarily useless. The problem occurs when it is traded without considering institutional order flow and higher-time-frame context.
The Market Maker Business Model
The ICT Market Maker Business Model explains how price may move through accumulation, expansion, distribution, and reversal.
A simplified bullish-to-bearish model may appear as:
Consolidation → Initial rally → Retracement → Second rally → Failure swing → Reversal → First decline → Retracement → Second decline
During the initial consolidation, institutions may accumulate long positions. Price is then moved higher through one or more expansion phases.
As price reaches a higher-time-frame resistance area, institutional longs may be distributed while short positions are established. Price then begins moving lower.
The opposite model develops when institutions accumulate shorts, move price lower, distribute those shorts, and begin building long positions.
Price does not need to form a perfectly symmetrical pattern. The important concept is the recurring sequence of:
- Order accumulation
- Price expansion
- Retracement
- Secondary expansion
- Distribution
- Reversal
- Expansion in the opposite direction
Understanding Price Fractals
Price action is fractal, meaning similar structures can appear across different time frames.
A market maker model visible on a daily chart may also appear on a four-hour, one-hour, or 15-minute chart.
Each time frame develops its own:
- Swing highs
- Swing lows
- Support levels
- Resistance levels
- Consolidations
- Expansion phases
- Liquidity pools
However, lower-time-frame fractals should remain subordinate to the higher-time-frame narrative.
A bullish formation on the five-minute chart may fail if it forms directly beneath daily resistance. A bearish formation may fail if it develops at major four-hour support.
The purpose of fractal analysis is therefore not to treat every time frame equally. It is to use smaller structures for execution while respecting the larger structure that controls price direction.
Fibonacci and the ICT Optimal Trade Entry
Volume 2 also introduces the concept of the ICT Optimal Trade Entry, commonly known as OTE.
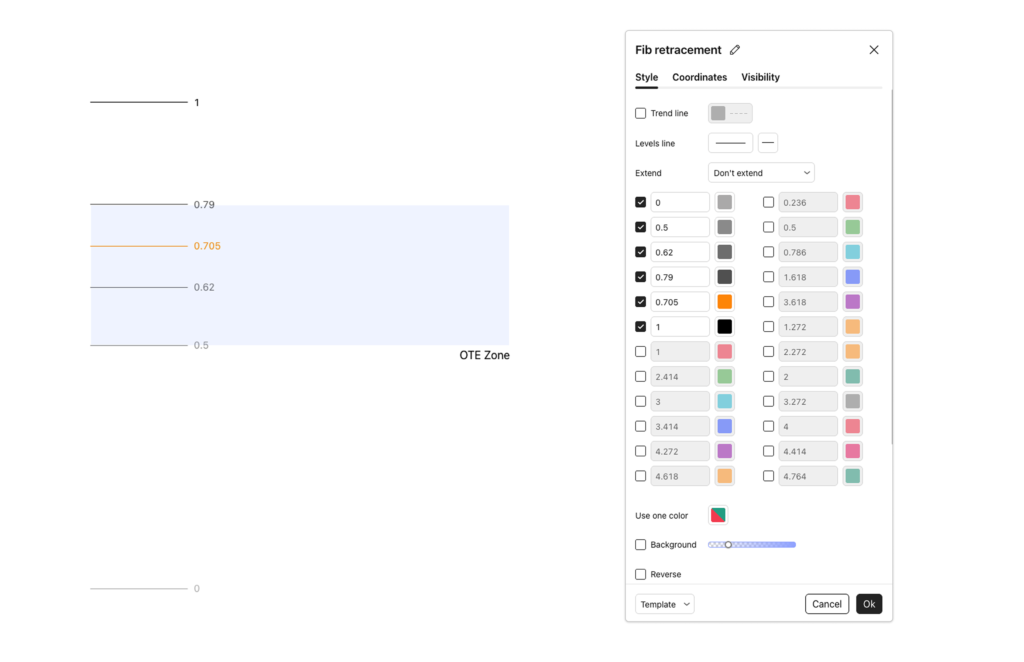
The OTE is based on a Fibonacci retracement into the area between:
- 62% retracement
- 70.5% retracement
- 79% retracement
The 70.5% level is often treated as the central sweet spot.
In bullish conditions, the Fibonacci tool is drawn from the relevant swing low to the swing high. The trader then watches for price to retrace into the OTE zone.
In bearish conditions, the tool is drawn from the swing high to the swing low. The trader watches for a retracement upward into the same zone.
The OTE becomes more meaningful when it overlaps with:
- Higher-time-frame support or resistance
- A round-number level
- An inversion level
- A previous session high or low
- A favorable Kill Zone
- The established directional bias
Fibonacci alone is not the trading setup. It is one component within a larger institutional framework.
A Practical Scout Sniper Analysis Process
A trader can apply the principles of the ICT Forex Scout Sniper Basic Field Guide – Vol. 2 through the following process.
Step 1: Determine the Higher-Time-Frame Bias
Study the daily and four-hour charts.
Decide whether price is more likely to seek higher liquidity or lower liquidity.
Step 2: Mark Major Price Levels
Identify:
- Previous highs and lows
- Swing points
- Institutional round numbers
- Repeated support and resistance
- Major candle-body and wick reactions
Step 3: Define the Expected Weekly Profile
For bearish conditions, watch for the weekly high to form early in the week.
For bullish conditions, watch for the weekly low to form early in the week.
Step 4: Identify the Liquidity
Mark obvious highs and lows where retail stops are likely resting.
Consider whether price may trade through those levels before moving in the anticipated direction.
Step 5: Wait for the Correct Session
Focus on the Asian, London, and New York sessions, particularly the major session openings and closings.
Step 6: Drop to the Execution Time Frame
After establishing the higher-time-frame narrative, use the 15-minute or five-minute chart to study:
- Market structure shifts
- Inversion levels
- Fibonacci retracements
- Displacement
- Session highs and lows
- Entry opportunities
Step 7: Manage Risk
Use a predefined stop loss and appropriate position size.
The objective is not to predict every movement perfectly. The objective is to apply the same process consistently while controlling losses.
Patience Is Part of the Trading Model
Many traders believe that successful trading requires constant market participation. The scout sniper framework teaches the opposite.
A high-quality institutional setup may require considerable waiting. Price must first reach an important higher-time-frame level before a lower-time-frame entry can become meaningful.
As Michael J. Huddleston states:
“Slow is good.”
Slower analysis gives the trader time to observe the market narrative, avoid impulsive decisions, and wait for institutional confirmation.
Patience is not simply a personality trait. It becomes a practical result of using higher-time-frame levels. When the trader refuses to act until price reaches a predetermined area, unnecessary trades are naturally reduced.
Study Price Before Searching for Trades
New traders often open their charts with the immediate intention of making money. This creates pressure to manufacture a setup even when no valid opportunity exists.
The better approach is to study historical price action.
Review how price behaved when it reached:
- Daily support
- Daily resistance
- Previous weekly highs or lows
- Institutional round numbers
- Session highs and lows
- Fibonacci retracement zones
- Liquidity above or below swing points
Repeated chart study trains the eye to recognize institutional behavior. Over time, the trader begins to identify familiar conditions without relying on random indicators or mechanical patterns.
The objective during this stage is not maximum profitability. It is developing a reliable understanding of price delivery.
Common Mistakes to Avoid
Traders applying this field guide should avoid several common errors.
Beginning With the Lower Time Frame
Do not search for a five-minute pattern and then attempt to find higher-time-frame evidence supporting it.
Begin with the higher-time-frame level and narrative.
Trading Every Price Movement
Not every rally should be bought, and not every decline should be sold.
Wait for price to reach an institutional location.
Expecting Exact Precision
Support and resistance should generally be treated as zones. Institutional orders may be distributed slightly above and below a round number.
Ignoring Time
A valid price level becomes more meaningful when it is reached during an important trading session.
Chasing Unrealistic Pip Targets
The goal is not to capture every pip between the weekly high and low.
Consistent portions of well-defined price swings are more practical than attempting to predict the entire weekly range.
Trading Without Risk Management
No price level or setup is guaranteed to hold. Stop-loss orders and controlled position sizing remain essential.
Final Thoughts
The ICT Forex Scout Sniper Basic Field Guide – Vol. 2 teaches traders how to combine price, time, market structure, institutional levels, liquidity, and disciplined observation.
The most important lesson is that lower-time-frame entries must be supported by a clear higher-time-frame premise. Traders should identify where institutional participants are likely conducting business, determine the probable weekly direction, observe how liquidity is being used, and wait for price to enter a favorable location.
The ICT (Inner Circle Trader) approach does not require predicting every market movement. It requires patiently identifying recurring institutional behavior and participating only when the conditions are properly aligned.
A trader who adopts the scout sniper mindset does not measure progress by the number of positions taken. Progress is measured by the quality of analysis, consistency of execution, discipline in risk management, and the ability to wait for a clearly defined opportunity.