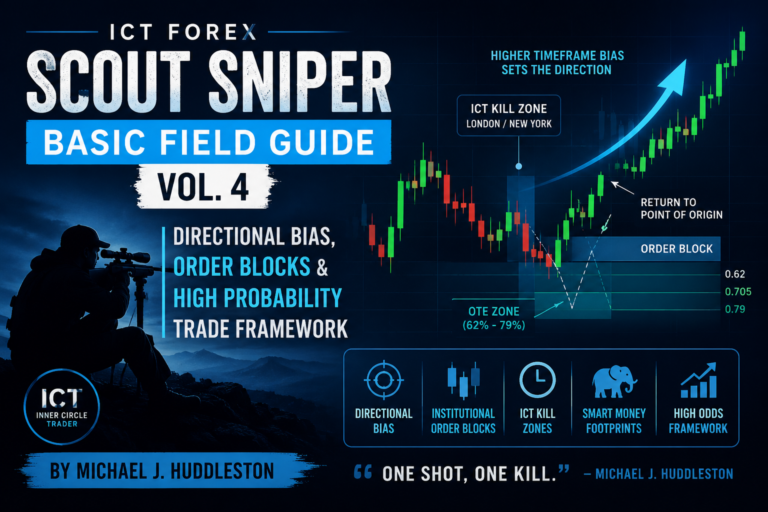
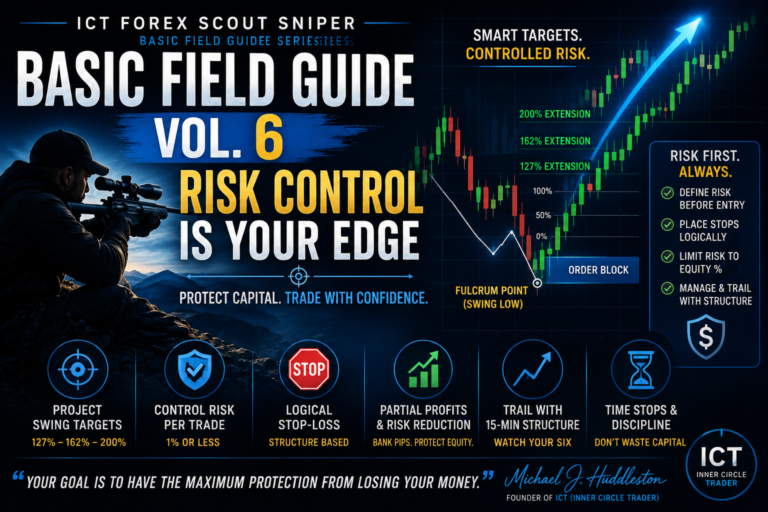
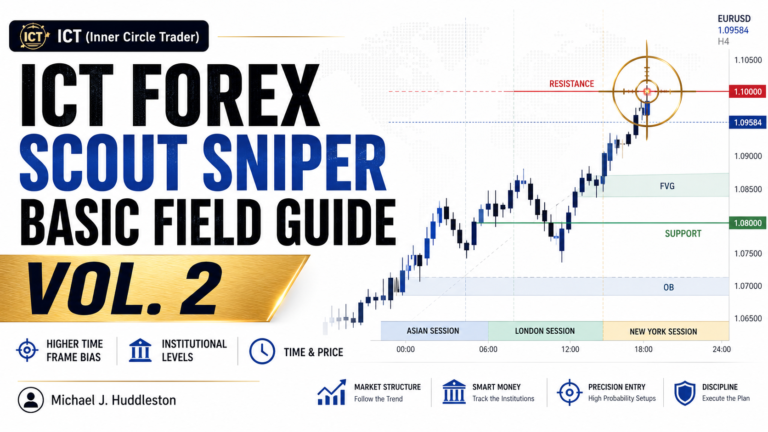
The ICT Forex Scout Sniper Basic Field Guide – Vol. 3 expands the trader’s understanding of how institutional price movements develop around higher-time-frame levels, specific trading sessions, liquidity, and market structure. These concepts were taught by Michael J. Huddleston, founder of the ICT (Inner Circle Trader) methodology, as part of the ICT Forex Scout Sniper Basic Field Guide Series.
This volume moves beyond basic chart observation and introduces a more structured method for framing trades. Instead of searching randomly for patterns on a five-minute chart, traders learn to begin with higher-time-frame support and resistance, establish directional bias, and then wait for a lower-time-frame setup during the London or New York Killzone.
The main objective is to understand where institutional traders are likely to participate and how price may be delivered from one liquidity level to another.
Higher-Time-Frame Reaction Levels
The foundation of the ICT Forex Scout Sniper Basic Field Guide – Vol. 3 is the identification of important reaction levels on the daily and four-hour charts.
These levels are significant because banks, large funds, and institutional traders generally base their decisions on higher-time-frame price structures. A level visible only on a one-minute or five-minute chart usually carries less importance than a clear daily or four-hour swing point.
Important reaction levels may be found around:
- Annual highs and lows
- Quarterly highs and lows
- Monthly highs and lows
- Weekly highs and lows
- Previous daily highs and lows
- Four-hour swing highs and lows
- Major consolidations
- Institutional round numbers
The trader should identify these levels before moving to an intraday chart.
Michael J. Huddleston explains:
“You do not look for a trade or trading pattern on your intraday charts unless it is trading at a higher-time-frame support or resistance level.”
This rule helps prevent traders from reacting to meaningless lower-time-frame patterns that are not supported by institutional context.
Why Higher-Time-Frame Levels Matter
Price patterns do not have equal value in every location.
A reversal pattern forming in the middle of an empty range is less meaningful than the same pattern forming at:
- A previous daily high
- A monthly low
- A four-hour resistance level
- An old institutional consolidation
- A known liquidity pool
Institutional traders require liquidity to enter and exit large positions. Previous highs, lows, and consolidations provide areas where orders are likely to accumulate.
When price approaches one of these levels, the trader can begin looking for evidence of:
- Rejection
- Liquidity sweeps
- Market structure shifts
- Displacement
- Optimal Trade Entry retracements
- Market maker accumulation or distribution
The lower-time-frame setup should therefore confirm a trading idea that was already developed from the higher time frame.
Using Daily Candle Data as Reaction Levels
Volume 3 also emphasizes the importance of studying the open, high, low, and close of candles forming important swing points.
When a daily swing high or swing low forms, traders should note the price values of the candles surrounding that turning point.
For a swing high, record:
- The open
- The high
- The low
- The close
The same process can be applied to a swing low.
These values can later act as sensitive reaction levels. Price may return to the opening price, closing price, high, or low of an important candle and react because institutional orders remain associated with that area.
The chart may initially become crowded with horizontal lines. Instead of keeping every level visible, traders can record them in a notebook and monitor them when price approaches the area.
Establishing Direction Before Looking for Entries
The trader should first determine whether the market is likely to move higher or lower.
Directional bias may be based on:
- Higher-time-frame market structure
- Previous highs and lows
- Reaction from support or resistance
- Interest-rate conditions
- Liquidity resting above or below price
- A break in market structure
- Market maker accumulation or distribution
After establishing a bearish bias, rallies should generally be treated as opportunities to look for shorts.
After establishing a bullish bias, retracements should generally be treated as opportunities to look for longs.
This approach is very different from buying simply because the market has been rising or selling because it has been declining.
A Scout Sniper trader waits for price to return to a predetermined level rather than chasing an already-expanded move.
Break in Market Structure
A break in market structure provides confirmation that the existing price direction may be changing.
For example, imagine that price forms:
Higher low → Higher high → Higher low → Higher high
This represents bullish structure.
If price then breaks below the previous meaningful low, the bullish structure has weakened. A later rally may be viewed as a potential selling opportunity rather than an automatic continuation higher.
In a bearish scenario, the sequence may be:
Lower high → Lower low → Lower high → Lower low
If price breaks above a meaningful previous high, it may indicate a bullish shift.
After the structure breaks, the trader can use the new price swing to identify a retracement area for entry.
ICT Optimal Trade Entry
Once directional bias and market structure align, the trader can measure the latest price swing with the Fibonacci retracement tool.
For a bearish setup:
Swing high → Swing low → Retracement → Potential short
For a bullish setup:
Swing low → Swing high → Retracement → Potential long
The ICT Optimal Trade Entry area is generally found between:
- 62% retracement
- 70.5% retracement
- 79% retracement
The 70.5% level is often referred to as the ICT sweet spot.
However, a Fibonacci retracement should not be used as a standalone signal. It should align with other conditions such as:
- Higher-time-frame resistance or support
- An old high or low
- A broken support or resistance level
- A Killzone
- An institutional round number
- A market structure shift
The more relevant conditions that align at the same location, the stronger the potential setup becomes.
Interest Rates and Currency Direction
Volume 3 introduces interest rates as an important macroeconomic influence on currency prices.
Interest rates affect where global capital flows. Investors and institutions generally seek markets offering more attractive returns, which means currencies can move in response to changing bond yields.
Huddleston states:
“Interest rates are the driving force.”
One way to observe this relationship is through the US 10-year Treasury note and its yield.
The relationship between Treasury-note futures and yields is inverse:
10-year Treasury-note futures rise → Yield declines
10-year Treasury-note futures fall → Yield rises
Currencies may respond to rising or falling yields as institutional capital moves toward markets offering better returns.
This does not mean every currency will move immediately with a bond yield. However, yields can help the trader understand the higher-time-frame market tide.
Interest-Rate Differentials
Looking at one country’s yield alone provides limited information. A more complete analysis compares the yields of the countries connected to a currency pair.
For EUR/USD, a trader may compare:
- US 10-year yield
- German 10-year yield
For GBP/USD, the comparison may include:
- US 10-year yield
- UK 10-year yield
When the yield of one country strengthens relative to another, institutional capital may favour that country’s currency.
The trader is not trying to predict every minor yield movement. The purpose is to identify the larger macroeconomic direction and avoid trading aggressively against it.
Selecting the Correct Time Frames
The ICT (Inner Circle Trader) approach uses multiple time frames to connect market direction with entry execution.
Position Trading
Monthly chart → Higher-time-frame context
Weekly chart → Market structure and reaction levels
Daily chart → Entry framework
Swing Trading
Daily chart → Directional bias
Four-hour chart → Setup formation
One-hour chart → Entry refinement
Short-Term Trading
Four-hour chart → Directional context
One-hour chart → Structure and reaction levels
15-minute chart → Execution
Day Trading and Scalping
One-hour chart → Directional context
15-minute chart → Setup structure
Five-minute chart → Entry execution
The purpose of using three time frames is to prevent the trader from making decisions based only on lower-time-frame noise.
Range Contraction and Expansion
Markets tend to move through a repeating cycle:
Consolidation → Expansion → Consolidation → Expansion
During consolidation, price moves within a relatively narrow range. This is where institutional traders may accumulate or distribute positions.
After sufficient orders have been established, price may expand aggressively in one direction.
Retail traders frequently make the mistake of chasing the expansion after it has already occurred. The more disciplined approach is to study the consolidation and anticipate where the next expansion may begin.
Huddleston explains:
“Smart money accumulates during consolidations.”
The trader should therefore pay close attention when daily ranges begin becoming smaller.
A series of contracting ranges may indicate that the market is preparing for a larger move.
The ICT Power of Three
The Power of Three describes the basic process through which a trading range may develop:
Accumulation → Manipulation → Distribution
Accumulation
Price remains within a relatively narrow range while orders build on both sides of the market.
Manipulation
Price moves temporarily in the wrong direction, often sweeping a short-term high or low and triggering stops.
Distribution
After liquidity has been collected, price expands strongly toward the intended objective.
In a bullish daily profile, price may:
Open → Move below the opening price → Form the daily low → Expand higher
In a bearish daily profile, price may:
Open → Move above the opening price → Form the daily high → Expand lower
The false move around the opening price is often the manipulation phase.
Understanding the Daily Range
On a strong bullish day, the opening price is often located near the lower portion of the daily range, while the closing price forms closer to the high.
A bullish daily profile may look like:
Daily open → Brief decline → Daily low → Strong rally → Close near the high
A bearish daily profile may look like:
Daily open → Brief rally → Daily high → Strong decline → Close near the low
This does not happen perfectly every day. However, understanding the relationship between the open, high, low, and close can help the trader anticipate where the main expansion may occur.
The daily opening price can therefore act as an important filter.
When bullish, traders generally want to buy close to or below the daily opening price.
When bearish, traders generally want to sell close to or above the daily opening price.
ICT Killzones
The ICT Killzones are specific windows of time when institutional trading activity frequently produces meaningful intraday highs, lows, and price expansions.
Volume 3 focuses mainly on the London and New York Killzones.
London Killzone
The simplified London Killzone taught in this volume is:
06:00–10:00 GMT
During this period, traders should watch for:
- The daily high or low
- A liquidity sweep
- A reaction from a higher-time-frame level
- A market structure shift
- An Optimal Trade Entry
- The beginning of the main daily expansion
New York Killzone
The simplified New York Killzone is:
12:00–15:00 GMT
The New York session may:
- Continue the London move
- Retrace the London expansion
- Produce a second entry
- Reverse from a higher-time-frame level
- Complete the daily range
The Killzone is not a standalone entry signal. It provides the time window in which an already-planned setup should develop.
A complete trading idea should combine:
Higher-time-frame level + Directional bias + Killzone + Lower-time-frame confirmation
Why the New York Killzone Is Important
The New York session has the benefit of seeing what occurred during London.
If London already expanded in the expected higher-time-frame direction, New York may provide a retracement and continuation entry.
For example:
Bearish daily bias → London expands lower → New York retraces into resistance → Short continuation
Bullish daily bias → London expands higher → New York retraces into support → Long continuation
The New York session can therefore provide a second opportunity when the original London setup was missed.
ICT Market Maker Buy Model
The ICT Market Maker Buy Model illustrates how price may be accumulated at lower prices before expanding upward.
A simplified structure is:
Consolidation → Decline → Support reaction → Market structure shift → Retracement → Expansion higher
Price may initially break below a consolidation and create the appearance of bearish continuation. After reaching a higher-time-frame support level, price reverses and breaks bullish market structure.
The later retracement may provide the buying opportunity.
The final objective is often above the original consolidation, where buy-side liquidity rests.
ICT Market Maker Sell Model
The ICT Market Maker Sell Model is the inverse process.
A simplified structure is:
Consolidation → Rally → Resistance reaction → Market structure shift → Retracement → Expansion lower
Price may move above a consolidation and encourage retail traders to buy the apparent breakout.
At higher-time-frame resistance, institutional traders may distribute positions. Price then breaks lower, retraces, and provides a potential short entry.
The final objective may be below the original consolidation, where sell-side liquidity rests.
How Dealers Use Liquidity
Dealers and market makers require opposite orders to complete large transactions.
Above the current market price, liquidity may include:
- Protective buy stops from short sellers
- Buy-stop entries from breakout traders
- Sell-limit orders from profitable long positions
Below the current market price, liquidity may include:
- Protective sell stops from long traders
- Sell-stop entries from breakout traders
- Buy-limit orders from profitable short positions
Price may move toward these orders because they provide the liquidity needed for institutional transactions.
This explains why price frequently moves slightly above an obvious high or below an obvious low before reversing.
Institutional Price Levels
Institutional traders frequently operate around round-number price levels.
Important levels include:
- Full figures
- Mid-figures
- 20 levels
- 80 levels
- Smaller 10-point intervals
For example, around 1.3200, traders should not assume price must reverse exactly at 1.3200.
Price may trade toward:
- 1.3190
- 1.3200
- 1.3210
- 1.3220
These nearby levels may contain clusters of stops and pending orders.
A trader should therefore think in terms of a price zone rather than expecting perfect reactions from a single exact number.
Avoid Trading During Uncertainty
Periods of major geopolitical or economic uncertainty may produce:
- Range-bound trading
- Erratic price spikes
- Reduced institutional participation
- Longer holding periods
- Unexpected volatility
During these conditions, traders should consider:
- Reducing risk
- Reducing leverage
- Trading only near major higher-time-frame levels
- Avoiding entries in the middle of a range
- Lowering profit expectations
- Waiting for clearer confirmation
The market may still provide opportunities, but precision becomes even more important.
Practical Trading Framework
The concepts in ICT Forex Scout Sniper Basic Field Guide – Vol. 3 can be organized into a repeatable process.
Step 1: Determine the Higher-Time-Frame Direction
Study the daily and four-hour charts.
Step 2: Mark Important Reaction Levels
Identify previous highs, lows, consolidations, and institutional price levels.
Step 3: Consider the Interest-Rate Environment
Observe whether yield conditions support or oppose the directional bias.
Step 4: Wait for Price to Reach the Level
Do not chase price in the middle of the range.
Step 5: Focus on a Killzone
Monitor the London or New York session.
Step 6: Observe Liquidity
Look for a sweep above a high or below a low.
Step 7: Wait for Market Structure to Shift
Allow price to confirm the intended direction.
Step 8: Measure the Retracement
Use the 62%, 70.5%, and 79% levels to refine the entry.
Step 9: Target Opposing Liquidity
Aim for previous highs, previous lows, or the opposite side of the dealing range.
Step 10: Manage Risk
Use controlled risk and practise the process in a demo account.
Homework: Stalking the Killzones
The practical assignment from Volume 3 is to observe the London and New York Killzones for at least one week.
Mark the following windows on the chart:
- London Killzone: 06:00–10:00 GMT
- New York Killzone: 12:00–15:00 GMT
For each day, record:
- The higher-time-frame directional bias
- The nearest support or resistance level
- The London high and low
- The New York high and low
- Any liquidity sweep
- Any market structure shift
- Any Optimal Trade Entry
- The final daily high and low
- The session that created the largest move
The purpose is not to force a trade every day. The goal is to observe how time and price interact around institutional levels.
Final Thoughts
The ICT Forex Scout Sniper Basic Field Guide – Vol. 3 teaches traders to stop searching randomly for lower-time-frame patterns and begin thinking from an institutional perspective.
The strongest trading opportunities are generally created when several elements align:
Higher-time-frame reaction level → Directional bias → Killzone → Liquidity sweep → Market structure shift → Retracement entry → Liquidity target
The market maker models explain how price may move away from a consolidation, collect liquidity, reverse, and then deliver toward the opposite side of the range.
Interest rates provide the broader market tide, higher-time-frame levels identify where institutions may become active, and Killzones narrow the time in which a setup is most likely to appear.
The Scout Sniper approach is therefore not based on trading frequently. It is based on waiting for price to reach the correct location, during the correct time window, and then acting only after the market confirms the planned direction.