The ICT Forex Scout Sniper Basic Field Guide – Vol. 5 teaches traders how to identify meaningful price ranges, refine institutional entry zones, and project realistic profit targets. These concepts were taught by Michael J. Huddleston, founder of the ICT (Inner Circle Trader) methodology, as part of the ICT Forex Scout Sniper Basic Field Guide Series.
This volume is titled Range Finding because accurate trading depends on correctly identifying the price swing or dealing range currently controlling the market.
Once the trader understands the active range, it becomes easier to determine:
- Where institutional buying or selling may occur
- Where an Optimal Trade Entry may form
- Which price level should invalidate the setup
- Where partial or final profits should be taken
- How far price may reasonably expand
The central idea is that traders should not enter or exit trades randomly. Both the entry and target should be based on clearly defined price reference points.
What Is Range Finding in ICT Trading?
Range finding is the process of identifying the meaningful high and low that define the current price swing.
A valid range may be created by:
- A swing low and swing high
- A swing high and swing low
- An institutional order block
- A major support or resistance level
- A full figure or mid-figure
- A displacement move
- A recent break in market structure
Once the correct range has been identified, the trader can use it to measure retracements and project future price objectives.
In a bullish market:
Range low → Range high → Retracement → Buying opportunity
In a bearish market:
Range high → Range low → Retracement → Selling opportunity
The challenge is not using the Fibonacci tool. The challenge is selecting the correct price references.
Tracking Institutional Price Action
The previous lessons in the series established that traders should begin with the daily and four-hour charts.
These higher time frames help identify:
- Institutional order blocks
- Important swing points
- Market structure shifts
- Major support and resistance
- Areas where displacement originated
- Price levels likely to produce reactions
After identifying these levels, traders can move to the lower time frame and look for a refined entry.
The correct process is:
Higher-time-frame order block → Lower-time-frame range → Optimal Trade Entry → Target projection
This creates a structured trading model rather than relying on isolated candlestick patterns.
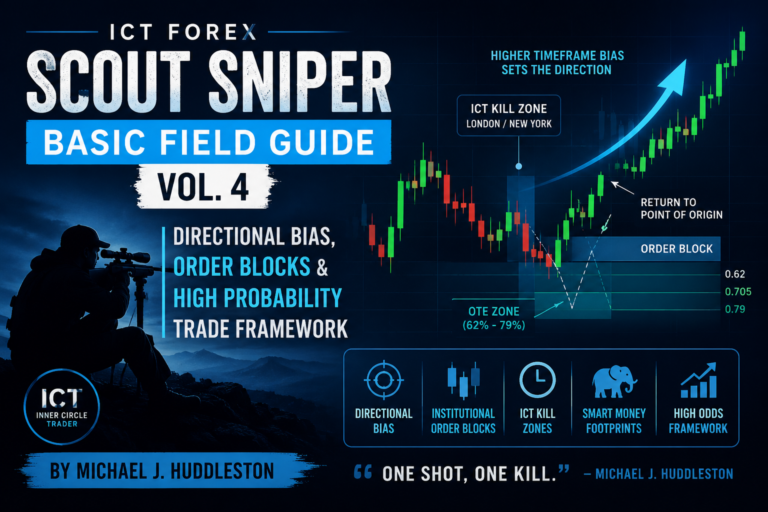
Bullish ICT Order Block
A bullish order block is commonly identified as the final bearish candle or group of bearish candles before a strong bullish expansion.
The expansion should create meaningful displacement and preferably break previous market structure.
A simplified bullish order block sequence is:
Bearish candle → Strong rally → Break of structure → Retracement into the bearish candle
When price returns to the order block, traders should not automatically enter.
They should also consider:
- Is the higher-time-frame bias bullish?
- Did price break a meaningful swing high?
- Is the order block inside discount?
- Does it align with an institutional price level?
- Is there a lower-time-frame Optimal Trade Entry?
- Is the previous structural low still protected?
The order block identifies an area of interest. The lower-time-frame price pattern refines the entry.
Bearish ICT Order Block
A bearish order block is generally the final bullish candle or group of bullish candles before a strong bearish displacement.
A simplified bearish sequence is:
Bullish candle → Strong decline → Break of structure → Retracement into the bullish candle
If price returns to the order block while the market remains bearish, the area may provide a short-selling opportunity.
The strongest bearish order blocks often align with:
- Premium pricing
- Previous resistance
- An old swing high
- A full figure or mid-figure
- A bearish market structure shift
- An Optimal Trade Entry retracement
Michael J. Huddleston emphasizes that candlestick patterns have little value when used alone:
“A candlestick pattern alone means nothing.”
The location and higher-time-frame context give the pattern its importance.
Order Blocks Are Universal
The concepts taught in Volume 5 are not limited to EUR/USD or GBP/USD.
Order blocks, retracements, institutional levels, and price projections can appear in:
- Major currency pairs
- Cross-currency pairs
- Yen pairs
- Commodities
- Indices
- Other liquid markets
However, every market has its own personality.
For example, European currencies may commonly produce meaningful daily highs or lows during the London session, while AUD/JPY may show more important movement during the Asian session.
The method remains the same, but the active trading session may change depending on the pair.
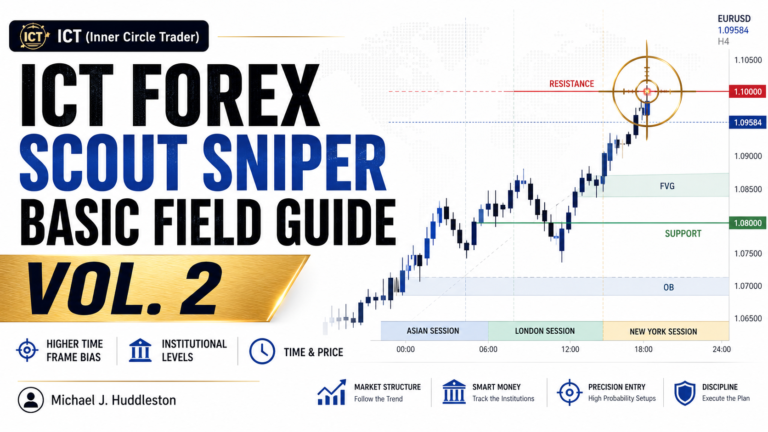
Institutional Price Levels
ICT analysis pays close attention to recurring institutional price levels.
Important levels include:
- Full figures ending in 00
- Mid-figures ending in 50
- Institutional levels ending in 20
- Institutional levels ending in 80
- Smaller round numbers ending in 10 or 60
For example, if price is trading near 1.3450, nearby institutional reference points may include:
- 1.3420
- 1.3450
- 1.3480
- 1.3500
These numbers can help calibrate order blocks and retracement ranges.
Price does not always reverse exactly at an institutional level. Traders should treat these areas as zones where liquidity and institutional interest may exist.
ICT Optimal Trade Entry
The ICT Optimal Trade Entry, or OTE, is a retracement zone found within a defined price swing.
The main retracement levels are:
- 62%
- 70.5%
- 79%
The 70.5% level is frequently referred to as the sweet spot.
For a bullish setup:
Swing low → Swing high → Retracement into 62%–79% → Long opportunity
For a bearish setup:
Swing high → Swing low → Retracement into 62%–79% → Short opportunity
OTE becomes more significant when it overlaps with:
- A higher-time-frame order block
- A round number
- A previous swing level
- A Killzone
- Discount in a bullish market
- Premium in a bearish market
Fibonacci alone does not create the trade. It refines an already-valid institutional setup.
Hidden Optimal Trade Entry
One of the most important concepts in ICT Forex Scout Sniper Basic Field Guide – Vol. 5 is the Hidden Optimal Trade Entry.
A standard OTE measures a range that price has already traded through.
A Hidden OTE may use a nearby institutional or psychological level that price has not yet reached as one side of the range.
For example, imagine price is bullish and trading above a 1.3450 mid-figure.
The trader may:
- Use 1.3450 as the lower reference point.
- Use the recent short-term high as the upper reference point.
- Measure the range between them.
- Monitor the 62%–79% retracement zone.
- Look for price to reverse before reaching 1.3450.
The premise is that support should hold before price fully reaches the institutional reference level.
Huddleston explains the idea as:
“It’s still an Optimal Trade Entry. It’s a retracement within a range.”
This method can help traders identify entries that may not be obvious through traditional swing-to-swing Fibonacci analysis.
How to Find a Hidden OTE
Use the following process in a bullish setup.
Step 1: Establish Bullish Direction
Confirm that higher-time-frame market structure supports higher prices.
Step 2: Identify a Bullish Order Block
Mark the bearish candle before the institutional expansion.
Step 3: Find the Nearest Institutional Level
Look for a nearby full figure, mid-figure, 20 level, or 80 level.
Step 4: Identify the Recent High
Use the highest price formed before the retracement begins.
Step 5: Measure the Unfulfilled Range
Anchor the Fibonacci tool between the institutional level and the recent high.
Step 6: Monitor the OTE Zone
Watch the 62%, 70.5%, and 79% retracement levels.
Step 7: Confirm With Price Action
Look for rejection, displacement, or a lower-time-frame structure shift.
The process is reversed for a bearish setup.
Why Hidden OTE Works
Hidden OTE is based on the idea that markets react around psychological and institutional levels.
If institutional traders have already accumulated positions above a full figure or mid-figure, price may not need to trade completely back to that level.
Instead, it may retrace partially into the implied range, rebalance orders, and continue in the original direction.
The setup is strongest when the hidden OTE overlaps with:
- A higher-time-frame order block
- Existing market structure
- A session-based entry window
- A previous consolidation
- A clear liquidity objective
It should be tested repeatedly in historical and demo charts before being used in live conditions.
Price Swings Within Price Swings
Markets contain multiple levels of structure.
A large bullish move may contain several smaller bullish and bearish swings.
These can be classified as:
- Short-term swings
- Intermediate-term swings
- Long-term swings
The selected swing should match the type of trade being taken.
A scalper may use a five-minute swing.
A day trader may use a 15-minute or one-hour swing.
A swing trader may use a four-hour or daily swing.
Using a price swing that is too small may produce insignificant targets. Using one that is too large may create unrealistic objectives.
The 50% Rule of Symmetrical Price Swings
Volume 5 introduces the 50% rule of symmetrical price movement.
The market frequently produces measured moves where one price swing is repeated after a meaningful high or low is broken.
For a bullish projection:
Previous high − Previous low = Swing range
Break above previous high → Project the same range upward
For a bearish projection:
Previous high − Previous low = Swing range
Break below previous low → Project the same range downward
The broken swing point becomes a fulcrum or hinge from which the next expansion is measured.
A 100% symmetrical projection represents a complete measured move.
However, ICT traders generally use more conservative Fibonacci objectives before expecting the full measured move.
Understanding the Price Swing Fulcrum
A fulcrum is a meaningful swing high or swing low that separates one price move from the next.
In a bullish market, a swing high may act as the fulcrum.
Once price breaks above it, the trader can project targets based on the preceding retracement range.
In a bearish market, a swing low may act as the fulcrum.
Once price breaks below it, the preceding corrective range can be projected lower.
The fulcrum helps the trader answer:
- Which swing should be measured?
- When has the projection become active?
- Where should profits be expected?
- When has the market failed to deliver?
ICT Fibonacci Target Extensions
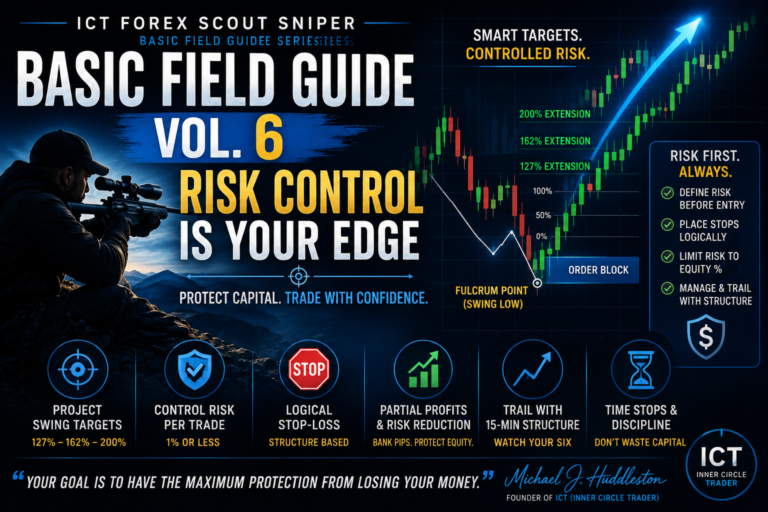
The primary target extensions taught in Volume 5 are:
- 127%
- 162%
- 200%
These levels are calculated from the corrective swing that forms before the market continues in the expected direction.
127% Extension
The 127% extension is the first major projected objective.
It is generally the more conservative target and may be appropriate for taking partial profits.
162% Extension
The 162% extension is a deeper target and frequently provides a strong level for closing most or all of the position.
200% Extension
The 200% extension represents a complete symmetrical measured move.
It may be reached during strong market conditions, but traders should not expect it on every setup.
Huddleston advises traders to focus primarily on the closer objectives:
“I’m conditioning you really to expect 127 and 162 extensions because they are very consistent.”
How to Project Bullish Targets
Assume price produces a bullish impulse followed by a retracement.
The process is:
- Identify the high of the impulse.
- Identify the low of the retracement.
- Draw the Fibonacci tool from the high down to the low.
- Mark the 127% extension.
- Mark the 162% extension.
- Use the 200% extension only as an extended target.
The trader can then place predetermined take-profit orders at these levels.
A practical bullish plan may be:
- Partial profit at 127%
- Majority of profit at 162%
- Small remaining position toward 200%
The exact distribution should match the trader’s risk plan.
How to Project Bearish Targets
For a bearish setup:
- Identify the low of the bearish impulse.
- Identify the high of the retracement.
- Draw the Fibonacci tool from the low up to the high.
- Mark the 127% extension below price.
- Mark the 162% extension below price.
- Treat 200% as an extended objective.
A practical bearish plan may be:
- Partial profit at 127%
- Majority of profit at 162%
- Small remaining position toward 200%
Using predetermined targets helps reduce emotional decision-making.
Target Selection Begins Before Entry
The profit target should be identified before placing the trade.
A complete setup should include:
- Entry price
- Stop-loss level
- First target
- Final target
- Risk-to-reward ratio
- Conditions that invalidate the trade
Without a predetermined exit, traders may hold profitable positions too long, exit too early, or constantly change objectives.
Huddleston explains:
“If you do not have a predetermined exit point before you even get in the trade, I promise you, you will be plagued with this problem.”
Target selection is therefore part of the original trade plan, not a decision made after the trade becomes profitable.
You Do Not Need Every Pip
One of the strongest lessons in Volume 5 is that profitable trading does not require capturing the entire market move.
A trader may close a position at the planned 162% extension and later watch price continue another 100 pips.
That does not make the trade incorrect.
The trader:
- Identified a setup
- Executed according to plan
- Managed risk
- Reached the target
- Closed with a profit
The remaining move belonged to another trading opportunity.
Huddleston states:
“You do not need every piece of that move. You don’t need every pip in every swing.”
Consistency is more important than capturing the exact high or low.
The One-Shot, One-Kill Approach
The Scout Sniper framework is designed to help traders become selective.
The objective is not to trade every day.
The developing trader should learn to identify one high-quality setup during the week.
A complete one-shot, one-kill setup may include:
Higher-time-frame bias → Institutional order block → OTE or Hidden OTE → Lower-time-frame confirmation → 127% and 162% targets
This process develops:
- Patience
- Rule-based execution
- Target discipline
- Risk control
- Confidence in analysis
A trader who cannot follow one weekly setup may struggle to control themselves when attempting several daily trades.
Practical Range-Finding Framework
The concepts from ICT Forex Scout Sniper Basic Field Guide – Vol. 5 can be combined into the following process.
Step 1: Determine Direction
Use daily and four-hour structure to establish bullish or bearish bias.
Step 2: Mark Institutional Order Blocks
Identify the candle or consolidation that produced displacement.
Step 3: Identify Institutional Levels
Note nearby full figures, mid-figures, 20 levels, and 80 levels.
Step 4: Define the Active Price Swing
Select the meaningful swing high and swing low.
Step 5: Measure the Retracement
Use the 62%, 70.5%, and 79% OTE levels.
Step 6: Check for Hidden OTE
Measure from a nearby institutional level when appropriate.
Step 7: Refine on a Lower Time Frame
Look for displacement, rejection, or a shift in market structure.
Step 8: Identify the Fulcrum
Determine which high or low must break to activate the target projection.
Step 9: Project Targets
Calculate the 127%, 162%, and optional 200% extensions.
Step 10: Execute the Plan
Enter, manage risk, and exit at predetermined levels without chasing additional profit.
Homework: Projecting Swing Targets
To practise the Volume 5 concepts, choose one currency pair and study at least 20 historical setups.
For each setup, mark:
- Higher-time-frame direction
- Bullish or bearish order block
- Institutional price level
- Active dealing range
- Standard OTE
- Hidden OTE, when applicable
- Entry level
- Structural invalidation
- Swing fulcrum
- 127% target
- 162% target
- 200% target
- Actual price reaction
Record whether price:
- Reached the 127% extension
- Reached the 162% extension
- Reached the 200% extension
- Reversed before the target
- Violated the order block
- Failed to confirm market structure
This exercise helps develop realistic expectations about how frequently each target is reached.
Final Thoughts
The ICT Forex Scout Sniper Basic Field Guide – Vol. 5 connects institutional entries with systematic profit-taking.
The trader first identifies a higher-time-frame order block and establishes directional bias. The active range is then measured to find a standard or Hidden Optimal Trade Entry. Once the trade begins moving in the intended direction, symmetrical price swings and Fibonacci extensions provide predetermined exit levels.
The complete model is:
Higher-time-frame direction → Order block → Range finding → OTE or Hidden OTE → Market structure confirmation → 127% target → 162% target
The 200% extension may offer an extended objective, but the 127% and 162% levels are generally more consistent.
The most important lesson is not to capture every pip. The trader’s responsibility is to identify the correct range, enter according to a defined model, manage risk, and exit at a target selected before the trade begins.