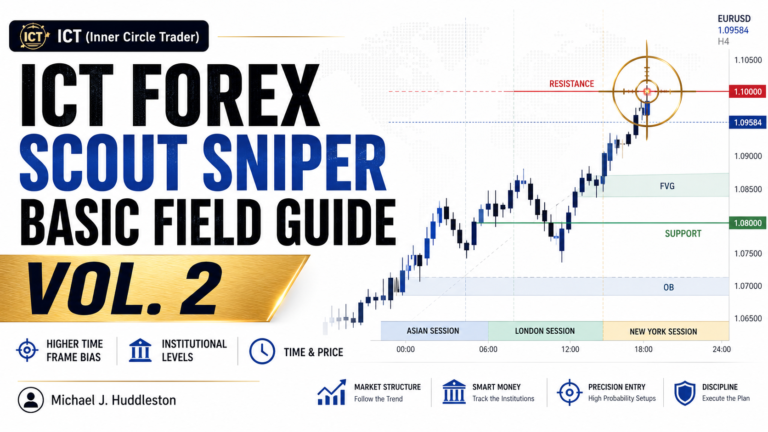
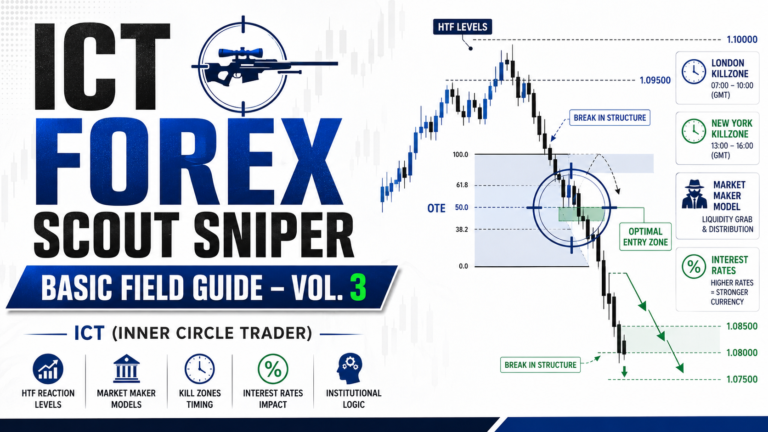
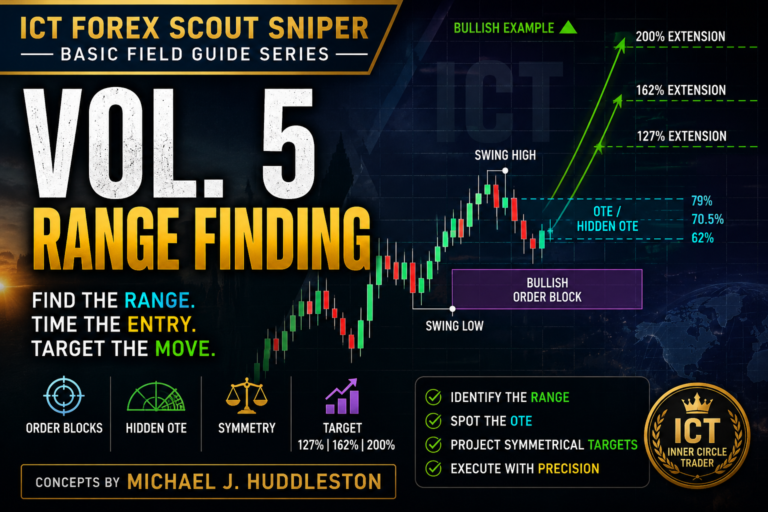
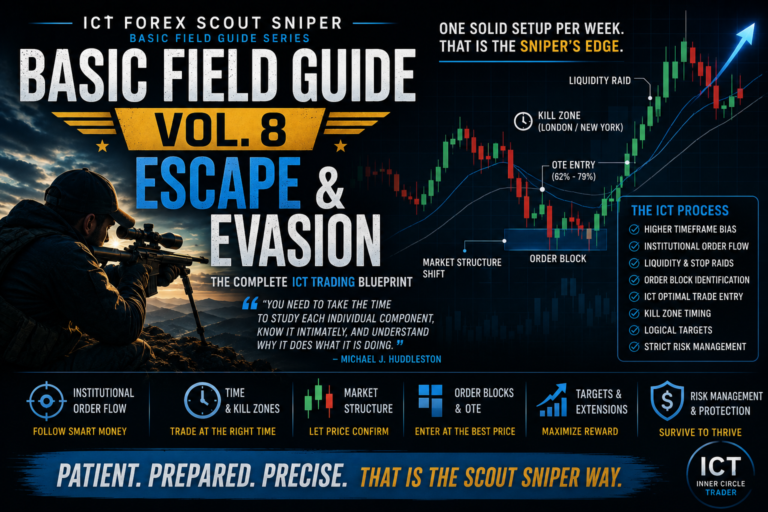
The ICT Forex Scout Sniper Basic Field Guide – Vol. 4, developed and taught by Michael J. Huddleston, explains how traders can combine directional bias, ICT Kill Zones, institutional order flow, market structure, order blocks, and Optimal Trade Entry concepts into a practical trading framework. This concept is taught in the ICT Forex Scout Sniper Basic Field Guide Series and is designed to help traders focus on a small number of high-quality opportunities rather than constantly entering the market.
The central idea is simple: traders should first determine what the higher-time-frame market is likely to do, then wait for price to retrace into an institutional area during a favorable trading session.
As Michael J. Huddleston explains:
“This whole series is delving into the importance of having, number one, a predetermined plan of attack.”
What Is the Main Purpose of Volume 4?
Volume 4 teaches traders how to build a high-probability trade framework.
A trade is not considered high probability simply because a pattern appears on a 15-minute or five-minute chart. It becomes more favorable when several elements agree:
- Higher-time-frame directional bias
- Institutional momentum
- Market structure
- Order flow
- Support or resistance
- Institutional order blocks
- ICT Optimal Trade Entry
- Time of day
- Day of the week
- Liquidity and stop placement
The purpose of the model is not to capture every market movement. It is to identify one or two strong opportunities during the week and avoid unnecessary exposure.
Michael J. Huddleston describes the approach as:
“One shot, one kill.”
This does not mean every trade will win. It means the trader waits patiently for a setup that meets a clearly defined set of conditions.
Begin With Directional Bias
Directional bias is the foundation of the ICT Forex Scout Sniper Basic Field Guide – Vol. 4.
Before looking for a trade, the trader must decide whether the market is more likely to move higher or lower.
When the higher-time-frame bias is bullish, the trader should mainly search for buying opportunities.
When the higher-time-frame bias is bearish, the trader should mainly search for selling opportunities.
This does not mean that price will move in one direction without retracing. It means the trader uses short-term moves against the dominant direction as potential entry opportunities.
Bullish framework:
Higher-time-frame bullish bias → Price retraces lower → Institutional support is found → Trader looks to buy
Bearish framework:
Higher-time-frame bearish bias → Price rallies higher → Institutional resistance is found → Trader looks to sell
The trader is therefore buying declines in an uptrend and selling rallies in a downtrend.
Interest Rates and Currency Direction
Volume 4 briefly connects currency direction with movements in interest rates and Treasury futures.
When the price of the 10-year Treasury futures contract declines, yields generally rise. Rising yields may place pressure on the US dollar and support foreign currencies, depending on the broader market environment.
When Treasury futures rise, yields generally decline. This can support the US dollar and pressure foreign currencies.
The relationship can be simplified as:
10-year Treasury futures falling → Yields rising → Potentially bearish US dollar → Potentially bullish foreign currencies
10-year Treasury futures rising → Yields falling → Potentially bullish US dollar → Potentially bearish foreign currencies
This information is not intended to replace technical analysis. It provides a broader framework that may help the trader understand the institutional environment behind price movement.
Why Traders Should Focus on One Side of the Market
Once directional bias is established, the trader should give more attention to the side supported by the higher-time-frame narrative.
For example, when the daily market structure is bullish, traders may still find short-term selling opportunities. However, those shorts are moving against the dominant institutional flow.
The more logical approach is to wait for price to decline into support and look for a long entry.
Michael J. Huddleston warns traders not to fight the dominant market force:
“You just don’t fight the tide.”
Trading with the tide reduces the need to predict exact tops and bottoms. It allows the trader to participate in the direction already supported by institutional activity.
The ICT No-Brainer Directional Bias Model
Volume 4 introduces a simple method for traders who struggle to identify directional bias visually.
The model uses two exponential moving averages on the daily chart:
- 9-period exponential moving average
- 18-period exponential moving average
Bullish Framework
When the 9-period EMA is above the 18-period EMA, the trader adopts a bullish framework.
The trader looks for:
- Declines into support
- Bullish order blocks
- Retracements into an OTE zone
- Bullish market structure
- Long setups during London or New York Kill Zones
Bearish Framework
When the 9-period EMA is below the 18-period EMA, the trader adopts a bearish framework.
The trader looks for:
- Rallies into resistance
- Bearish order blocks
- Retracements into an OTE zone
- Bearish market structure
- Short setups during London or New York Kill Zones
The moving averages are not used as automatic entry signals. They provide a visual framework for identifying the dominant institutional momentum.
Combining Moving Averages With Market Structure
The EMA framework becomes more effective when it agrees with market structure.
Bullish market structure is visible when price:
- Breaks above a previous swing high
- Creates higher swing lows
- Continues making higher highs
- Respects institutional support
Bearish market structure is visible when price:
- Breaks below a previous swing low
- Creates lower swing highs
- Continues making lower lows
- Respects institutional resistance
A high-probability bullish condition may therefore include:
9 EMA above 18 EMA → Previous swing high is broken → Price retraces → Bullish order block holds → Price continues higher
A bearish condition may include:
9 EMA below 18 EMA → Previous swing low is broken → Price rallies → Bearish order block holds → Price continues lower
The moving averages define the broader framework, while market structure confirms whether price is currently delivering in the expected direction.
Understanding Swing Highs and Swing Lows
A swing high forms when a candle has a lower high on both sides.
A swing low forms when a candle has a higher low on both sides.
These swing points help the trader identify changes in market structure.
When price breaks above a meaningful swing high, it may indicate bullish institutional sponsorship.
When price breaks below a meaningful swing low, it may indicate bearish institutional sponsorship.
The trader should not rely entirely on an automatic fractal indicator because some indicators require five candles to confirm a swing. ICT analysis may use a simpler three-candle structure.
Swing high:
Lower high → Highest high → Lower high
Swing low:
Higher low → Lowest low → Higher low
These formations help traders identify the exact point where market structure may shift.
Why Markets Move
Major market movements are not created by individual retail traders.
Large banks, funds, investment firms, and institutional participants possess enough trading volume to move price significantly. Their presence creates visible footprints in the market.
Michael J. Huddleston compares this to an elephant entering a small swimming pool. A child may create a small splash, but an elephant causes a major displacement of water.
Institutional footprints may include:
- Strong displacement candles
- A rapid break of a swing high or low
- Several hundred pips of directional movement
- Repeated support at the same price area
- Sharp reversals after liquidity is taken
- Consolidations followed by aggressive expansion
The trader’s job is not to move the market. The trader’s job is to identify what institutional participants are doing and follow their direction.
Institutional Sponsorship
Institutional sponsorship refers to evidence that large market participants support a move.
A bullish move has institutional sponsorship when price breaks higher with conviction and later respects the area from which the expansion originated.
A bearish move has institutional sponsorship when price breaks lower aggressively and later rejects the area from which the decline began.
Without institutional sponsorship, a lower-time-frame setup may have little value.
Evidence of sponsorship may include:
- Strong displacement
- A break in market structure
- Price holding above bullish support
- Price holding below bearish resistance
- Repeated reaction from an order block
- Expansion after returning to the point of origin
Institutional sponsorship gives the trader a reason to believe that the move is being supported by participants capable of continuing price delivery.
Why Consolidations Breed Opportunity
Consolidations are not always random periods of inactivity.
They may represent areas where institutional traders are pairing orders and building positions.
A bullish sequence may look like this:
Strong rally → Consolidation → Temporary decline → Stop run → Institutional buying → Expansion higher
A bearish sequence may look like:
Strong decline → Consolidation → Temporary rally → Stop run → Institutional selling → Expansion lower
Retail traders often become impatient inside consolidations. Some buy the breakout, while others sell the opposite side of the range.
Institutional traders may use this liquidity to build positions before moving price toward the next objective.
The consolidation becomes especially important when it forms after strong displacement. The previous displacement suggests that institutional participation is already present.
What Is an Institutional Order Block?
An institutional order block is a price area where institutional orders were likely accumulated before a significant price movement.
Bullish Order Block
A bullish order block is commonly identified as the final bearish candle before a strong bullish expansion that breaks market structure.
The process is:
Bearish candle → Strong bullish displacement → Swing high is broken → Price retraces into bearish candle → Bullish continuation
The bearish candle represents the area where institutional buyers may have accumulated positions.
Bearish Order Block
A bearish order block is commonly identified as the final bullish candle before a strong bearish decline that breaks market structure.
The process is:
Bullish candle → Strong bearish displacement → Swing low is broken → Price retraces into bullish candle → Bearish continuation
The bullish candle represents the area where institutional sellers may have established short positions.
Not every opposite-colored candle is an order block. The candle must be connected to meaningful displacement and a break in market structure.
The Stop Run Before Repricing
Price may temporarily trade below a bullish order block or above a bearish order block before moving in the expected direction.
This movement can be a stop run.
For example, price may decline below an obvious support level and activate sell stops. Institutional buyers may use those sell orders as liquidity to accumulate long positions.
Bullish stop-run model:
Price approaches support → Trades below the low → Sell stops are activated → Institutions buy → Price expands higher
Bearish stop-run model:
Price approaches resistance → Trades above the high → Buy stops are activated → Institutions sell → Price expands lower
A brief violation of support or resistance does not always invalidate the setup. The trader must study whether price quickly rejects the level and returns to the expected institutional direction.
Returning to the Point of Origin
One of the most important concepts in Volume 4 is the return to the point of origin.
The point of origin is the area where an institutional price movement began.
In a bullish market, it is usually located around the final bearish candle before a strong bullish expansion.
In a bearish market, it is usually located around the final bullish candle before a strong bearish decline.
After institutional participants move price aggressively, they may not complete their entire position. Price can later return to the origin of the move, allowing additional orders to be filled.
Bullish model:
Bullish order block → Strong rally → Market structure breaks higher → Price retraces to origin → Institutions add longs → Price rallies again
Bearish model:
Bearish order block → Strong decline → Market structure breaks lower → Price returns to origin → Institutions add shorts → Price declines again
This explains why price frequently revisits the beginning of a strong move before continuing.
ICT Optimal Trade Entry and the Point of Origin
The return-to-origin concept supports the mechanics behind the ICT Optimal Trade Entry, or OTE.
The OTE zone is located between:
- 62% Fibonacci retracement
- 70.5% Fibonacci retracement
- 79% Fibonacci retracement
The 70.5% level is commonly called the sweet spot.
In a bullish setup, the Fibonacci tool is drawn from the relevant swing low to the swing high.
In a bearish setup, it is drawn from the swing high to the swing low.
A stronger OTE setup forms when the retracement zone overlaps with:
- An institutional order block
- A previous support or resistance level
- The point of origin
- A round number
- A session high or low
- A favorable ICT Kill Zone
The Fibonacci measurement does not create the trade by itself. It helps refine the institutional area where price may react.
Using the ICT Kill Zones
ICT Kill Zones are specific periods when meaningful institutional price movement is more likely to occur.
Volume 4 focuses primarily on:
- London Kill Zone
- New York Kill Zone
Once the higher-time-frame bias is known, traders use these time windows to search for retracements into institutional levels.
For a bullish market, the trader watches for a decline during a Kill Zone.
For a bearish market, the trader watches for a rally during a Kill Zone.
A bullish Kill Zone model may look like:
Daily bias bullish → Price trades below Asian range high → London or New York retracement → Bullish order block or OTE → Long entry
A bearish Kill Zone model may look like:
Daily bias bearish → Price trades above Asian range low → London or New York rally → Bearish order block or OTE → Short entry
The Kill Zone does not provide directional bias. It only identifies the time window in which a valid setup may form.
Using the Asian Range as a Filter
The Asian session range can help traders refine entries.
In bullish conditions, buying below the Asian range high is generally more attractive than buying after price has already expanded significantly above it.
A decline below the Asian range low may create an even deeper discount, especially when it aligns with a bullish order block or OTE zone.
In bearish conditions, selling above the Asian range low or near the Asian range high may provide a more favorable premium entry.
The Asian range acts as a reference point for understanding where price is trading within the developing daily range.
High-Probability Buy Framework
A high-probability ICT buy setup may include the following conditions:
- The daily 9 EMA is above the 18 EMA.
- Higher-time-frame structure is bullish.
- Price breaks above a previous swing high.
- The rally begins from a clear bearish candle or consolidation.
- Price retraces into the bullish order block.
- The retracement enters the 62%–79% OTE zone.
- The setup forms during the London or New York Kill Zone.
- Price is trading near support or below the Asian range high.
- A clear liquidity target exists above price.
- Risk can be placed below a logical swing low.
The process is:
Bullish bias → Bullish structure break → Identify point of origin → Wait for retracement → Buy during Kill Zone → Target old highs
High-Probability Sell Framework
A high-probability ICT sell setup may include:
- The daily 9 EMA is below the 18 EMA.
- Higher-time-frame structure is bearish.
- Price breaks below a previous swing low.
- The decline begins from a clear bullish candle or consolidation.
- Price rallies into the bearish order block.
- The retracement enters the 62%–79% OTE zone.
- The setup forms during the London or New York Kill Zone.
- Price is trading near resistance or above the Asian range low.
- A clear liquidity target exists below price.
- Risk can be placed above a logical swing high.
The process is:
Bearish bias → Bearish structure break → Identify point of origin → Wait for rally → Sell during Kill Zone → Target old lows
When Not to Trade
Knowing when not to trade is one of the most important parts of the framework.
Traders should avoid forcing an entry when:
- The daily bias is unclear
- The 9 and 18 EMAs are repeatedly crossing
- Market structure disagrees with the directional framework
- Price is trapped inside a large consolidation
- No clear order block exists
- Price is not within a favorable session
- The OTE zone does not align with institutional support or resistance
- A major economic announcement is approaching
- Price has already completed a large daily expansion
After an unusually large move, the market may consolidate and rebalance. Entering immediately after such expansion may expose the trader to poor reward-to-risk conditions.
Sometimes the correct trading decision is to remain inactive.
Patience and Trade Frequency
The scout sniper framework is not intended to produce trades every day.
Michael J. Huddleston explains:
“You don’t have to trade a lot.”
A trader may find only two to four strong setups in a month. That may be sufficient when the setups are carefully selected and managed properly.
The model encourages traders to:
- Wait for higher-time-frame alignment
- Trade only during planned sessions
- Avoid chasing price
- Limit the number of monthly trades
- Protect capital quickly
- Pursue profits slowly and patiently
The objective is not maximum activity. It is consistent execution.
A Practical Volume 4 Trading Process
The principles of the ICT Forex Scout Sniper Basic Field Guide – Vol. 4 can be organized into the following process.
Step 1: Study the Daily Chart
Determine whether the 9 EMA is above or below the 18 EMA.
Step 2: Confirm Market Structure
Identify whether swing highs or swing lows are being broken.
Step 3: Mark Higher-Time-Frame Levels
Highlight daily, four-hour, and one-hour support and resistance.
Step 4: Identify Institutional Displacement
Look for strong price movement that suggests institutional sponsorship.
Step 5: Locate the Order Block
Mark the final opposite-colored candle before the displacement.
Step 6: Measure the Price Swing
Apply the Fibonacci tool and identify the 62%–79% retracement zone.
Step 7: Wait for the Kill Zone
Focus on the London or New York trading windows.
Step 8: Observe the Return to Origin
Wait for price to revisit the order block or the beginning of the institutional move.
Step 9: Define the Risk
Place the stop beyond a meaningful swing point rather than at an arbitrary distance.
Step 10: Target Liquidity
Use previous highs, previous lows, session extremes, or higher-time-frame objectives as profit targets.
Final Thoughts
The ICT Forex Scout Sniper Basic Field Guide – Vol. 4 teaches traders how to transform general chart observations into a structured institutional trading model.
The process begins with higher-time-frame directional bias. The trader then studies market structure, order flow, displacement, consolidations, and institutional order blocks. After locating the point of origin, the trader waits for price to retrace into an OTE zone during the London or New York Kill Zone.
The model can be summarized as:
Higher-time-frame bias → Institutional momentum → Market structure break → Order block → Return to origin → OTE retracement → Kill Zone entry → Liquidity target
The strength of the ICT (Inner Circle Trader) approach is not found in constant activity. It is found in patience, preparation, and the ability to recognize when institutional sponsorship, price, and time are aligned.
A trader does not need to capture every movement. The trader needs a repeatable framework that identifies when the probability is favorable and when remaining out of the market is the better decision.