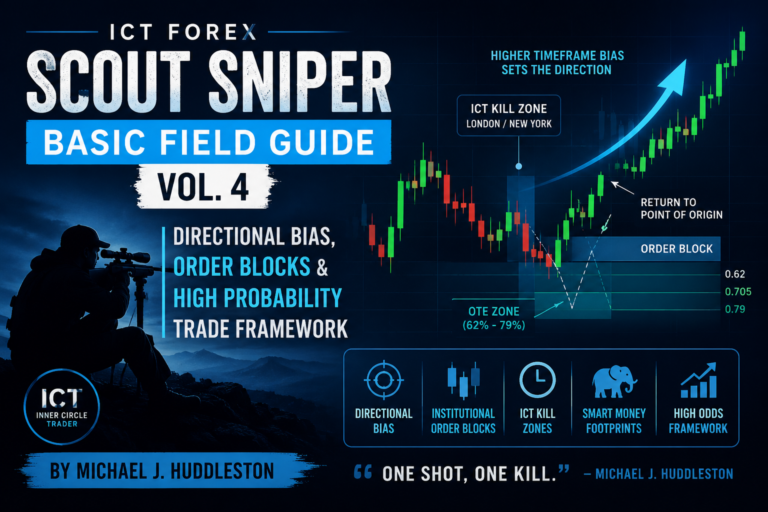
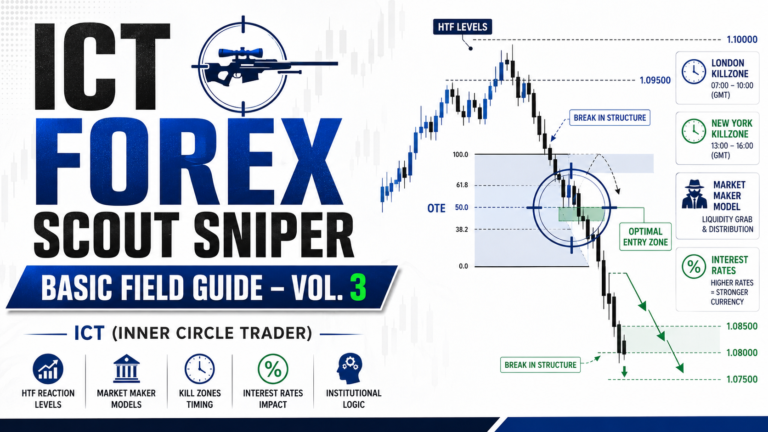
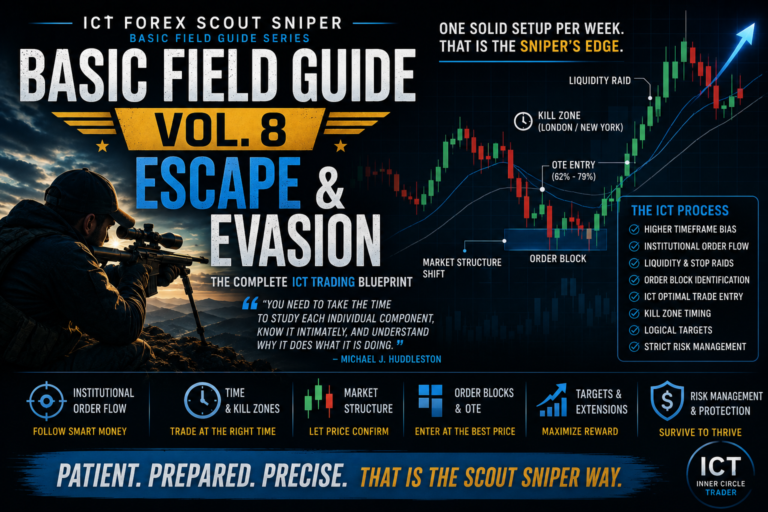
The ICT Forex Scout Sniper Basic Field Guide – Vol. 6, developed and taught by Michael J. Huddleston, focuses on one of the most important areas of professional trading: risk control. This concept is taught in the ICT Forex Scout Sniper Basic Field Guide Series, where traders learn how to project realistic price targets, determine appropriate risk, place stop-loss orders logically, manage open positions, and protect trading capital.
A trader can have an excellent entry model and still fail if risk is poorly managed. Volume 6 therefore shifts the emphasis away from simply finding setups and toward controlling what happens after a position is opened.
As Michael J. Huddleston explains:
“While we essentially can’t remove entirely every aspect of the risk, we can do our best to try to control it.”
The goal is not to eliminate losses. The goal is to ensure that no single loss, losing sequence, or emotional reaction can seriously damage the trading account.
Main Lessons of ICT Forex Scout Sniper Basic Field Guide – Vol. 6
Volume 6 covers several connected concepts:
- Projecting bullish and bearish swing targets
- Using Fibonacci extensions for price objectives
- Understanding market symmetry
- Limiting risk to a percentage of account equity
- Calculating position size from stop distance
- Reducing risk after losing trades
- Using logical stop-loss placement
- Applying time-based stops
- Removing risk gradually as price moves
- Trailing stops using 15-minute market structure
- Taking partial profits
- Avoiding the need to capture the entire price move
Together, these ideas create a structured framework for managing a trade from entry to exit.
Projecting Swing Targets With Fibonacci Extensions
Volume 6 begins by reviewing how traders can project price objectives from an existing market swing.
When price breaks a meaningful swing point, the size of the previous price leg can be projected in the direction of the breakout.
The primary Fibonacci extension levels discussed are:
- 127% extension
- 162% extension
- 200% extension
These levels can help traders estimate where price may pause, react, or complete a measured move.
Bullish Projection
For a bullish projection, identify a meaningful high-to-low price swing. Once price breaks above the selected swing high, project the extension levels upward.
The process is:
Price declines → Swing low forms → Price breaks a previous high → Project 127%, 162%, and 200% targets higher
Bearish Projection
For a bearish projection, identify a meaningful low-to-high swing. Once price breaks below the selected low, project the extension levels downward.
The process is:
Price rallies → Swing high forms → Price breaks a previous low → Project 127%, 162%, and 200% targets lower
The 127% and 162% extensions are generally more practical objectives. The 200% extension may be reached, but traders should not automatically expect price to hit it.
Understanding the Fulcrum Point
A fulcrum point is the swing point used as the reference for a Fibonacci projection after market structure has been broken.
For example, when price breaks below a previous swing low, that low can become the fulcrum for projecting lower objectives.
When price breaks above a previous swing high, the high can become the reference for higher objectives.
The fulcrum helps traders connect three important elements:
- The previous price swing
- The market structure break
- The projected target
This creates a logical price narrative rather than placing profit targets at arbitrary distances.
Market Symmetry
Market symmetry refers to the tendency for price to reproduce the size of a previous swing.
For example, if price moves 100 pips into a swing low and later breaks above the opposite side of the range, the market may attempt to move approximately 100 pips higher.
This concept is closely connected to the 200% Fibonacci extension.
A symmetrical bullish move may look like:
100-pip decline → Bullish structure break → Approximately 100-pip rally
A symmetrical bearish move may look like:
100-pip rally → Bearish structure break → Approximately 100-pip decline
Markets will not always produce exact symmetry. However, clean symmetrical movement often supports a higher-probability target projection.
Do Not Expect Every Target to Be Reached
A projected target is not a guaranteed destination.
Price may reach the 127% extension and reverse before the 162% level. It may reach the 162% extension and fail to complete the 200% projection.
The purpose of target projection is to establish logical objectives, not to predict price with complete certainty.
A disciplined trader may:
- Take partial profit at the first objective
- Hold a smaller position toward the second objective
- Leave a very small portion for the final target
- Exit early when market structure changes
The trader should aim to capture a useful portion of the movement rather than the complete range.
Risk Is the Foundation of Trading
The most important theme in the ICT Forex Scout Sniper Basic Field Guide – Vol. 6 is that risk must be defined before the trade is opened.
Many traders spend most of their time studying entries and almost no time considering how much money they could lose.
Professional trading reverses this process.
Before entering, the trader should know:
- The entry price
- The stop-loss location
- The total stop distance
- The percentage of equity at risk
- The monetary value of the risk
- The position size
- The first profit objective
- The final target
- The conditions that would invalidate the trade
Risk should never be calculated after the position has already been entered.
The 1% Risk Model
A common industry guideline is to risk approximately 2% of account equity on one trade. However, Volume 6 recommends that developing traders consider using 1% or less.
For a $10,000 account:
- 1% risk = $100
- 2% risk = $200
For a $1,000 account:
- 1% risk = $10
- 2% risk = $20
The percentage is based on the total amount that would be lost if the stop-loss order were triggered.
The formula is:
Account equity × Risk percentage = Maximum monetary risk
Example:
$10,000 × 1% = $100 maximum risk
This $100 must then be divided across the number of pips between the entry and stop.
Calculating Pip Value From Stop Distance
After determining the maximum monetary risk, divide it by the stop-loss distance.
The formula is:
Maximum monetary risk ÷ Stop distance = Allowed value per pip
Example:
- Account size: $10,000
- Risk: 1%
- Maximum risk: $100
- Stop loss: 30 pips
$100 ÷ 30 = approximately $3.33 per pip
The trader should then select a position size that keeps the pip value close to or below this amount.
The stop-loss distance should be based on market structure. Position size must adapt to the stop, rather than forcing the same lot size on every trade.
Why Lower Risk Is Better for Developing Traders
New traders often believe that risking less will prevent them from making meaningful profits.
In reality, lower risk provides several important advantages:
- More time to develop skill
- Less emotional pressure
- Greater tolerance for losing streaks
- Reduced temptation to revenge trade
- Better decision-making
- More stable account growth
- Lower probability of account ruin
The first objective of a developing trader should not be to make large amounts of money. It should be to remain in the market long enough to develop consistency.
When Higher Risk May Be Considered
Experienced traders may occasionally increase risk when several higher time frames agree.
For example, a trader might consider higher exposure when:
- Weekly bias is aligned
- Daily bias is aligned
- Four-hour structure is aligned
- Institutional order flow supports the trade
- Entry forms at a major level
- Reward-to-risk is highly favorable
Even in these conditions, risk should remain controlled.
Volume 6 suggests that risking above approximately 3% is generally inappropriate unless the trader is highly experienced and has proven risk-management skills.
For most traders, 1% to 1.5% is more practical.
Reduce Risk After a Losing Trade
One of the strongest lessons in Volume 6 is that traders should not automatically use the same risk after a loss.
Suppose a trader risks 2% and loses.
The natural reaction may be to risk another 2% on the next trade in an attempt to recover quickly. This often begins the emotional cycle of revenge trading.
A more disciplined approach is to reduce risk.
For example:
- First trade risk: 2%
- After one loss: reduce to 1%
- After another loss: reduce to 0.5%
- Remain at reduced risk until consistency returns
This approach has two advantages:
- It limits drawdown during a poor trading period.
- It removes the pressure to recover losses immediately.
The trader may require several winning trades to return to the previous equity level, but the process is calmer and safer.
Do Not Chase the Previous Equity High
After a loss, traders often become emotionally attached to the previous account balance.
For example, if an account falls from $10,000 to $9,800, the trader may focus entirely on recovering the missing $200.
This creates a dangerous mindset.
The trader may:
- Increase position size
- Lower setup standards
- Enter too frequently
- Ignore stop-loss rules
- Hold losing positions
- Close winners too quickly
Instead of trying to return immediately to a previous balance, the trader should continue applying the same process with reduced risk.
Account recovery should be the result of disciplined execution, not forced trading.
Logical Stop-Loss Placement
A stop loss should be placed where the original trade idea is no longer valid.
It should not be placed according to:
- A random number of pips
- Fear of losing too much money
- The size of the desired position
- A nearby round number without context
- The amount the trader wants to earn
In a bullish setup, the stop may be placed below:
- A meaningful swing low
- An institutional order block
- Higher-time-frame support
- A liquidity sweep
- The low that should remain protected
In a bearish setup, the stop may be placed above:
- A meaningful swing high
- A bearish order block
- Higher-time-frame resistance
- A liquidity sweep
- The high that should remain protected
The trader should allow price enough room to fluctuate naturally while ensuring that the financial risk remains within the predefined limit.
Why a 30-Pip Stop Can Be Practical
Volume 6 discusses a stop of approximately 30 pips as a practical reference for many Forex setups.
This is not a universal rule. The appropriate stop depends on:
- The currency pair
- The time frame
- Volatility
- Session conditions
- Entry precision
- Market structure
However, a 30- to 40-pip stop may provide enough room for developing traders who do not yet possess highly precise entries.
A very tight stop can cause the trader to be removed by normal volatility even when the original analysis remains correct.
The objective is not to use the smallest possible stop. The objective is to use the most logical stop.
Buying at Wholesale and Selling at Retail
In bullish conditions, traders should attempt to buy when price is temporarily suppressed near institutional support.
This is described as buying at wholesale prices.
The trader should avoid waiting until price has already rallied for several days and the bullish movement is obvious to everyone.
In bearish conditions, the trader should attempt to sell when price rallies into institutional resistance.
This is similar to selling at retail prices.
The general process is:
Bullish bias → Decline into support → Buy at discount → Sell into higher prices
Bearish bias → Rally into resistance → Sell at premium → Cover into lower prices
A good trade often begins at a price that feels uncomfortable because the market is temporarily moving against the anticipated longer-term direction.
Good Trades Should Move With Conviction
A high-quality entry should normally begin moving in the expected direction without excessive delay.
This does not mean price must immediately explode toward the target. However, the market should demonstrate some degree of institutional sponsorship.
Warning signs include:
- Price remains trapped near the entry
- Market repeatedly tests the stop area
- No meaningful displacement appears
- Several sessions pass without progress
- Market structure fails to confirm the move
When a trade does not behave as expected, the trader should consider reducing risk or closing the position.
The ICT Time Stop
A time stop is used when the market fails to move within a reasonable period.
Rather than waiting indefinitely for either the profit target or stop loss, the trader considers whether the lack of movement itself is evidence that the setup is weak.
Volume 6 provides general time-stop guidelines.
Daily-Chart Setup
Allow approximately three trading days.
If the position has not moved meaningfully after three days, consider:
- Closing part of the trade
- Reducing the stop exposure
- Moving closer to break-even
- Closing the entire position
Four-Hour Setup
Allow approximately one trading day.
If there is no progress, reduce exposure or close the trade.
One-Hour Setup
Allow approximately two major trading sessions.
For example:
London session → New York session
If price remains stagnant after these sessions, the trader should question the setup.
Intraday Setup
For intraday trades, the trade should generally develop within the same trading day, often between London open and London close.
The specific timing is flexible, but the central principle is clear: capital should not remain trapped in a trade that is not behaving as expected.
Watching Your Six
“Watching your six” is a military expression referring to protecting what is behind you.
In trading, it means protecting capital when a trade begins showing weakness.
If a trade remains stagnant, the trader may:
- Remove half the position
- Reduce the remaining stop risk
- Move the stop closer to break-even
- Exit with a small controlled loss
This is not emotional panic. It is active risk management.
A slow trade ties up equity that may be better used in a clearer opportunity.
Gradually Removing Risk
Risk should not necessarily be removed immediately after price moves a few pips in profit.
Moving the stop too quickly can cause the trader to be stopped out by ordinary market volatility.
A gradual risk-reduction model may look like this:
Initial Position
- Initial stop: 30 pips
- Full predefined risk remains
Price Begins Moving Favorably
Reduce the risk from 30 pips to approximately 20 pips if market structure allows.
First Target Is Reached
Reduce the stop to approximately 10 pips of risk or another logical structural level.
Price Approaches the Second Target
Move the remaining position to break-even.
Trend Continues
Begin trailing the stop using market structure.
The exact sequence may vary, but the principle is to reduce risk methodically rather than emotionally.
Do Not Rush to Break-Even
Moving the stop to break-even too quickly is one of the most common trading mistakes.
Forex markets regularly retrace because of:
- Session changes
- Liquidity collection
- Market inefficiencies
- Normal volatility
- Rebalancing
- Short-term profit-taking
A retracement does not always mean the trade is failing.
If the stop is moved directly behind price, normal volatility may close the trade before the expected expansion occurs.
The trader should wait until price has achieved a meaningful objective or created enough new structure to justify moving the stop.
Using Partial Profit-Taking
Volume 6 supports taking partial profits as a method of protecting equity.
For example:
- Take a portion off at 20 or 30 pips
- Hold the remaining position toward a larger target
- Trail the stop on the remaining position
Partial profit-taking helps protect the trader from a complete reversal after price has already moved favorably.
Some traders argue that the entire position should remain open until the final target. However, this assumes the final target will definitely be reached.
There is no guarantee that price will reach the second or third objective.
The professional objective is not maximum possible profit. It is consistent protection of capital while still participating in favorable moves.
The Lion’s Share Principle
A trader does not need to capture the exact bottom, exact top, or every pip of a movement.
The objective is to capture the lion’s share of the move.
A trader may:
- Enter after the exact turning point
- Exit before the final high
- Leave a small portion of the move for other participants
- Still achieve an excellent result
Trying to capture the complete move often causes traders to:
- Hold too long
- Miss profit targets
- Watch winners turn into losses
- Refuse partial exits
- Increase emotional pressure
It is better to consistently secure a meaningful portion than occasionally capture the entire range.
Trailing Stops With the 15-Minute Chart
Volume 6 recommends using the 15-minute chart to trail stops for trades designed to capture a weekly move.
The 15-minute time frame provides a clear view of:
- Session highs and lows
- Intraday support and resistance
- Short-term dealing ranges
- Market structure
- Successive swing points
- Normal weekly volatility
It is detailed enough to manage risk without reacting to every minor price fluctuation.
Bullish Trailing-Stop Method
For a bullish trade:
- Identify the two most recent 15-minute swing lows.
- Determine which of those two lows is lower.
- Place the stop approximately 10 to 15 pips below that lower swing low.
- Continue updating the stop as new higher swing lows form.
This allows price to maintain a sequence of higher highs and higher lows without placing the stop directly behind current price.
The model gives the market enough room to retrace while still protecting accumulated profit.
Bearish Trailing-Stop Method
For a bearish trade:
- Identify the two most recent 15-minute swing highs.
- Determine which of the two highs is higher.
- Place the stop approximately 10 to 15 pips above that higher swing high.
- Continue adjusting the stop as new lower swing highs form.
This gives a bearish move enough space to continue producing lower highs and lower lows.
Why Use Two Swing Points?
Using only the most recent swing point may place the stop too close to the current market.
Short-term price fluctuations can easily trade through the latest swing before continuing in the original direction.
Using the most recent two swing points creates additional structural protection.
It allows for:
- Deeper Fibonacci retracements
- Normal intraday volatility
- Session-based retracements
- Continued higher-low or lower-high formation
- Greater probability of remaining in the trade
The stop is still moved in the direction of profit, but it is not placed so aggressively that ordinary price movement removes the trader.
The Weekly High and Low Framework
Stop management can also be supported by the expected weekly profile.
In bullish conditions, the weekly low commonly forms on:
- Monday
- Tuesday
- No later than Wednesday’s London open in many cases
In bearish conditions, the weekly high commonly forms during the same early-week period.
Once the expected weekly low or high has formed and price begins expanding, the trader can use the 15-minute structure to trail the position toward higher-time-frame objectives.
This combines:
- Weekly timing
- Directional bias
- Intraday structure
- Risk management
Risk Reduction Versus Bailout
Risk reduction and trade bailout are not the same.
Risk Reduction
The original setup remains valid, but the trader reduces exposure.
This may include:
- Closing part of the position
- Tightening the stop modestly
- Moving to partial break-even
- Reducing the remaining monetary risk
Bailout
The trader decides that the setup is no longer behaving correctly and exits completely.
This may occur when:
- Market structure shifts against the trade
- The time stop is reached
- Price fails to respond from the expected level
- A major opposing displacement appears
- The original trade premise is invalidated
Both decisions are valid when based on predefined rules.
A Practical Volume 6 Risk-Management Process
The principles of the ICT Forex Scout Sniper Basic Field Guide – Vol. 6 can be organized into the following process.
Step 1: Identify the Setup
Establish directional bias, institutional level, entry pattern, and expected target.
Step 2: Determine Invalidation
Identify the price level that would prove the trade idea incorrect.
Step 3: Measure Stop Distance
Calculate the number of pips between the entry and invalidation level.
Step 4: Define Percentage Risk
Use approximately 1% or less while developing consistency.
Step 5: Calculate Position Size
Divide the maximum monetary risk by the stop distance.
Step 6: Mark Profit Objectives
Use:
- Old highs and lows
- 127% extension
- 162% extension
- 200% extension
- Higher-time-frame support and resistance
Step 7: Apply a Time Stop
Decide how long the trade should be allowed to develop.
Step 8: Reduce Risk Gradually
Do not rush the stop directly to break-even.
Step 9: Take Partial Profits
Secure part of the move at a logical first objective.
Step 10: Trail the Remaining Position
Use the two most recent 15-minute swing lows or highs.
Step 11: Reduce Risk After a Loss
Lower the percentage risk until trading consistency returns.
Common Risk-Management Mistakes
Traders should avoid the following errors.
Risking Too Much
Large risk creates emotional pressure and increases the possibility of serious drawdown.
Using the Same Lot Size on Every Trade
Position size must change according to stop distance.
Moving the Stop Too Quickly
Normal volatility can remove the trader before the setup completes.
Refusing to Take Partial Profit
Price may reverse before reaching the final target.
Holding Stagnant Trades Too Long
A time stop helps free capital from weak positions.
Increasing Risk After a Loss
This often turns a small drawdown into a major losing sequence.
Trying to Recover Immediately
The trader should focus on execution rather than returning to a previous balance.
Trying to Capture Every Pip
Consistently capturing a useful portion is more realistic.
Final Thoughts
The ICT Forex Scout Sniper Basic Field Guide – Vol. 6 teaches that trading success is not determined only by finding accurate entries. Long-term consistency depends on controlling risk before, during, and after every trade.
The complete model can be summarized as:
Directional bias → Institutional entry → Logical stop → Fixed percentage risk → Projected targets → Partial profit → Gradual risk reduction → Structural trailing stop
The ICT (Inner Circle Trader) approach accepts that every trade contains uncertainty. No setup, target, support level, or market projection is guaranteed.
The professional trader does not attempt to eliminate uncertainty. The professional trader limits the financial impact when the analysis is wrong and protects capital when the analysis is correct.
As Michael J. Huddleston emphasizes:
“Your goal is to have the maximum protection from losing your money.”
That principle is the foundation of sustainable trading. Entries create opportunities, but disciplined risk management keeps the trader in the game long enough to benefit from them.