The ICT Forex Scout Sniper Basic Field Guide – Vol. 8, developed and taught by Michael J. Huddleston, brings together the complete framework presented throughout the ICT Forex Scout Sniper Basic Field Guide Series. This final volume does not depend on one isolated entry pattern. Instead, it explains how directional bias, institutional order flow, market structure, liquidity, ICT Kill Zones, order blocks, Fibonacci tools, risk management, and patience work together as one complete trading process.
The purpose of Volume 8 is to help traders move from studying individual concepts to applying them in a structured sequence.
As Michael J. Huddleston explains:
“You need to take the time to study each individual component, know it intimately, and understand why it does what it is doing.”
A trader does not need to predict every movement or trade every day. The objective is to identify one strong weekly opportunity that is supported by institutional price delivery and managed with disciplined risk.
What Is the Purpose of ICT Forex Scout Sniper Basic Field Guide – Vol. 8?
Volume 8 serves as the final blueprint of the scout sniper framework.
It connects the individual lessons from the earlier volumes into a repeatable trading model. The trader learns how to move from the highest time frame to the execution chart without losing the original market narrative.
The complete process includes:
- Understanding why markets move
- Following institutional sponsorship
- Determining higher-time-frame direction
- Identifying liquidity and stop raids
- Marking institutional order blocks
- Waiting for a retracement
- Using ICT Optimal Trade Entry
- Trading during Kill Zones
- Projecting logical targets
- Applying strict equity management
- Limiting trade frequency
- Reviewing performance consistently
The goal is not to create a complicated system. The goal is to organize the concepts in the correct order.
Markets Move Because of Large Funds
Major price movements are created by large banks, investment firms, institutional funds, and other participants with enough capital to influence price.
Retail traders do not create sustained market trends.
Institutional traders leave visible footprints because their orders are too large to enter and exit without affecting price.
These footprints may appear as:
- Strong displacement
- Rapid movement away from a price level
- Breaks of important swing highs or lows
- Sustained directional movement
- Reactions from institutional order blocks
- Stop raids followed by sharp reversals
- Expansion during specific trading sessions
The ICT trader does not attempt to guess what every institution is doing. The trader waits until institutional activity becomes visible through price action.
Wait for Smart Money to Move First
One of the most important lessons in Volume 8 is that traders should not attempt to predict every market move before it begins.
Instead, they should wait for evidence that institutional participants have already committed to a direction.
The sequence is:
Institutional displacement → Market structure shift → Retracement → Entry opportunity
This approach develops patience because the trader is not required to enter at the exact high or low.
When price moves strongly away from a significant level, the trader studies the origin of that movement. If price later retraces into the same area, it may provide a controlled entry opportunity.
Institutional Sponsorship
Institutional sponsorship means that a market move is supported by participants capable of sustaining it.
A bullish move may demonstrate sponsorship when price:
- Reacts from higher-time-frame support
- Breaks above a meaningful swing high
- Produces strong bullish displacement
- Respects a bullish order block
- Continues creating higher highs and higher lows
A bearish move may demonstrate sponsorship when price:
- Reacts from higher-time-frame resistance
- Breaks below a meaningful swing low
- Produces strong bearish displacement
- Respects a bearish order block
- Continues creating lower highs and lower lows
A setup without institutional sponsorship is less likely to produce the sustained movement needed for a favorable reward-to-risk ratio.
Why Quiet Markets Can Be Dangerous
New traders are often attracted to quiet markets because price appears less volatile and therefore safer.
However, quiet markets may produce:
- Repeated false signals
- Tight consolidations
- Small stop-outs
- Overtrading
- Poor reward-to-risk
- Emotional revenge trading
Professional traders need movement.
Volatility is often evidence that a participant with significant capital has entered the market. This does not mean traders should chase every volatile candle. It means they should pay attention when volatility appears at a meaningful time and price level.
Fast markets can be managed by reducing leverage. A stagnant market cannot be forced to produce an opportunity.
The One-Shot, One-Kill Weekly Model
The scout sniper framework is designed around finding one strong setup per week.
The trader should not attempt to participate in every intraday move.
The process is:
Study higher time frames → Establish directional bias → Wait for early-week setup → Enter during Kill Zone → Manage risk → Take profit → Return to sidelines
This model helps develop:
- Patience
- Selectivity
- Discipline
- Consistent execution
- Reduced emotional pressure
- Lower transaction costs
- Better risk control
Michael J. Huddleston emphasizes that the trader should focus on one solid weekly setup rather than constant market activity.
Higher-Time-Frame Direction Comes First
The complete ICT framework begins on the higher time frames.
The daily and four-hour charts reveal the broader direction of institutional order flow.
The trader studies:
- Major support and resistance
- Swing highs and swing lows
- Market structure
- Institutional order blocks
- Displacement
- Seasonal tendencies
- Yield relationships
- Liquidity objectives
- Premium and discount conditions
The lower time frames should never be used to create a directional bias that contradicts the higher-time-frame narrative.
The Role of Yield
Volume 8 revisits the principle that price frequently seeks yield.
Interest-rate and bond-market relationships may offer insight into the broader currency environment.
A trader may study:
- US 10-year yields
- German 10-year yields
- UK 10-year yields
- US 10-year Treasury futures
Treasury futures and yields generally move inversely.
The simplified relationship is:
Treasury futures rising → Yields declining
Treasury futures declining → Yields rising
Yield analysis is not used as a direct entry signal. It acts as an additional factor supporting or challenging the technical directional bias.
Using Seasonal Tendencies
Seasonal tendencies provide a general roadmap showing when a market has historically demonstrated recurring directional behavior.
They should not be treated as guaranteed forecasts.
A seasonal model becomes more useful when it agrees with:
- Current market structure
- Higher-time-frame order flow
- Support or resistance
- Institutional displacement
- Yield direction
- Liquidity objectives
The trader should focus more on periods when a market historically produces a large directional swing rather than trying to buy every seasonal low or sell every seasonal high.
Daily-Chart Analysis Checklist
The daily chart provides the primary market framework.
1. Study Yield Direction
Determine whether the broader yield environment supports strength or weakness in the currency being studied.
2. Review Seasonal Tendencies
Use seasonal information as a secondary roadmap rather than a standalone signal.
3. Mark Major Support and Resistance
Display at least two to three years of price history when possible.
This allows the trader to identify major levels that may not be visible on a short chart window.
4. Review Weekly and Monthly Levels
Weekly and monthly support and resistance can produce major reversals.
These levels should not be ignored simply because the trader intends to execute on a lower time frame.
5. Determine Market Structure
Ask whether the market is:
- Bullish
- Bearish
- Consolidating
- Shifting direction
Identify whether an important swing high or swing low has been broken.
6. Identify the Active Price Swing
Determine whether the trader is operating within:
- Long-term swing
- Intermediate-term swing
- Short-term swing
This helps define appropriate expectations and targets.
7. Study Institutional Order Flow
Observe whether price is taking out highs or lows and whether displacement supports continued movement.
8. Apply the 9 and 18 EMAs
The daily directional framework may be simplified with two exponential moving averages:
- 9-period EMA
- 18-period EMA
When the 9 EMA is above the 18 EMA, focus on long setups.
When the 9 EMA is below the 18 EMA, focus on short setups.
9. Mark Swing Highs and Lows
Note the open, high, low, and close of the candles forming important swing points.
These prices may become sensitive reaction levels later.
10. Mark Institutional Order Blocks
Identify the final opposite-colored candle before strong displacement and a market structure break.
All important daily levels should be carried down to the four-hour chart.
Four-Hour Analysis Checklist
The four-hour chart provides the intermediate view of institutional activity.
The daily bias must remain the foundation.
Maintain the Daily Bias
If the daily chart is bullish, the four-hour chart should be used to find support and long opportunities.
If the daily chart is bearish, use the four-hour chart to find resistance and short opportunities.
Identify Stop-Raid Candidates
The four-hour chart often reveals obvious liquidity pools around:
- Equal highs
- Equal lows
- Previous swing points
- Consolidation boundaries
- Old session extremes
Ask where profitable traders are likely protecting their positions.
Confirm Four-Hour Order Flow
Bullish order flow is strengthened when a meaningful four-hour high is broken.
Bearish order flow is strengthened when a meaningful four-hour low is broken.
Combine Order Flow With Structure
A high or low should not be studied in isolation.
Determine whether price is creating:
- Long-term high or low
- Intermediate-term high or low
- Short-term high or low
Refine Order Blocks
Daily order blocks may contain smaller, more precise four-hour order blocks.
These refined areas can improve entry location and reduce stop distance.
Use Institutional Price Levels
ICT commonly studies institutional levels such as:
- Full figures
- 50 levels
- 20 levels
- 80 levels
These round-number areas may overlap with order blocks or Fibonacci retracements.
If the daily chart is unclear, the four-hour chart can provide additional guidance. However, the trader should avoid forcing a bias when both charts are mixed.
60-Minute Analysis Checklist
The 60-minute chart provides the short-term view required to prepare a trade setup.
Keep Daily and Four-Hour Analysis in Focus
The one-hour chart must not replace the higher-time-frame narrative.
Ideally, the daily and four-hour charts agree.
Refine Higher-Time-Frame Order Blocks
Look for a sudden move away from a level and a later return to the point of origin.
The one-hour chart may reveal a smaller institutional order block inside the broader daily or four-hour zone.
Study Two to Three Weeks of Price
A one-hour chart displaying several weeks of data provides a clear view of:
- Weekly swings
- Previous highs and lows
- Liquidity pools
- Active dealing ranges
- Retracement opportunities
Identify Logical Stop Locations
Mark where retail traders and existing institutional positions may have protective stops.
These areas may become liquidity targets before the next directional move.
Use Market Structure and Fibonacci Together
Apply Fibonacci retracements to meaningful swings that agree with the higher-time-frame bias.
The ideal setup often provides at least a 1:3 reward-to-risk ratio.
Apply Day-of-Week Theory
In bullish conditions, the weekly low commonly forms between Monday and Wednesday.
In bearish conditions, the weekly high commonly forms during the same early-week period.
The trader is not trying to trade every day. The trader is waiting for the weekly setup to form.
15-Minute and Five-Minute Execution Checklist
The 15-minute and five-minute charts are used for execution, not for determining the primary market direction.
Maintain the Higher-Time-Frame Perspective
The daily, four-hour, and one-hour analysis must remain visible mentally or through marked levels.
Separate Each Trading Day
Use vertical separators to identify Monday, Tuesday, Wednesday, Thursday, and Friday.
This makes day-of-week tendencies easier to observe.
Mark the Asian Range
Identify the Asian session high and low.
Volume 8 uses 05:00 GMT as the end of the Asian range.
The Asian range may provide:
- Liquidity references
- Intraday premium and discount
- False breakout levels
- Judas Swing opportunities
- Daily range boundaries
Focus on the London Session
In a bearish model, the daily high often forms between approximately 07:00 and 10:00 GMT.
In a bullish model, the daily low may form during the same period.
This countertrend movement is often described as the Judas Swing.
Combine Time and Price
Do not trade simply because London is open.
The setup should form inside:
- Higher-time-frame order block
- Support or resistance
- OTE retracement
- Institutional level
- Liquidity raid
- Relevant dealing range
Study London Close
The opposite side of the daily range may form around 15:00 to 16:00 GMT.
If London open forms the daily high, London close may help form the daily low.
If London open forms the daily low, London close may help form the daily high.
Use New York as a Secondary Opportunity
If the London setup is missed, the New York session between approximately 12:00 and 14:00 GMT may offer a continuation entry.
New York frequently retraces part of the London move before continuing toward the daily objective.
However, traders should be careful when price is reaching major higher-time-frame support or resistance because New York may produce a reversal instead.
ICT Kill Zones
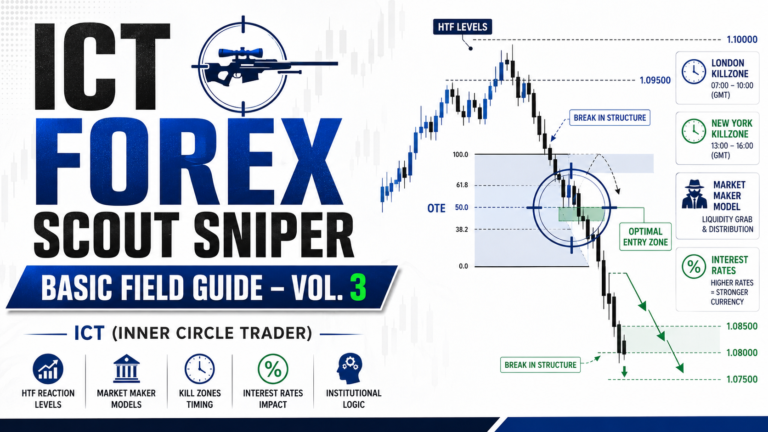
ICT Kill Zones identify periods when institutional volatility and important turning points are more likely.
The primary Kill Zones in this framework are:
- London open
- New York open
- London close
Kill Zones do not create direction.
They answer the question of when a setup may form.
Higher-time-frame analysis answers which direction to trade.
Order blocks and Fibonacci answer where to trade.
Market structure and displacement answer whether institutional sponsorship is present.
A valid trade requires these components to work together.
Market Maker Buy and Sell Models
The market maker models explain how price may be moved toward liquidity before reversing.
Market Maker Buy Model
Market makers may price the market lower to accumulate long positions.
The general sequence is:
Consolidation → Price moves lower → Sell-side liquidity is taken → Institutional buying → Bullish displacement → Retracement → Continuation higher
Market Maker Sell Model
Market makers may price the market higher to establish short positions.
The sequence is:
Consolidation → Price moves higher → Buy-side liquidity is taken → Institutional selling → Bearish displacement → Retracement → Continuation lower
The trader does not chase the initial expansion. The trader waits for price to return to a favorable institutional level.
Enter Opposite the Intended Profit Direction
The ICT Optimal Trade Entry forces the trader to enter while price is temporarily moving against the expected profitable direction.
For a bullish trade, the trader buys during a decline.
For a bearish trade, the trader sells during a rally.
This provides several advantages:
- Entry is closer to the stop
- Reward-to-risk improves
- Dealer spread is overcome more quickly
- The trader avoids chasing displacement
- Entries occur closer to wholesale or retail pricing
This mindset is difficult for new traders because bearish candles make buying uncomfortable and bullish candles make selling uncomfortable.
However, institutional traders accumulate positions during these countertrend moves.
ICT Optimal Trade Entry
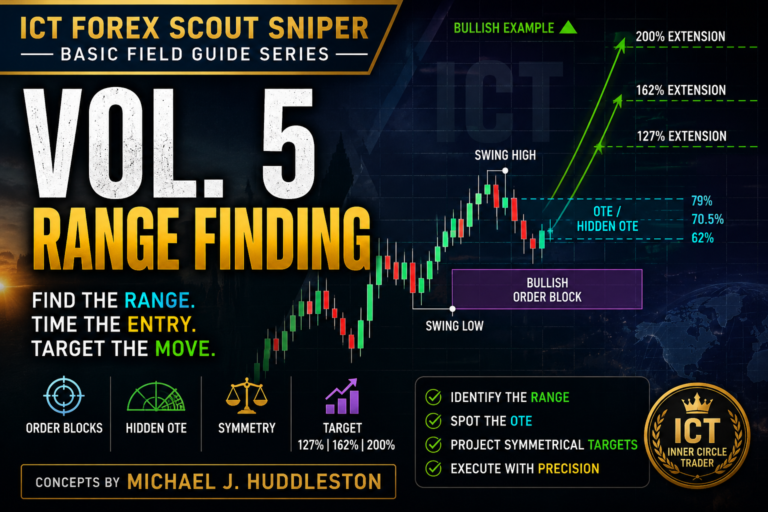
The ICT Optimal Trade Entry, or OTE, generally focuses on the Fibonacci retracement area between:
- 62%
- 70.5%
- 79%
The 70.5% level is commonly treated as the sweet spot.
A bullish OTE setup requires:
- Bullish higher-time-frame bias
- Bullish institutional order flow
- A meaningful low-to-high price swing
- Retracement into the OTE zone
- Overlap with a bullish order block
- Entry during a favorable Kill Zone
A bearish OTE setup requires the opposite conditions.
The Fibonacci level should not be traded alone. It is most effective when it overlaps with time, price, structure, and institutional sponsorship.
Liquidity and Stop Raids
Significant price moves frequently occur after stops have been raided.
Obvious liquidity may rest above:
- Equal highs
- Double tops
- Previous session highs
- Clean swing highs
- Consolidation highs
Liquidity may rest below:
- Equal lows
- Double bottoms
- Previous session lows
- Clean swing lows
- Consolidation lows
When price briefly trades through these levels and sharply rejects, the move may indicate that institutions have used the stop orders as liquidity.
A trader who does not enter during the raid can wait for:
- Displacement
- Market structure shift
- Order block formation
- Retracement into the order block
This often provides a safer confirmation-based entry.
Selecting Price Targets
Targets should be based on logical market objectives.
Possible targets include:
- Previous highs
- Previous lows
- Session highs and lows
- Equal highs or lows
- Higher-time-frame liquidity
- Fibonacci extensions
- Opposing order blocks
- Premium or discount objectives
The trader may use:
- 127% extension
- 162% extension
- 200% extension
A previous high or low can serve as the first target. Fibonacci extensions can then be used for additional profit objectives.
Reward-to-Risk Expectations
Volume 8 encourages traders to focus on opportunities that offer at least a 1:3 reward-to-risk ratio.
For example:
- Risk: 20 pips
- Expected reward: 60 pips or more
A favorable reward-to-risk ratio reduces the percentage of winning trades required for profitability.
The trader does not need to be correct on every setup.
With disciplined risk and favorable payouts, the trader can remain profitable even with occasional losing trades.
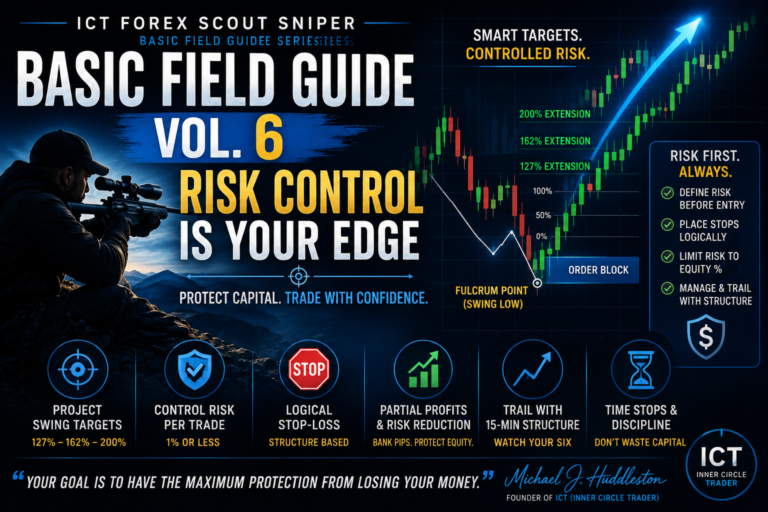
Risk Management Rules
Risk control remains a central part of the final framework.
Risk for Developing Traders
Beginning traders should consider risking approximately:
- 0.25% per trade
- 0.50% per trade
This can be practised even in a demo account to build correct habits.
Risk for More Consistent Traders
As discipline and consistency improve, risk may gradually move toward:
- 1% per trade
Volume 8 advises traders to remain cautious about exceeding 2%.
Reduce Risk After a Loss
If a trade loses, reduce the risk and leverage by half on the next trade.
Example:
1% loss → Next trade risks 0.5%
Another loss → Next trade risks 0.25%
Remain at reduced risk until the drawdown is recovered through disciplined execution.
The trader should not increase risk in an attempt to recover immediately.
Do Not Rush the Setup
The availability of personal free time does not create a valid trading opportunity.
A trader should not enter simply because:
- It is Monday
- London is open
- The trader is sitting at the computer
- Price has started moving quickly
- A lower-time-frame pattern appears
- A previous trade was missed
- The trader wants to recover a loss
The correct setup must occur at the correct time, price, and higher-time-frame location.
Patience is part of the trading model, not an optional personality trait.
When Not to Use Lower Time Frames
A trader should not analyse the 15-minute or five-minute chart when there is no foundation on the daily or four-hour chart.
Without higher-time-frame direction, the lower charts can persuade the trader to enter almost any position.
This produces:
- Contradictory signals
- Overtrading
- Random directional changes
- Poor stop placement
- Low-quality setups
- Emotional decision-making
The lower-time-frame chart is the final stage of analysis, not the beginning.
The Complete Bullish ICT Scout Sniper Process
A bullish setup can be summarized as follows:
- Daily chart suggests higher prices.
- Four-hour chart agrees with the bullish bias.
- Institutional order flow breaks a meaningful high.
- A bullish order block is identified.
- Monday, Tuesday, or Wednesday produces a retracement.
- Price enters discount or the OTE zone.
- The retracement overlaps with the order block.
- The setup forms during London or New York Kill Zone.
- Lower-time-frame structure confirms bullishness.
- Risk is limited to 1% or less.
- A previous high becomes the first objective.
- Fibonacci extensions provide additional targets.
- Profits are secured and the trader returns to the sidelines.
The flow is:
Daily bullish → Four-hour bullish → Order block → Early-week decline → OTE → Kill Zone → Buy → Target liquidity
The Complete Bearish ICT Scout Sniper Process
A bearish setup follows the opposite structure:
- Daily chart suggests lower prices.
- Four-hour chart confirms bearishness.
- Institutional order flow breaks a meaningful low.
- A bearish order block is identified.
- Monday, Tuesday, or Wednesday produces a rally.
- Price enters premium or the OTE zone.
- The retracement overlaps with bearish resistance.
- The setup forms during London or New York Kill Zone.
- Lower-time-frame structure confirms bearishness.
- Risk is limited.
- A previous low becomes the first target.
- Fibonacci extensions define additional objectives.
- The trader takes profit and waits for the next weekly opportunity.
The flow is:
Daily bearish → Four-hour bearish → Order block → Early-week rally → OTE → Kill Zone → Sell → Target liquidity
The Simplified ICT Trading Plan
Although the complete framework contains many components, the final procedure can be simplified.
Michael J. Huddleston summarizes the model by explaining that when the daily and four-hour charts agree, the trader can use the one-hour chart to find a setup offering at least three times the potential reward compared with the risk.
The simplified bullish plan is:
- Daily and four-hour charts bullish
- Buy on Monday, Tuesday, or Wednesday
- Use London or New York for timing
- Enter through OTE and an order block
- Target a previous high
- Use Fibonacci extensions for additional profit
- Risk no more than 1%
The bearish model is the exact opposite.
Why the Framework Appears Complicated
The individual ICT concepts may initially appear to contain too many moving parts.
However, trading is a developmental skill.
Learning to trade is similar to learning to ride a bicycle. The beginner must first learn balance, then pedalling, steering, braking, and eventually more advanced movements.
Each concept in the scout sniper framework has a purpose:
- Higher time frames define direction.
- Market structure confirms delivery.
- Order blocks define institutional price.
- Liquidity explains where price may seek orders.
- Kill Zones define timing.
- OTE refines entry.
- Fibonacci defines objectives.
- Risk management protects capital.
Once each component is understood, the entire process becomes natural and can be summarized in a small checklist.
Common Mistakes to Avoid
Predicting Instead of Waiting
Allow institutional movement to reveal direction first.
Chasing Price
Missed trades should be allowed to go without emotional pursuit.
Trading Quiet Markets
Wait for institutional volatility and sponsorship.
Using Kill Zones Alone
Time without higher-time-frame direction is not enough.
Trading Fibonacci Alone
OTE must overlap with structure, order blocks, and directional bias.
Ignoring Liquidity
Clean highs and lows may be targeted before the true move begins.
Starting With the Five-Minute Chart
Always establish the daily and four-hour narrative first.
Overleveraging
A strong setup can still damage the account when risk is excessive.
Trading Every Day
The objective is one strong weekly setup, not constant activity.
Final Thoughts
The ICT Forex Scout Sniper Basic Field Guide – Vol. 8 completes the scout sniper framework by connecting every major element of institutional price analysis into one disciplined procedure.
The complete model is:
Yield and seasonal context → Daily directional bias → Four-hour confirmation → One-hour setup → Institutional order block → Liquidity raid → OTE retracement → Kill Zone entry → Structured risk → Logical targets
The ICT (Inner Circle Trader) approach does not depend on predicting every market movement. It depends on waiting for institutional sponsorship, entering at a favorable price, and controlling risk.
The greatest advantage of the model is not a perfect entry signal. It is the discipline to avoid trading when the required conditions are absent.
As Michael J. Huddleston states:
“We are not looking to trade every day. We’re looking for one solid setup per week consistently.”
When the trader studies each component, follows the process in order, and applies controlled risk, the framework becomes a clear and repeatable trading plan rather than a collection of unrelated concepts.