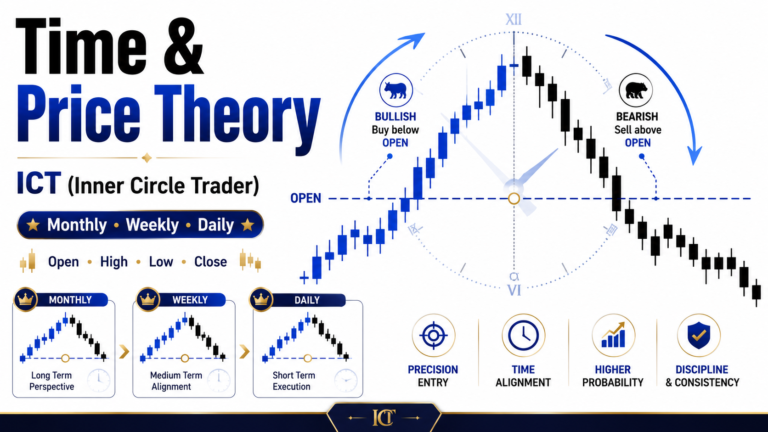
ICT PO3 (Power of Three) – Accumulation, Manipulation, Distribution is a price delivery model used to understand how a market can build positions, create a deceptive move, and then expand toward its real objective.
The concept was taught by Michael J. Huddleston, founder of ICT (Inner Circle Trader), in the ICT Forex – Market Maker Primer Course. PO3 focuses on the relationship between the opening price, liquidity, and the range expansion that develops during a specific period.
The basic sequence is:
Accumulation → Manipulation → Distribution
Michael J. Huddleston describes the model simply:
“Looking for accumulation, waiting for manipulation and then looking for a period of distribution.”
Although PO3 is often demonstrated with a daily range, the concept can be studied on any chartable timeframe.
What Is ICT PO3?
The ICT Power of Three, commonly called ICT PO3, is a model that divides price delivery into three important phases:
- Accumulation
- Manipulation
- Distribution
The model helps traders understand why price may initially move in the opposite direction before making its primary expansion.
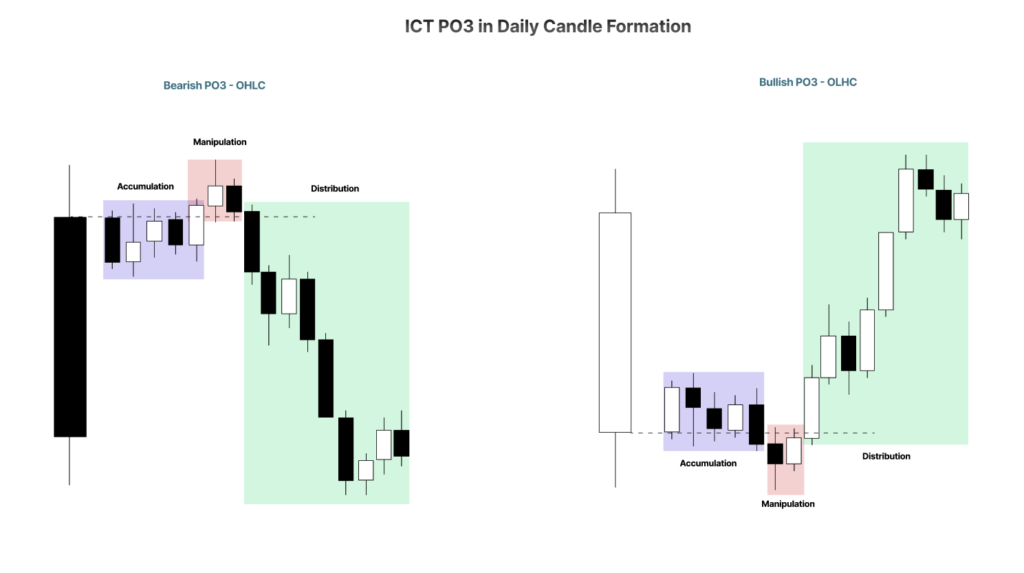
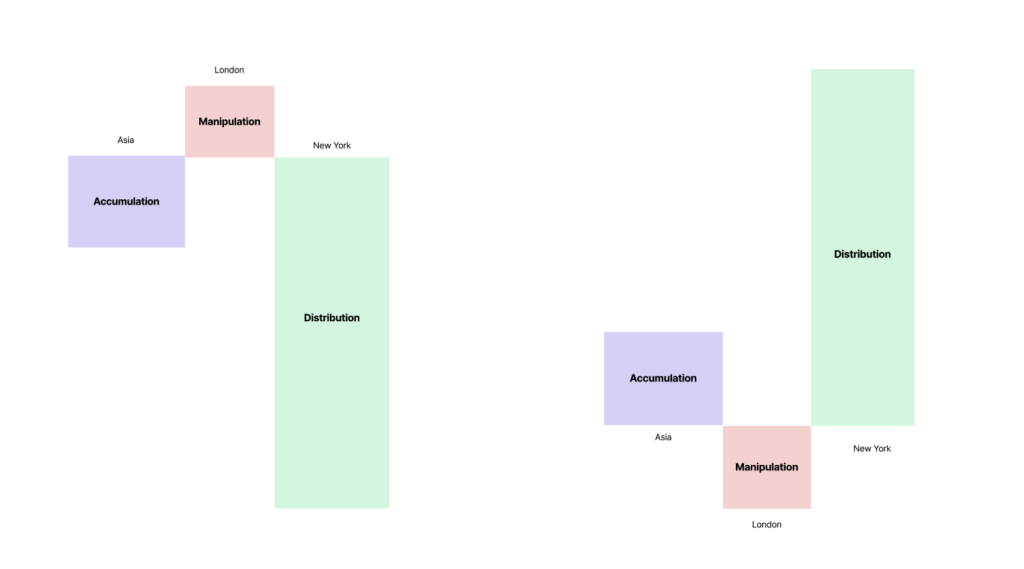
A bullish PO3 may appear as:
Accumulation Near Open → Manipulation Below Open → Distribution Higher
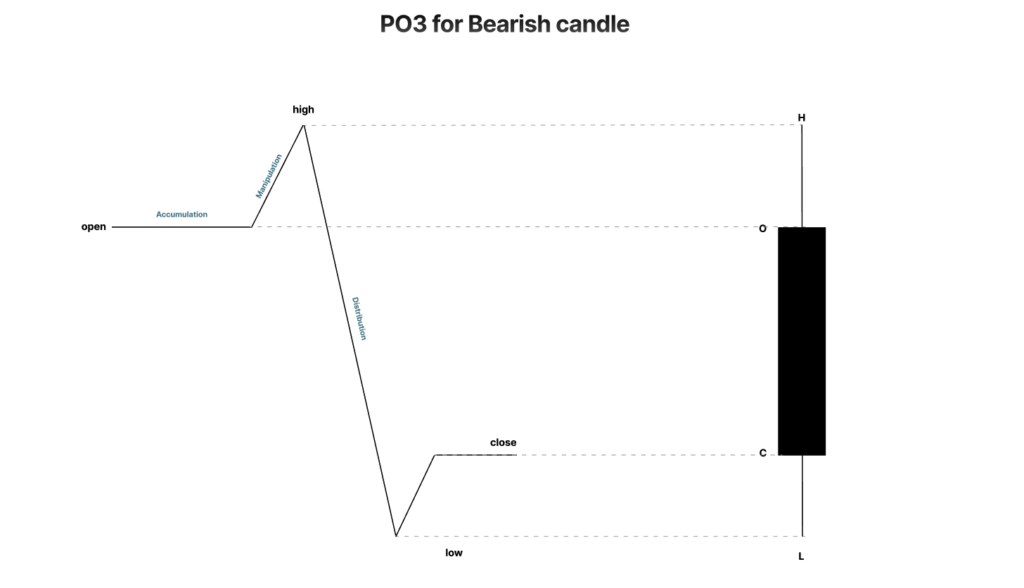
A bearish PO3 may appear as:
Accumulation Near Open → Manipulation Above Open → Distribution Lower
The opening price is an important reference point because it represents the initial value of the selected time interval before the major price imbalance develops.
The Four Price References Behind PO3
ICT PO3 can be studied through the basic structure of every candle or price bar:
Open → High → Low → Close
The opening price is the initial value price before the main price imbalance.
The closing price represents the ending value after the price movement has occurred.
The distance between the open and close can represent the major range expansion or directional price imbalance.
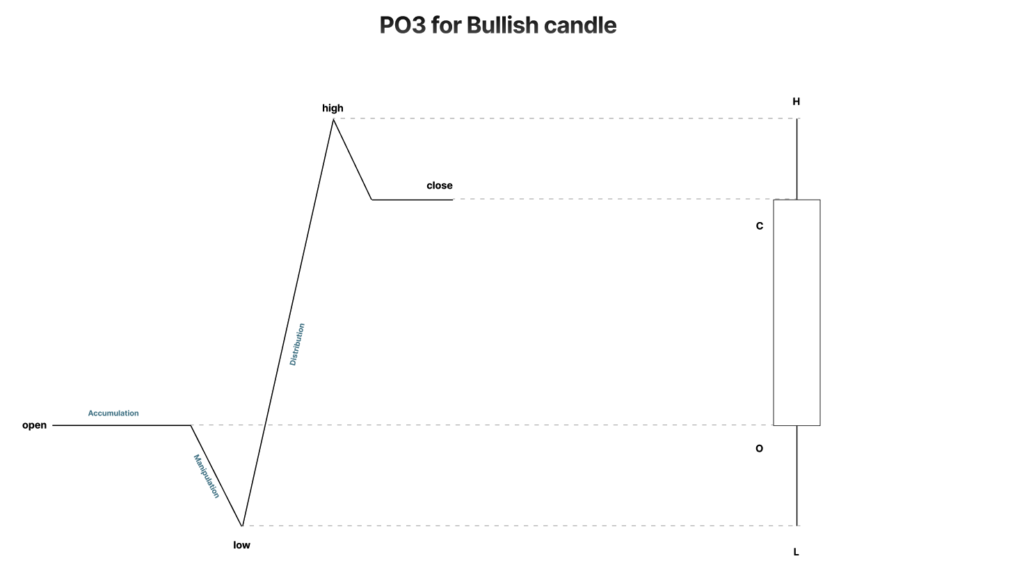
For a bullish range:
Open → Low → High → Bullish Close
For a bearish range:
Open → High → Low → Bearish Close
Understanding the relationship between the open, high, low, and close helps the trader recognize the three PO3 phases.
Phase 1: Accumulation
Accumulation is the first phase of ICT PO3.
It generally develops around the opening price.
Price may consolidate, move sideways, or remain relatively contained while positions are built.
The direction of accumulation depends on the expected market bias.
Bullish Accumulation
When the market is expected to be bullish, ICT looks for long positions accumulating near the opening price.
The basic idea is:
Bullish Bias → Opening Price → Long Accumulation
Price may appear quiet or directionless during this period.
However, the market may be preparing for a larger bullish expansion.
Bearish Accumulation
When the market is expected to be bearish, ICT looks for short positions accumulating near or above the opening price.
The model becomes:
Bearish Bias → Opening Price → Short Accumulation
The accumulation phase provides the foundation for the manipulation that may follow.
Phase 2: Manipulation
Manipulation is the deceptive phase of the ICT PO3 model.
Price moves in a direction that encourages traders to take positions opposite to the expected expansion.
In bullish conditions, price may suddenly decline.
In bearish conditions, price may suddenly rally.
This movement can engineer new liquidity while simultaneously neutralizing traders already positioned correctly.
Huddleston explains:
“The market has a tendency of creating this fake move.”
This false directional movement is one of the most recognizable characteristics of Power of Three.
Liquidity Engineering During Manipulation
Manipulation can create liquidity by encouraging traders to enter the market at unfavorable prices.
Consider a bullish market.
Price quickly trades below an old low.
Breakout traders may interpret the move as bearish strength and enter short positions.
Their sell orders create selling interest at lower prices.
At the same time, smart money seeking long positions requires counterparties willing to sell.
The process becomes:
Price Runs Below Old Low → Traders Sell → Sell Liquidity Enters Market → Smart Money Buys
This is described as engineering short liquidity.
The bearish model works in reverse.
Price Runs Above Old High → Traders Buy → Buy Liquidity Enters Market → Smart Money Sells
Liquidity is therefore not simply a chart level. PO3 studies how price movements can create willing counterparties for larger positions.
Neutralizing Liquidity
Manipulation can also remove traders who were already correctly positioned.
Suppose the market is bullish.
Some traders may have purchased near the opening price.
Price then moves sharply lower.
Their protective sell stops may be triggered.
Those traders are removed from the market before the bullish expansion begins.
This is neutralizing long liquidity.
The sequence is:
Trader Buys Correct Direction → Manipulation Drops Price → Stop Is Triggered → Trader Is Removed → Market Expands Higher
In bearish conditions, traders already holding shorts may have buy stops above the market.
The manipulation moves higher and triggers those stops before price declines.
The sequence becomes:
Trader Sells Correct Direction → Manipulation Rallies → Buy Stop Is Triggered → Trader Is Removed → Market Expands Lower
This is why a trader can have the correct directional bias but still be stopped out before the expected price movement occurs.

Bullish ICT PO3 Explained
A bullish PO3 model begins with the expectation of higher prices.
The complete structure is:
Accumulation → Manipulation Lower → Distribution Higher
Bullish Accumulation
Long positions are accumulated near the opening price.
Price may consolidate around the open.
Bullish Manipulation
Price moves below the opening price.
The decline may:
- Run below short-term lows
- Trigger sell stops from existing longs
- Encourage breakout traders to sell short
- Create bearish sentiment
However, when the broader market premise is bullish, this decline may be the manipulation phase.
Smart money can pair buying interest with the new selling orders entering the market.
Huddleston explains:
“We want to be buying at that opening price or below it ideally.”
Bullish Distribution
After the manipulation, price expands higher.
The bullish range expansion becomes the distribution phase.
Price may target an old high where buy stops are resting.
Breakout traders may begin buying as price moves above the high.
At the same time, larger long positions can be reduced or closed against this buying interest.
The bullish PO3 sequence is:
Open → Accumulation → Run Below Low → Sell-Side Liquidity Taken → Bullish Expansion → Buy-Side Liquidity Targeted
Bearish ICT PO3 Explained
The bearish Power of Three model is the inverse of the bullish structure.
The complete sequence is:
Accumulation → Manipulation Higher → Distribution Lower
Bearish Accumulation
Short positions are accumulated around or above the opening price.
Price may initially consolidate.
Bearish Manipulation
Price moves aggressively higher.
The rally may:
- Run above old highs
- Trigger buy stops from existing short traders
- Encourage breakout traders to buy
- Create bullish sentiment
When the broader bias is bearish, this rally may represent manipulation rather than genuine bullish strength.
The new buying interest provides counterparties for smart money selling.
The order-pairing concept becomes:
Buy Stops Enter Market → Market Orders Buy → Smart Money Sells Into Buying
Bearish Distribution
Price eventually expands lower.
The bearish price delivery can target old lows where sell stops are positioned.
Once those sell stops are triggered, additional sellers enter the market.
Short positions can then be covered through buying against this selling interest.
The bearish PO3 sequence is:
Open → Accumulation → Run Above High → Buy-Side Liquidity Taken → Bearish Expansion → Sell-Side Liquidity Targeted
The Opening Price in ICT PO3
The opening price is one of the most important reference points in the Power of Three model.
In bullish conditions:
Opening Price or Below = Area to Study for Buying
In bearish conditions:
Opening Price or Above = Area to Study for Selling
The opening price should not be used as a blind entry signal.
The trader must first establish directional bias.
Once a bullish premise exists, a manipulation below the open becomes important.
Once a bearish premise exists, a manipulation above the open becomes important.
The key principle is:
Bias First → Opening Price Reference → Manipulation → Distribution
Without directional context, a move below or above the opening price cannot automatically be classified as PO3 manipulation.
ICT PO3 and the Judas Swing
The manipulation phase of PO3 closely resembles what ICT traders commonly recognize as a Judas Swing.
A Judas Swing is an engineered price movement opposite to the anticipated primary direction.
Bullish condition:
Expected Higher Prices → Price Manipulates Lower First
Bearish condition:
Expected Lower Prices → Price Manipulates Higher First
The false move can create liquidity and encourage traders to commit to the wrong directional idea.
Once the liquidity objective of the manipulation is completed, price can aggressively expand in the intended direction.
How Market Makers Pair Orders in PO3
One of the important ideas behind ICT PO3 is order pairing.
Every market transaction requires buying and selling interest.
Large positions require sufficient liquidity.
Bullish Order Pairing
Smart money wants to buy.
Price moves below old lows.
Sell stops and breakout sell orders enter the market.
Smart money buying can be paired with this selling interest.
Public Selling → Smart Money Buying
During the bullish distribution phase, price reaches higher levels.
Buy stops and breakout buyers enter.
Smart money can reduce long positions against the new buyers.
Public Buying → Smart Money Long Exit
Bearish Order Pairing
Smart money wants to sell.
Price moves above old highs.
Buy stops and breakout buy orders enter.
Smart money selling can be paired with this buying interest.
Public Buying → Smart Money Selling
During bearish distribution, price reaches lower levels.
Sell stops enter beneath old lows.
Smart money can cover short positions against the new sellers.
Public Selling → Smart Money Short Exit
This liquidity relationship is central to understanding the logic presented in the Power of Three model.
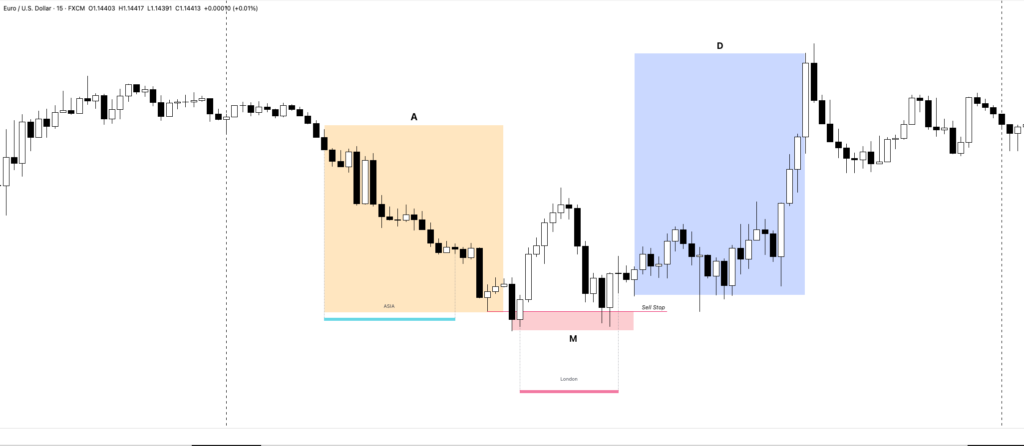
How to Identify Bullish PO3 on a Chart
A trader can use the following process.
Step 1: Establish a Bullish Bias
Determine that the market is expected to seek higher prices.
Do not begin with PO3 manipulation before establishing direction.
Step 2: Mark the Opening Price
Use the relevant opening price for the timeframe being studied.
Step 3: Identify Accumulation
Look for consolidation or price containment around the opening price.
Step 4: Wait for Manipulation Lower
Price should move below the opening area or raid nearby sell-side liquidity.
Watch for:
- Old lows
- Equal lows
- Short-term lows
- Sell stops below consolidation
Step 5: Look for Bullish Price Delivery
The market should reject the lower prices and begin moving higher.
Step 6: Target Buy-Side Liquidity
Look for old highs or liquidity above the market.
The full sequence becomes:
Bullish Bias → Accumulation → Sell-Side Raid → Bullish Expansion → Buy-Side Liquidity
How to Identify Bearish PO3 on a Chart
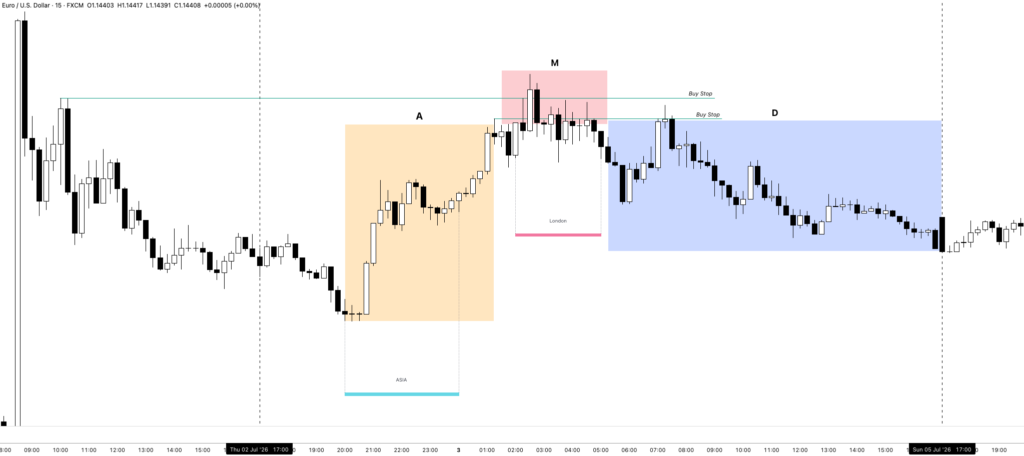
The bearish process is reversed.
Step 1: Establish a Bearish Bias
Determine that price is expected to seek lower levels.
Step 2: Mark the Opening Price
Use the appropriate opening price.
Step 3: Identify Accumulation
Study price consolidation near the opening price.
Step 4: Wait for Manipulation Higher
Look for price to trade above the opening area or attack buy-side liquidity.
Potential references include:
- Old highs
- Equal highs
- Short-term highs
- Buy stops above consolidation
Step 5: Look for Bearish Price Delivery
Price should reject the higher levels and begin expanding lower.
Step 6: Target Sell-Side Liquidity
Study old lows and liquidity resting below price.
The sequence becomes:
Bearish Bias → Accumulation → Buy-Side Raid → Bearish Expansion → Sell-Side Liquidity
PO3 Can Be Applied to Different Timeframes
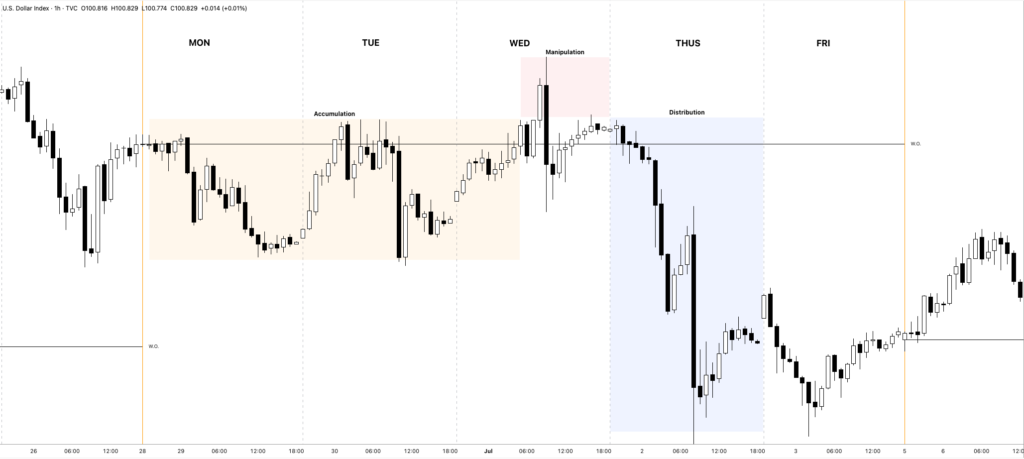
Michael J. Huddleston explains that the same phenomenon can be applied to different measurements of time.
Therefore, PO3 may be studied as:
- Monthly PO3
- Weekly PO3
- Daily PO3
- Intraday PO3
The logic remains similar.
Every selected time interval has:
Beginning Time → Opening Price → High → Low → Ending Time → Close
A bullish daily PO3 may manipulate below the daily open before expanding higher.
A bullish weekly PO3 may trade below the weekly opening price before expanding higher during the week.
The fractal nature of price allows the PO3 framework to appear on different time horizons.
Common Mistakes When Trading ICT PO3
Identifying PO3 Without Directional Bias
A random consolidation and liquidity sweep is not automatically a Power of Three setup.
Directional context is important.
Entering During Accumulation Without Confirmation
Accumulation can continue longer than expected.
The trader should understand the anticipated manipulation and distribution.
Trading in the Direction of Manipulation
This is one of the major traps PO3 attempts to explain.
A sharp decline during a bullish setup can encourage shorts immediately before bullish expansion.
Ignoring the Opening Price
The open is an important value reference within the model.
Ignoring Liquidity
Manipulation should be studied in relation to stops, old highs, old lows, and willing market participants.
Chasing Distribution
Once price has already completed a large expansion, the trader may be entering late in the PO3 cycle.
The ideal objective is to understand the model before the range expansion becomes obvious.
Simple ICT PO3 Trading Framework
A practical PO3 process is:
Step 1: Determine Bias
Bullish or bearish?
Step 2: Mark the Opening Price
Identify the initial value reference.
Step 3: Observe Accumulation
Look for price containment near the open.
Step 4: Anticipate Manipulation
Bullish → Expect possible movement lower.
Bearish → Expect possible movement higher.
Step 5: Identify the Liquidity Raid
Bullish → Sell-side liquidity.
Bearish → Buy-side liquidity.
Step 6: Wait for Price to Deliver in the Expected Direction
Look for strong directional movement away from the manipulation.
Step 7: Target Opposing Liquidity
Bullish → Buy-side liquidity.
Bearish → Sell-side liquidity.
The complete model is:
Bias → Open → Accumulation → Manipulation → Liquidity Raid → Distribution
Final Thoughts
ICT PO3 (Power of Three) – Accumulation, Manipulation, Distribution provides a framework for understanding how a trading range can develop from the opening price to its eventual directional expansion.
The model contains three phases:
Accumulation → Manipulation → Distribution
During accumulation, positions are built around the opening price.
During manipulation, price creates a deceptive movement that can engineer new liquidity and remove correctly positioned traders.
During distribution, price expands toward the anticipated objective and opposing liquidity.
In bullish conditions:
Accumulate Longs → Manipulate Lower → Distribute Higher
In bearish conditions:
Accumulate Shorts → Manipulate Higher → Distribute Lower
For ICT (Inner Circle Trader) traders, the important lesson is not to automatically chase sudden price movement. Instead, determine directional bias, mark the opening price, identify where liquidity is positioned, and consider whether the apparent breakout is actually the manipulation phase of a larger Power of Three range.