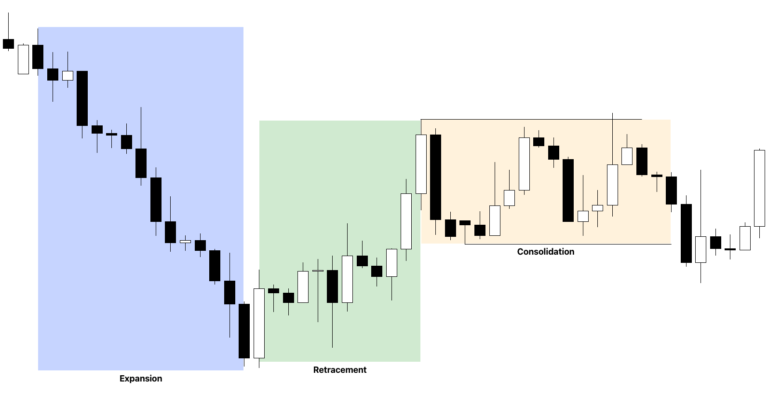
What To Focus On Right Now is an important beginner framework taught by Michael J. Huddleston, the founder of ICT (Inner Circle Trader) concepts, in ICT Mentorship Core Content – Month 1. The lesson explains what a developing trader should study before trying to forecast every market movement or search for complicated trade setups.
Many new ICT traders immediately want to learn Order Blocks, Fair Value Gaps, Optimal Trade Entry and directional bias.
But Michael J. Huddleston teaches a more basic starting point.
First learn to observe price.
Build a daily price action log.
Mark important highs and lows.
Study where price moves quickly.
Identify clean highs and clean lows.
Record when daily and weekly highs or lows form.
Huddleston explains:
“You need to go back to square one.”
The main purpose of What To Focus On Right Now is to build chart-reading experience before trying to predict future price.
What Should a New ICT Trader Focus On?
A new ICT (Inner Circle Trader) student should focus primarily on observing and documenting price action.
Do not immediately try to predict:
The next daily high.
The next daily low.
The exact market direction.
The next 100-pip movement.
The perfect entry.
At the beginning, the trader should learn how price behaves around important reference points.
Michael J. Huddleston specifically warns:
“Resist the urge to forecast price movements.”
The beginner’s objective is observation.
The trader should collect examples and build experience through repeated chart study.
Start With a Daily Price Action Log
The first major task is creating a daily price action log with charts.
This is not simply a trading journal containing profit and loss.
The price action log should document how the market behaved.
Every trading day, save or capture charts.
Mark important levels.
Study where the high and low formed.
Note how price reacted around previous highs and lows.
The purpose is to create a personal collection of price behavior.
Huddleston explains:
“Every single trading day you’re going to document price action.”
Over time, the trader begins seeing repeating characteristics.
The chart log becomes a personal study database.
Use the Correct Amount of Price Data
The lesson gives a specific chart-view framework.
Daily Chart
The daily chart should display approximately 9 to 12 months of price action.
This provides enough historical perspective without placing several years of data on the chart.
Use the daily chart to identify major recent highs and lows.
4-Hour Chart
The 4-hour chart should display approximately 3 months of price action.
Transfer the important daily levels to the 4-hour chart.
Then identify additional highs, lows and important price movements.
1-Hour Chart
The 1-hour chart should display at least 3 weeks of price action.
This timeframe helps study the weekly range and shorter-term price structure.
Huddleston describes the hourly chart as an important reference for short-term and day traders.
15-Minute Chart
The 15-minute chart should display approximately 3 to 4 days of price action.
This chart is used to study recent daily highs, daily lows and intraday price delivery.
The basic framework is:
Daily = 9–12 months
4H = 3 months
1H = 3 weeks
15M = 3–4 days
Each timeframe provides a different level of price perspective.
Mark Quick Movements Away From Price Levels
One of the first things an ICT student should mark is where price moves quickly away from a particular level.
For example, price may trade around a level and then suddenly rally.
Or price may quickly sell off from a specific price range.
These movements are important.
Huddleston instructs students to:
“Note where price shown a quick movement from a specific level.”
At this beginner stage, the trader does not need to immediately label every move as an Order Block or Fair Value Gap.
First notice the movement.
Ask:
Where did price accelerate?
Where did price strongly reject?
Which price level produced the expansion?
This observation becomes the foundation for understanding institutional order flow later.
Mark Recent Untested Highs and Lows
The trader should also identify recent highs and lows that have not been retested.
Suppose price creates a high.
The market moves lower.
Price has not returned to that high.
The level should be marked.
The same applies to an old low that has not recently been revisited.
These levels may influence future price delivery.
The trader should not automatically assume every old high or low will be taken immediately.
Simply mark the reference point.
Over time, observe how price interacts with these levels.
This practice begins developing an understanding of liquidity.
Identify Clean Highs and Clean Lows
Clean highs and clean lows are another major focus in the lesson.
A clean high may appear when two highs form near the same price level.
These can look like:
Equal highs.
A double top.
Relatively equal highs.
Buy stops may build above these highs.
A clean low can form when two lows appear in close proximity.
These may look like:
Equal lows.
A double bottom.
Relatively equal lows.
Sell stops may build below the lows.
Huddleston explains that clean highs can become:
“A big bullseye for price to want to go up into that area.”
The reverse applies to clean lows.
The beginner should practice identifying these areas on historical charts.
Study Previous Day High and Previous Day Low
On the 15-minute chart, the trader should mark the Previous Day High and Previous Day Low.
These are important intraday price references.
Suppose Tuesday forms a high and low.
On Wednesday, price may trade above Tuesday’s high.
Buy-side liquidity is taken.
Price may then reverse and move toward Tuesday’s low.
In the lecture video example, price traded through the previous day’s high and later moved below the previous day’s low.
The important lesson is to observe how price interacts with daily liquidity references.
Each day, mark:
Previous Day High
Previous Day Low
Then study:
Which level is taken first?
Does price continue through the level?
Does price quickly reject?
Does price later seek the opposite side?
Do not try to predict the answer yet.
Document the behavior.
Record When Daily and Weekly Highs and Lows Form
The trader should record what day and time important highs and lows form.
For the weekly range, note which day forms the weekly high.
Also note which day forms the weekly low.
Then identify the trading session or Kill Zone.
Did the high form during London?
Did the low form during New York?
The same idea applies to every trading day.
Record:
Daily High time.
Daily Low time.
Trading session.
Day of the week.
This information later helps develop market timing and price-delivery expectations.
But during the beginner stage, the objective is data collection.
Observe first.
Understand later.
Start With One Currency Pair
The lesson recommends focusing on one currency pair when starting the exercise.
This reduces unnecessary chart switching.
The trader becomes familiar with how one market behaves.
Open the daily chart.
Mark recent highs and lows.
Move to the 4-hour chart.
Transfer the daily levels.
Find additional clean highs, clean lows and fast price movements.
Then move to the hourly chart.
Study weekly and intraday structure.
Finally, use the 15-minute chart to monitor recent daily highs and lows.
The process is:
Daily → 4H → 1H → 15M
Studying one pair repeatedly helps the trader build a deeper understanding of price behavior.
Keep Analysis Charts Separate
Michael J. Huddleston also recommends keeping charts organized.
Do not put every piece of analysis on one chart.
A chart containing dozens of lines, boxes and labels can become confusing.
The lesson suggests maintaining separate chart views.
One chart can contain the higher timeframe analysis and important price levels.
Another chart can be used for the 15-minute daily study.
A separate execution chart can be used when monitoring a current setup.
This helps the trader avoid becoming emotionally attached to an old analysis.
Market conditions can change.
The trader needs flexibility.
Huddleston explains that traders should not:
“Marry the ideas that you have in your analysis.”
Analysis is a reference.
It is not a guarantee that the market must follow the trader’s expectation.
Do Not Force Market Direction
The market can move higher.
It can move lower.
It can consolidate.
The trader works with probabilities.
At this stage of learning, the beginner should not impose a personal expectation on price.
Suppose your analysis suggests higher prices.
Real-time price action begins behaving differently.
Do not hold the bullish idea simply because it is written in your journal.
Study the new information.
Change the analysis.
Or move to the sidelines.
Huddleston explains:
“It’s going to happen because it’s going to happen.”
The market does not move because the trader wants it to.
The objective is to get in sync with price delivery.
Why Daily Chart Study Is Important
Daily documentation creates exposure.
Exposure creates experience.
Experience helps the trader understand repeating price behavior.
A beginner may hear concepts such as:
Order Block.
Liquidity Void.
Fair Value Gap.
Buy-Side Liquidity.
Sell-Side Liquidity.
At first, the concepts may feel complicated.
But repeated chart observation creates visual familiarity.
The trader begins noticing that price repeatedly moves away from certain levels.
Old highs are revisited.
Old lows are taken.
Equal highs attract price.
Equal lows become liquidity references.
Daily chart study builds this recognition.
The trader is training their eyes before trying to execute advanced setups.
What Not to Focus On Right Now
The lesson is also clear about what beginners should avoid.
Do not rush to forecast every market move.
Do not search for a trade every day.
Do not fill the chart with indicators.
Do not bring every previous trading belief into ICT study.
Do not assume knowing advanced ICT terminology gives you an advantage.
Do not skip chart logging.
Do not make the chart unnecessarily complicated.
The focus should remain simple:
Observe price.
Mark highs and lows.
Find clean liquidity levels.
Note fast price movements.
Record daily price action.
Huddleston explains:
“For now primarily the only thing I want you to be doing is starting with a daily chart.”
The foundation comes before advanced forecasting.
Simple ICT Chart Study Routine
A beginner can use the following routine.
Daily Chart
Load 9 to 12 months of price.
Mark major recent highs and lows.
Mark levels where price quickly moved away.
Identify untested highs and lows.
4-Hour Chart
Load approximately 3 months of price.
Transfer daily levels.
Mark additional clean highs and lows.
Study strong price movements.
1-Hour Chart
Load approximately 3 weeks.
Study the weekly range.
Identify intraday highs and lows.
Transfer important higher timeframe levels.
15-Minute Chart
Load 3 to 4 days.
Mark Previous Day High.
Mark Previous Day Low.
Record the current day’s high and low.
Note when the high and low form.
Save the chart in the daily price action log.
Repeat the same process every trading day.
Final Thoughts on What To Focus On Right Now
What To Focus On Right Now teaches ICT students to stop rushing toward advanced trade setups and first develop price-reading experience.
The concept, taught by Michael J. Huddleston in ICT Mentorship Core Content – Month 1, focuses on building a daily chart study routine.
Start with one currency pair.
Use the daily, 4-hour, 1-hour and 15-minute charts.
Mark recent highs and lows.
Identify fast price movements.
Find clean highs and clean lows.
Track Previous Day High and Previous Day Low.
Record when daily and weekly highs and lows form.
Most importantly, avoid trying to forecast every movement during the early learning stage.
As Michael J. Huddleston explains:
“Resist the urge to forecast price movements.”
The objective is simple.
Observe price → Document price → Review price → Build experience
This daily process creates the foundation needed to understand advanced ICT (Inner Circle Trader) concepts later.